Crop Productivity Analysis#
Data#
The following datasets are utilized in this analysis for calculating and mapping crop productivity over the past years:
Dynamic World Dataset:
Source: Dynamic World - Google and the World Resources Institute (WRI)
Description:The Dynamic World dataset provides a near real-time, high-resolution (10-meter) global land cover classification. It is derived from Sentinel-2 imagery and utilizes machine learning models to classify land cover into nine distinct classes, including water, trees, grass, crops, built areas, bare ground, shrubs, flooded vegetation, and snow/ice. The dataset offers data with minimal latency, enabling near-immediate analysis and decision-making.
Spatial Resolution: 10 meters.
Temporal Coverage: Data is available since mid-2015, updated continuously as Sentinel-2 imagery becomes available capturing near Real-time.
MODIS Dataset:
Source: NASA’s Moderate Resolution Imaging Spectroradiometer MODIS on Terra and Aqua satellites.
Description: The MODIS dataset provides a wide range of data products, including land surface temperature, vegetation indices, and land cover classifications. It is widely used for monitoring and modeling land surface processes.
Spatial Resolution: 250 meters.
Temporal Coverage: Data is available from 2000 to the present, with daily to 16-day composite products.
Administrative Boundaries (HDX):
Source: Humanitarian Data Exchange HDX.
Description: Geographic boundaries used for spatial aggregation and administrative analysis, such as calculating productivity metrics by region (e.g., governorate or district).
Use Case: The administrative boundaries are used to aggregate EVI statistics by region and facilitate reporting at various administrative levels.
Crop area statistics#
| Name | PCODE | Crop Area (ha) in 2015 | Crop Area (ha) in 2025 | % Change in Crop Area (2015-2025) | Absolute % Change in Crop Area (2015-2025) | |
|---|---|---|---|---|---|---|
| 0 | Al-Hasakeh | SY08 | 714854.27 | 572730.74 | -19.88 | 19.88 |
| 1 | Aleppo | SY02 | 677159.30 | 508074.11 | -24.97 | 24.97 |
| 2 | Ar-Raqqa | SY11 | 225887.99 | 272511.45 | 20.64 | 20.64 |
| 7 | Hama | SY05 | 305300.15 | 246210.97 | -19.35 | 19.35 |
| 8 | Homs | SY04 | 244544.04 | 198439.45 | -18.85 | 18.85 |
| 9 | Idleb | SY07 | 241147.59 | 183459.61 | -23.92 | 23.92 |
| 5 | Dar'a | SY12 | 143501.25 | 130346.10 | -9.17 | 9.17 |
| 6 | Deir-ez-Zor | SY09 | 107231.44 | 116376.97 | 8.53 | 8.53 |
| 3 | As-Sweida | SY13 | 91130.55 | 102869.49 | 12.88 | 12.88 |
| 11 | Quneitra | SY14 | 63330.46 | 90956.85 | 43.62 | 43.62 |
| 12 | Rural Damascus | SY03 | 72813.91 | 72269.95 | -0.75 | 0.75 |
| 13 | Tartous | SY10 | 20160.27 | 25117.26 | 24.59 | 24.59 |
| 10 | Lattakia | SY06 | 15344.79 | 21233.06 | 38.37 | 38.37 |
| 4 | Damascus | SY01 | 240.34 | 252.29 | 4.97 | 4.97 |
Crop Seasonality#
Using this time series dataset of EVI images, we apply several pre-processing steps to extract critical phenological parameters: start of season (SOS), middle of season (MOS), end of season (EOS), length of season (LOS), etc. This workflow is heavily inspired by the TIMESAT software.
Pre-processing steps
Remove outliers from dataset on per-pixel basis using median method: outlier if median from a moving window < or > standard deviation of time-series times 2.
Interpolate missing values linearly
Smooth data on per-pixel basis (using Savitsky Golay filter, window length of 3, and polyorder of 1)
Phenology Process
We then extract crop seasonality metrics using the seasonal amplitude method from the phenolopy package.
The chart below shows the result of this process for a single crop pixel. The blue dots represent the raw EVI values, the black line represents the processed EVI values, and the dotted lines represent season parameters extracted for that pixel: start of season, peak of season, and end of season.
Based on the phenology process, we identified the seasonality to start in February and end in June with the peak being in March. This can vary with geographic region and crop type as well, however, that has not been taken into consideration in this version.
The following figure shows the median EVI in Syria from 2010 to 2025 during the crop growing season (February to June). The shaded area represents the interquartile range (IQR) of EVI values across all pixels, indicating the variability in vegetation health during this period.
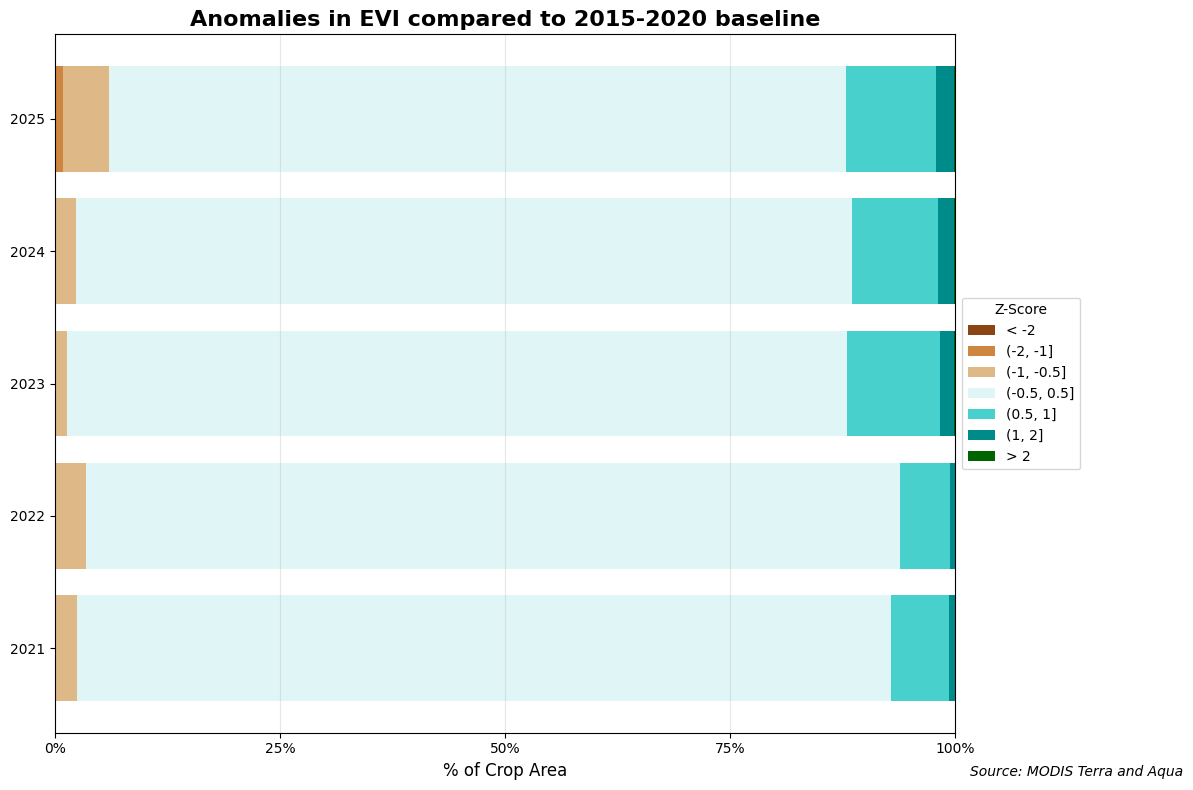
Anomaly#
Trends in EVI#
Admin level 1#
The figure below shows the trends of median EVI from 2010-2025 on admin level 1.
The figure below shows a choropleth maps of EVI for each admin level 1 from 2010-2025
The figure below shows the percent change of EVI compared to previous year from 2010-2025 on admin level 1.
Admin level 2#
The figure below shows a choropleth maps of EVI for each admin level 2 from 2010-2025
Admin level 3#
The figure below shows a choropleth maps of EVI for each admin level 3 from 2010-2025