Traffic Trends at Border Crossings#
We monitor trends in traffic along key border crossings in Syria. When vehicle count data captured along roads is not available, other data sources can be used to detect traffic and congestion—such as mobility data and satellite imagery. In this analysis, we test the use of three data sources for monitoring trends in traffic at three border crossings.
Data#
We test to the use of three data sources for monitoring trends in traffic at border crossings. We leverage three data sources as each data source comes with its own set of advantages and limitations. The three data sources are:
Very High Resolution Satellite Imagery: We use very high resolution (VHR) daytime satellite imagery from Orbital Insight. Orbital Insight has developed algorithms for detecting cars and trucks from satellite imagery that has less than 1 meter spatial resolution. From such high resolution images, cars and trucks can be easily detected using Orbital Insight’s algorithms. However, a key limitation of using VHR data for detecting trends in traffic is that VHR satellite images used by Orbital Insight are not captured at regular intervals. Consequently, the number of images available can vary across locations.
Medium Resolution Synthetic Aperture Radar Satellite Imagery: We use synthetic aperture radar (SAR) satellite imagery captured from Sentinel-1, which is available at a 10 meter resolution. SAR satellites transmit waves and measure the strength and orientation of waves reflected back to the satellite. Different objects scatter waves differently, and metallic objects such as vehicles produce a strong signal back to the sensor [Geudtner et al., 2014]. SpaceKnow has developed algorithms that use SAR data from Sentinel-1 to detect trends in congestion. Unlike VHR imagery, SAR data is not able to count the number of vehicles; however, Sentinel-1 captures SAR data at regular intervals (multiple times a month). SpaceKnow leverages SAR data to develop a traffic index, where larger values correspond to more congestion.
Mobility Data: We leverage mobility data from GPS-enabled devices to monitor the number of unique devices at border crossing locations. Mobility data comes from Outlogic, which is further described in Movement Trends. The number of unique devices observed at border crossing locations can indicate activity—and traffic—at the crossing. A key advantage of mobility data over satellite imagery is that it is available at all points in time; the dataset captures the timestamp and location of GPS-enable devices. Consequently, the data can be aggregated hourly, daily, or at other intervals. Mobility data may underestimate activity as not everyone may have a GPS-enabled device; however, we check whether trends in mobility data are similar to trends captured from satellite imagery.
For more information, please refer to datasets.
Implementation#
Code to analyze traffic across the three data sources is available here.
Data for the analysis can be accessed here.
Findings#
The below figure shows trends in the traffic indicators from the three sources. VHR images are captured at irregular intervals, so car and truck counts are available at limited points in time. However, comparing the VHR and mobility data emphasizes the downward bias in the mobility data. VHR data shows up to 250 vehicles captured at a single point in time for a border crossing, while mobility data from Outlogic only shows up to 12 unique devices captured during a day. Outlogic data may have too few observations at the border crossing locations to meaningfully observe trends. The traffic index from SAR imagery shows a notable increase in traffic at the Al Abbudiyah border crossing in 2022, a slight upward trend in traffic at the Al Aridah border crossing, and relatively consistent traffic at the Matraba border crossing.
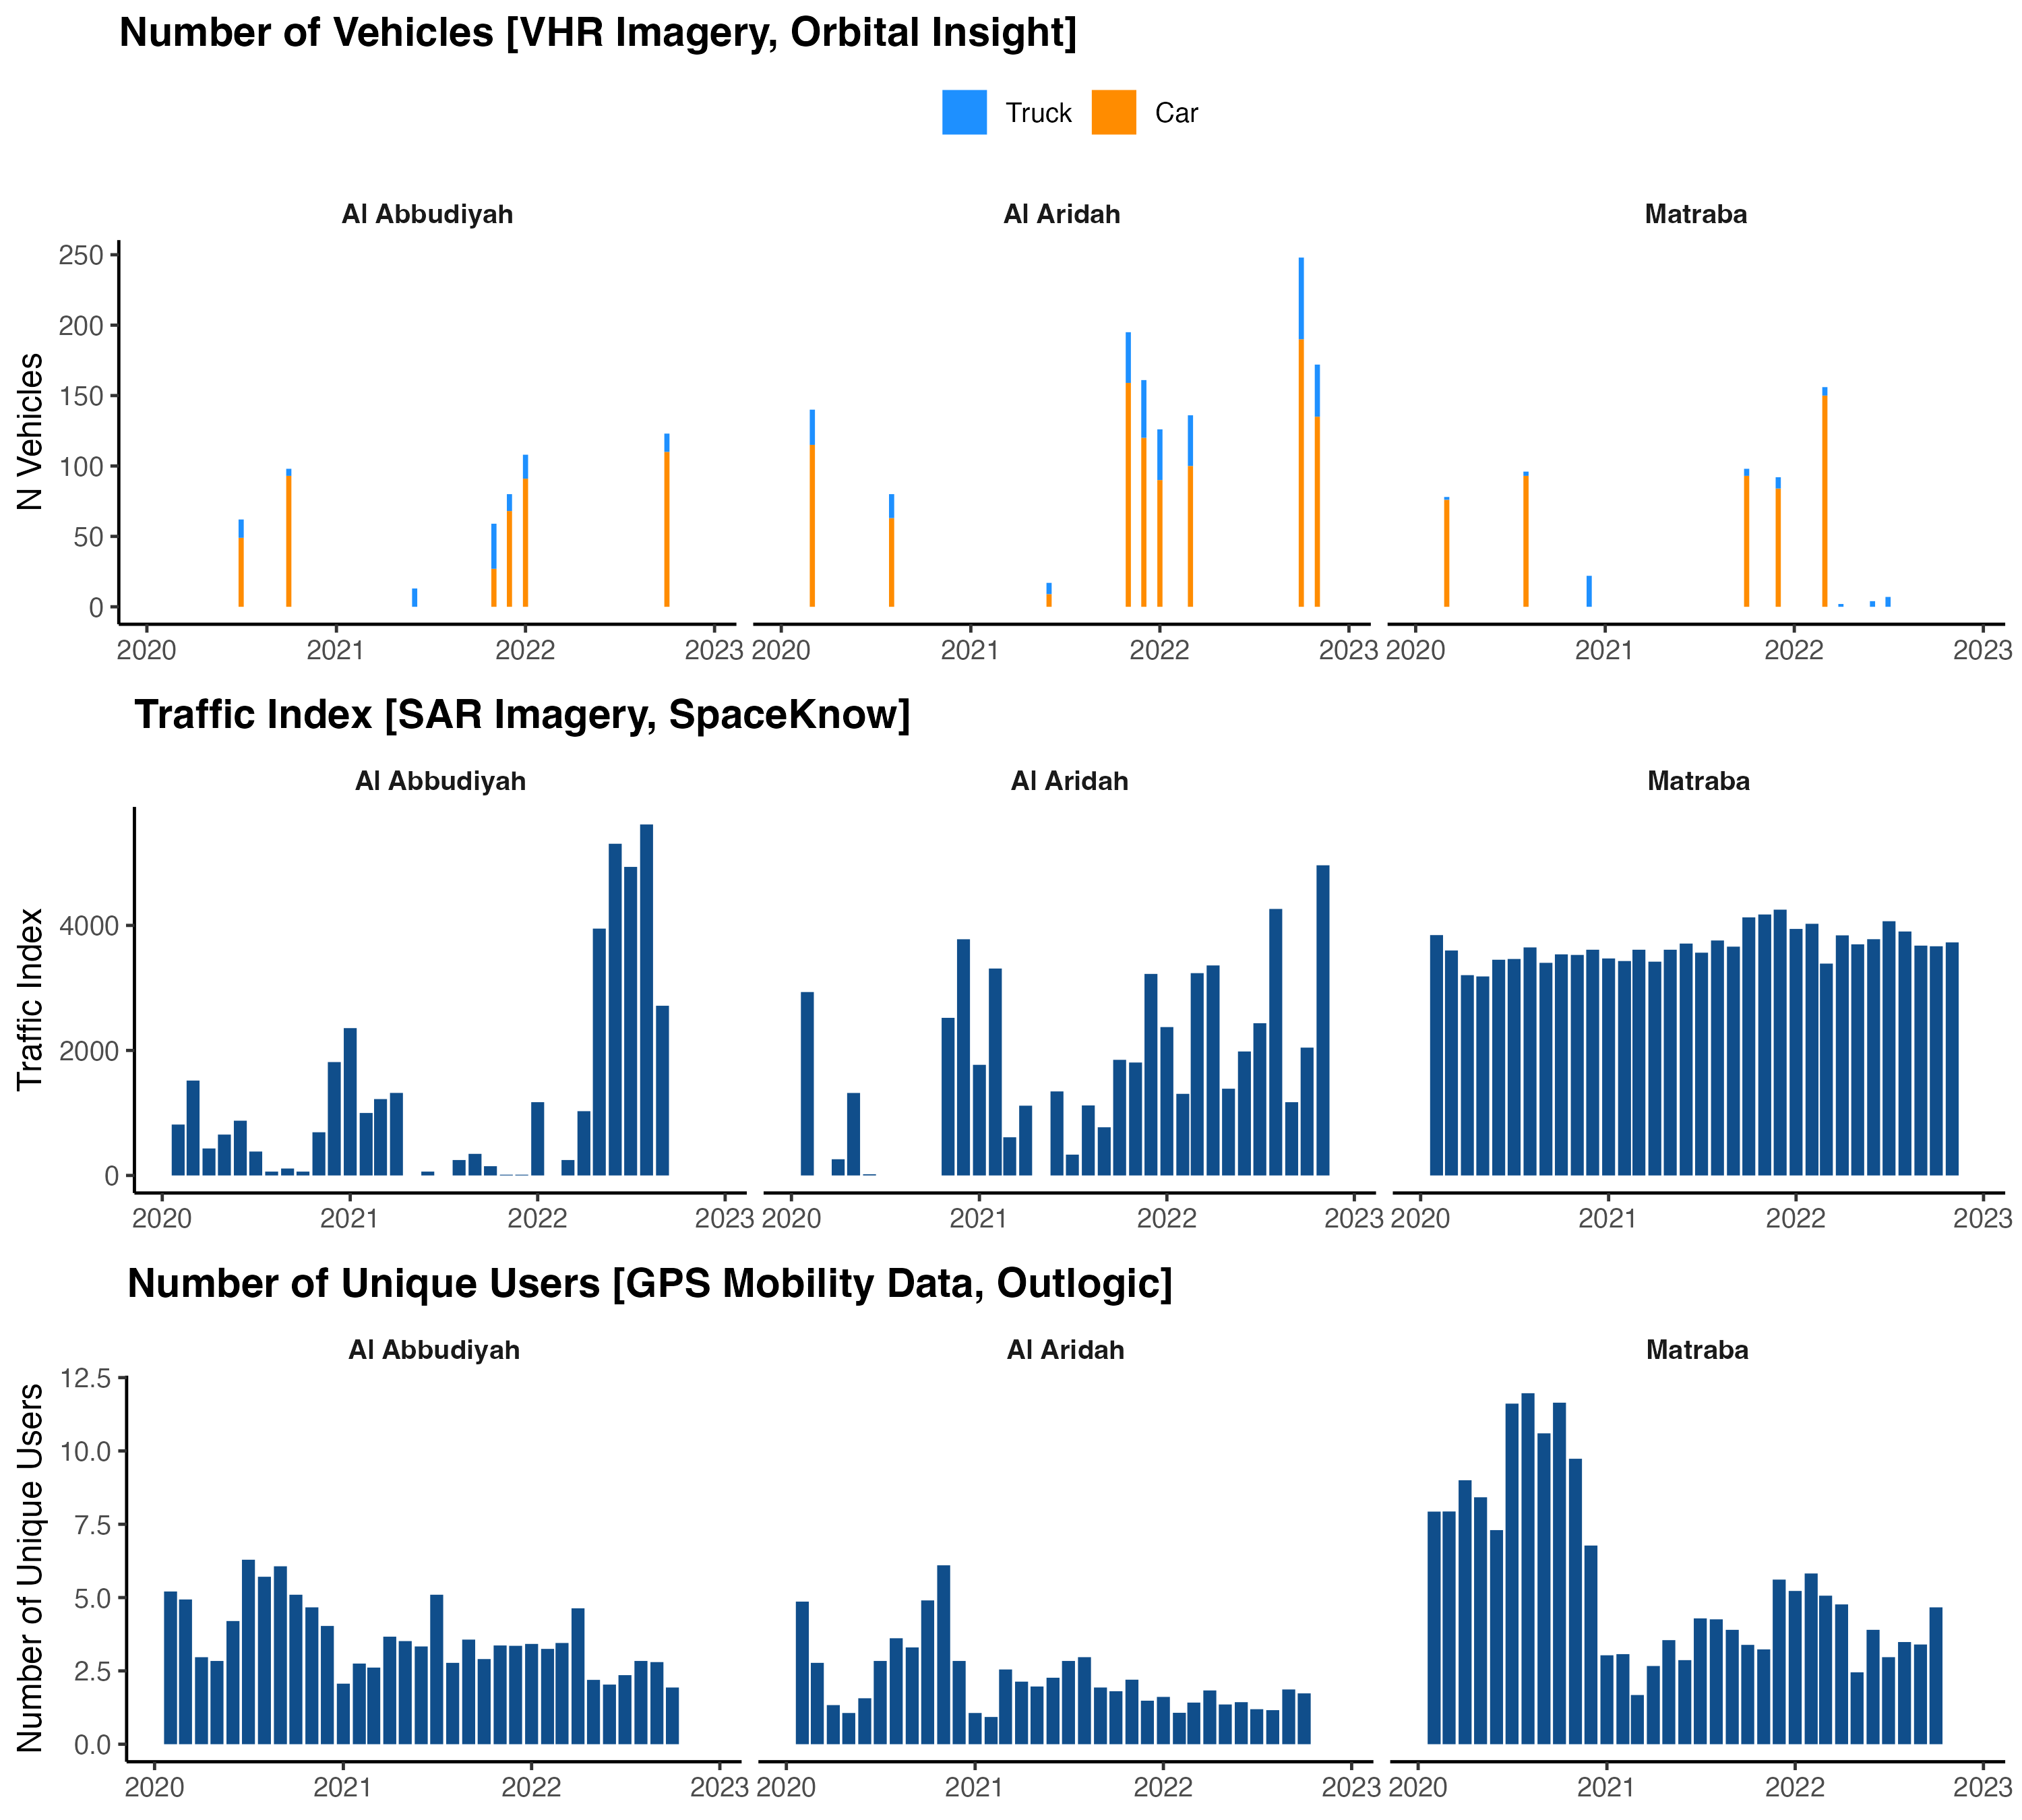
Fig. 20 Trends in Traffic using Different Data Sources. Data aggregated to the monthly level; when multiple observations are available within the month, we use the maximum.#
Next Steps#
Next steps can focus on piloting the data sources at additional border crossings. As the availability of VHR imagery can vary across locations, certain border crossings may have higher frequency VHR imagery where meaningful trends can be determined. As the WB Data Lab team has Outlogic data available across the country, trends could be examined across all border crossings to understand if some locations have higher volumes of mobility data. Ground-truth the data sources with traffic count data obtained at border crossings would also provide useful in understanding the usefulness and biases of the different data sources.
References#
- AKV21
Serkan Arslanalp, Robin Koepke, and Jasper Verschuur. Tracking trade from space: an application to pacific island countries. IMF Working Papers, 2021(225):A001, 2021. URL: https://www.elibrary.imf.org/view/journals/001/2021/225/article-A001-en.xml, doi:10.5089/9781513593531.001.A001.
- AJL17
George Azzari, Meha Jain, and David B. Lobell. Towards fine resolution global maps of crop yields: Testing multiple methods and satellites in three countries. Remote Sensing of Environment, 202:129–141, December 2017. doi:10.1016/j.rse.2017.04.014.
- BRVLJ10
I. Becker-Reshef, E. Vermote, M. Lindeman, and C. Justice. A generalized regression-based model for forecasting winter wheat yields in Kansas and Ukraine using MODIS data. Remote Sensing of Environment, 114(6):1312–1323, June 2010. doi:10.1016/j.rse.2010.01.010.
- BF13
Douglas K. Bolton and Mark A. Friedl. Forecasting crop yield using remotely sensed vegetation indices and crop phenology metrics. Agricultural and Forest Meteorology, 173:74–84, May 2013. doi:10.1016/j.agrformet.2013.01.007.
- CKomaromiLS20
Diego A. Cerdeiro, András Komáromi, Y. Liu, and Mamoon M. Saeed. World seaborne trade in real time: a proof of concept for building ais-based nowcasts from scratch. IMF Working Papers, 2020.
- DMCS03
Paul C. Doraiswamy, Sophie Moulin, Paul W. Cook, and Alan Stern. Crop Yield Assessment from Remote Sensing. Photogrammetric Engineering & Remote Sensing, 69(6):665–674, June 2003. doi:10.14358/PERS.69.6.665.
- GTS+14
Dirk Geudtner, Ramón Torres, Paul Snoeij, Malcolm Davidson, and Björn Rommen. Sentinel-1 system capabilities and applications. In 2014 IEEE Geoscience and Remote Sensing Symposium, volume, 1457–1460. 2014. doi:10.1109/IGARSS.2014.6946711.
- HT04
Ramaswamy Hariharan and Kentaro Toyama. Project Lachesis: Parsing and Modeling Location Histories. In Geographic Information Science. Volume 3234, volume 3234, 106–124. 2004. doi:10.1007/978-3-540-30231-5_8.
- HDM+02
A Huete, K Didan, T Miura, E.P Rodriguez, X Gao, and L.G Ferreira. Overview of the radiometric and biophysical performance of the MODIS vegetation indices. Remote Sensing of Environment, 83(1-2):195–213, November 2002. doi:10.1016/S0034-4257(02)00096-2.
- JA15
Hadi H. Jaafar and Farah A. Ahmad. Crop yield prediction from remotely sensed vegetation indices and primary productivity in arid and semi-arid lands. International Journal of Remote Sensing, 36(18):4570–4589, September 2015. doi:10.1080/01431161.2015.1084434.
- JPZ+22
Zhonglin Ji, Yaozhong Pan, Xiufang Zhu, Dujuan Zhang, and Jinyun Wang. A generalized model to predict large-scale crop yields integrating satellite-based vegetation index time series and phenology metrics. Ecological Indicators, 137:108759, April 2022. doi:10.1016/j.ecolind.2022.108759.
- JPS19
Haiying Jia, Vishnu Prakash, and Tristan Smith. Estimating vessel payloads in bulk shipping using ais data. International Journal of Shipping and Transport Logistics, 11:25, 01 2019. doi:10.1504/IJSTL.2019.096864.
- Joh16
David M. Johnson. A comprehensive assessment of the correlations between field crop yields and commonly used MODIS products. International Journal of Applied Earth Observation and Geoinformation, 52:65–81, October 2016. doi:10.1016/j.jag.2016.05.010.
- JLH+18
František Jurečka, Vojtěch Lukas, Petr Hlavinka, Daniela Semerádová, Zdeněk Žalud, and Miroslav Trnka. Estimating Crop Yields at the Field Level Using Landsat and MODIS Products. Acta Universitatis Agriculturae et Silviculturae Mendelianae Brunensis, 66(5):1141–1150, October 2018. doi:10.11118/actaun201866051141.
- KMC20
Kefyalew Sahle Kibret, Carsten Marohn, and Georg Cadisch. Use of MODIS EVI to map crop phenology, identify cropping systems, detect land use change and drought risk in Ethiopia – an application of Google Earth Engine. European Journal of Remote Sensing, 53(1):176–191, January 2020. doi:10.1080/22797254.2020.1786466.
- Kun14
Robin Kunaka, Charles; Carruthers. Trade and Transport Corridor Management Toolkit. World Bank Training, World Bank, 2014. License: CC BY 3.0 IGO. URL: http://hdl.handle.net/10986/18241.
- Pet18
Lillian Kay Petersen. Real-Time Prediction of Crop Yields From MODIS Relative Vegetation Health: A Continent-Wide Analysis of Africa. Remote Sensing, 10(11):1726, November 2018. Number: 11 Publisher: Multidisciplinary Digital Publishing Institute. doi:10.3390/rs10111726.
- PAK+22
Hoa Thi Pham, Joseph Awange, Michael Kuhn, Binh Van Nguyen, and Luyen K. Bui. Enhancing Crop Yield Prediction Utilizing Machine Learning on Satellite-Based Vegetation Health Indices. Sensors, 22(3):719, January 2022. doi:10.3390/s22030719.
- RRK+09
Atiqur Rahman, Leonid Roytman, Nir Y. Krakauer, Mohammad Nizamuddin, and Mitch Goldberg. Use of Vegetation Health Data for Estimation of Aus Rice Yield in Bangladesh. Sensors, 9(4):2968–2975, April 2009. doi:10.3390/s90402968.
- SH15
Jingjing Shi and Jingfeng Huang. Monitoring Spatio-Temporal Distribution of Rice Planting Area in the Yangtze River Delta Region Using MODIS Images. Remote Sensing, 7(7):8883–8905, July 2015. doi:10.3390/rs70708883.
- SCC+13
N. T. Son, C. F. Chen, C. R. Chen, L. Y. Chang, H. N. Duc, and L. D. Nguyen. Prediction of rice crop yield using MODIS EVI−LAI data in the Mekong Delta, Vietnam. International Journal of Remote Sensing, 34(20):7275–7292, October 2013. doi:10.1080/01431161.2013.818258.
- TMA+23
Gizachew Ayalew Tiruneh, Derege Tsegaye Meshesha, Enyew Adgo, Atsushi Tsunekawa, Nigussie Haregeweyn, Ayele Almaw Fenta, Tiringo Yilak Alemayehu, Temesgen Mulualem, Genetu Fekadu, Simeneh Demissie, and José Miguel Reichert. Mapping crop yield spatial variability using Sentinel-2 vegetation indices in Ethiopia. Arabian Journal of Geosciences, 16(11):631, November 2023. doi:10.1007/s12517-023-11754-x.
- VKH21a
Jasper Verschuur, Elco E Koks, and Jim W Hall. Global economic impacts of COVID-19 lockdown measures stand out in high-frequency shipping data. PLoS One, 16(4):e0248818, April 2021.
- VKH21b
Jasper Verschuur, Elco E. Koks, and Jim W. Hall. Observed impacts of the covid-19 pandemic on global trade. Nature Human Behaviour, 5(3):305–307, Mar 2021. URL: https://doi.org/10.1038/s41562-021-01060-5, doi:10.1038/s41562-021-01060-5.
- WDS15
J. S. J. Wijesingha, N. L. Deshapriya, and L. Samarakoon. Rice Crop Monitoring and Yield Assessment with MODIS 250m Gridded Vegetation Products: A Case Study of Sa Kaeo Province, Thailand. The International Archives of the Photogrammetry, Remote Sensing and Spatial Information Sciences, XL-7/W3:121–127, April 2015. doi:10.5194/isprsarchives-XL-7-W3-121-2015.
- WZZ+23
Bingfang Wu, Miao Zhang, Hongwei Zeng, Fuyou Tian, Andries B Potgieter, Xingli Qin, Nana Yan, Sheng Chang, Yan Zhao, Qinghan Dong, Vijendra Boken, Dmitry Plotnikov, Huadong Guo, Fangming Wu, Hang Zhao, Bart Deronde, Laurent Tits, and Evgeny Loupian. Challenges and opportunities in remote sensing-based crop monitoring: a review. National Science Review, 10(4):nwac290, March 2023. doi:10.1093/nsr/nwac290.
- WorldBank21
World Bank. World Development Report 2021 : Data for Better Lives. World Bank, 2021. License: CC BY 3.0 IGO. URL: http://hdl.handle.net/10986/35218.
- WorldBank22
World Bank. Syria Economic Monitor - Spring 2022 : Lost Generation of Syrians. Economic Updates and Modeling, World Bank, 2022. License: CC BY 3.0 IGO. URL: http://hdl.handle.net/10986/37617.