Generate Areas of Interest and Tessellation#
In this step, we generate the areas of interest (AOIs) and tessellation layers for this pilot study. The source data is available upon request on the project’s folder and is classified as “Official Use Only”.
# Parameters
# https://papermill.readthedocs.io/en/latest/usage-parameterize.html
RADIUS = 2000 # meters
RESOLUTION = 10
Areas of Interest#
In this step, as described in the methodological notes, we generate Region A and Region B. The regions are defined as areas around points of interest, e.g. border checkpoints.
Region A#
First, we define Region A as the region within RADIUS (meters) of CHECKPOINTS.
CHECKPOINTS = pd.read_csv("../../data/external/border_crossings_jordan.csv")
CHECKPOINTS = geopandas.GeoDataFrame(
CHECKPOINTS,
geometry=geopandas.points_from_xy(
CHECKPOINTS.longitude, CHECKPOINTS.latitude, crs="EPSG:4326"
),
)
CHECKPOINTS
| id | name | latitude | longitude | geometry | |
|---|---|---|---|---|---|
| 0 | 1 | Jdeidet Yabbous (Al- Masnaa) | 33.674157 | 35.964726 | POINT (35.96473 33.67416) |
| 1 | 2 | Tartous (Al-Arida) | 34.634027 | 35.976433 | POINT (35.97643 34.63403) |
| 2 | 3 | Al-Dabbousieh (Al- Abboudiyeh) | 34.638938 | 36.119218 | POINT (36.11922 34.63894) |
| 3 | 4 | Tel Kalakh (Al-Buqayaa) | 34.668012 | 36.303241 | POINT (36.30324 34.66801) |
| 4 | 5 | Joussieh (Al-Qaa) | 34.421778 | 36.543310 | POINT (36.54331 34.42178) |
| 5 | 6 | Matraba | 34.663613 | 36.349282 | POINT (36.34928 34.66361) |
CHECKPOINTS.explore()
Create buffer centered at CHECKPOINTS#
Further in this analysis, we will identify unique devices detected in the proximity of the points of interest (e.g., border checkpoints). Thus, we create areas of interest centered at the checkpoints, using the auxiliary buffer centered at the coordinates.
# proj EPSG:3857 (meters)
CHECKPOINTS["geometry"] = CHECKPOINTS.to_crs("EPSG:3857").buffer(RADIUS)
# proj lat/lon
CHECKPOINTS = CHECKPOINTS.to_crs("EPSG:4326")
Region A: Generate Tessellation (H3)#
As for the tessellation, we use H3 resolution 10 toTo expediate the computation of spatial joins.
_, HEXID_A = get_h3_tessellation(CHECKPOINTS, name="name")
Let’s visualize and inspect now,
geometry = [Polygon(h3.h3_to_geo_boundary(idx, True)) for idx in HEXID_A]
A = geopandas.GeoDataFrame(
HEXID_A, geometry=geometry, columns=["hex_id"], crs="EPSG:4326"
)
A.explore()
Region B#
In this step, we generate Region B defined as a border buffer strip between Lebanon and Syria, using boundaries provided by geoBoundaries.
LBN = geopandas.read_file(
"../../data/external/geoBoundaries/geoBoundaries-LBN-ADM0-all/geoBoundaries-LBN-ADM0_simplified.shp"
)
SYR = geopandas.read_file(
"../../data/external/geoBoundaries/geoBoundaries-SYR-ADM0-all/geoBoundaries-SYR-ADM0_simplified.shp"
)
Now, we create a boundary buffer.
# convert to meters
LBN = LBN.to_crs("EPSG:32634")
SYR = SYR.to_crs("EPSG:32634")
# create a 500m buffer
LBN = geopandas.GeoDataFrame(LBN, geometry=LBN.boundary.buffer(250))
SYR = geopandas.GeoDataFrame(SYR, geometry=SYR.boundary.buffer(250))
BORDER = geopandas.overlay(SYR, LBN).to_crs("EPSG:4326")
BORDER.explore()
Region B: Generate Tessellation (H3)#
_, HEXID_BORDER = get_h3_tessellation(BORDER, name="shapeName_1")
Next, we remove the difference,
HEXID_B = HEXID_BORDER.difference(HEXID_A)
geometry = [Polygon(h3.h3_to_geo_boundary(idx, True)) for idx in HEXID_B]
B = geopandas.GeoDataFrame(
pd.DataFrame(HEXID_B, columns=["hex_id"]), geometry=geometry, crs="EPSG:4326"
)
B.explore()
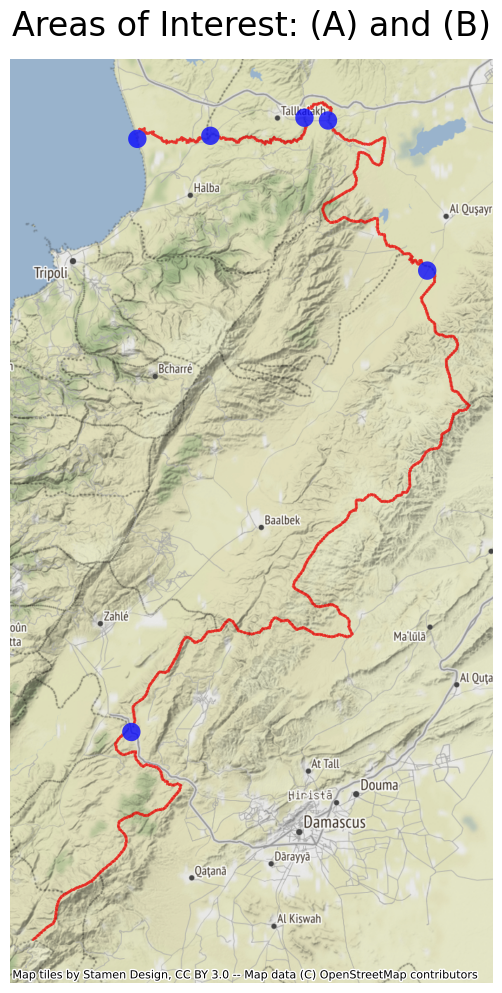
Regions A & B#
Finally, see visualize below Region A (blue) and Region B (red).
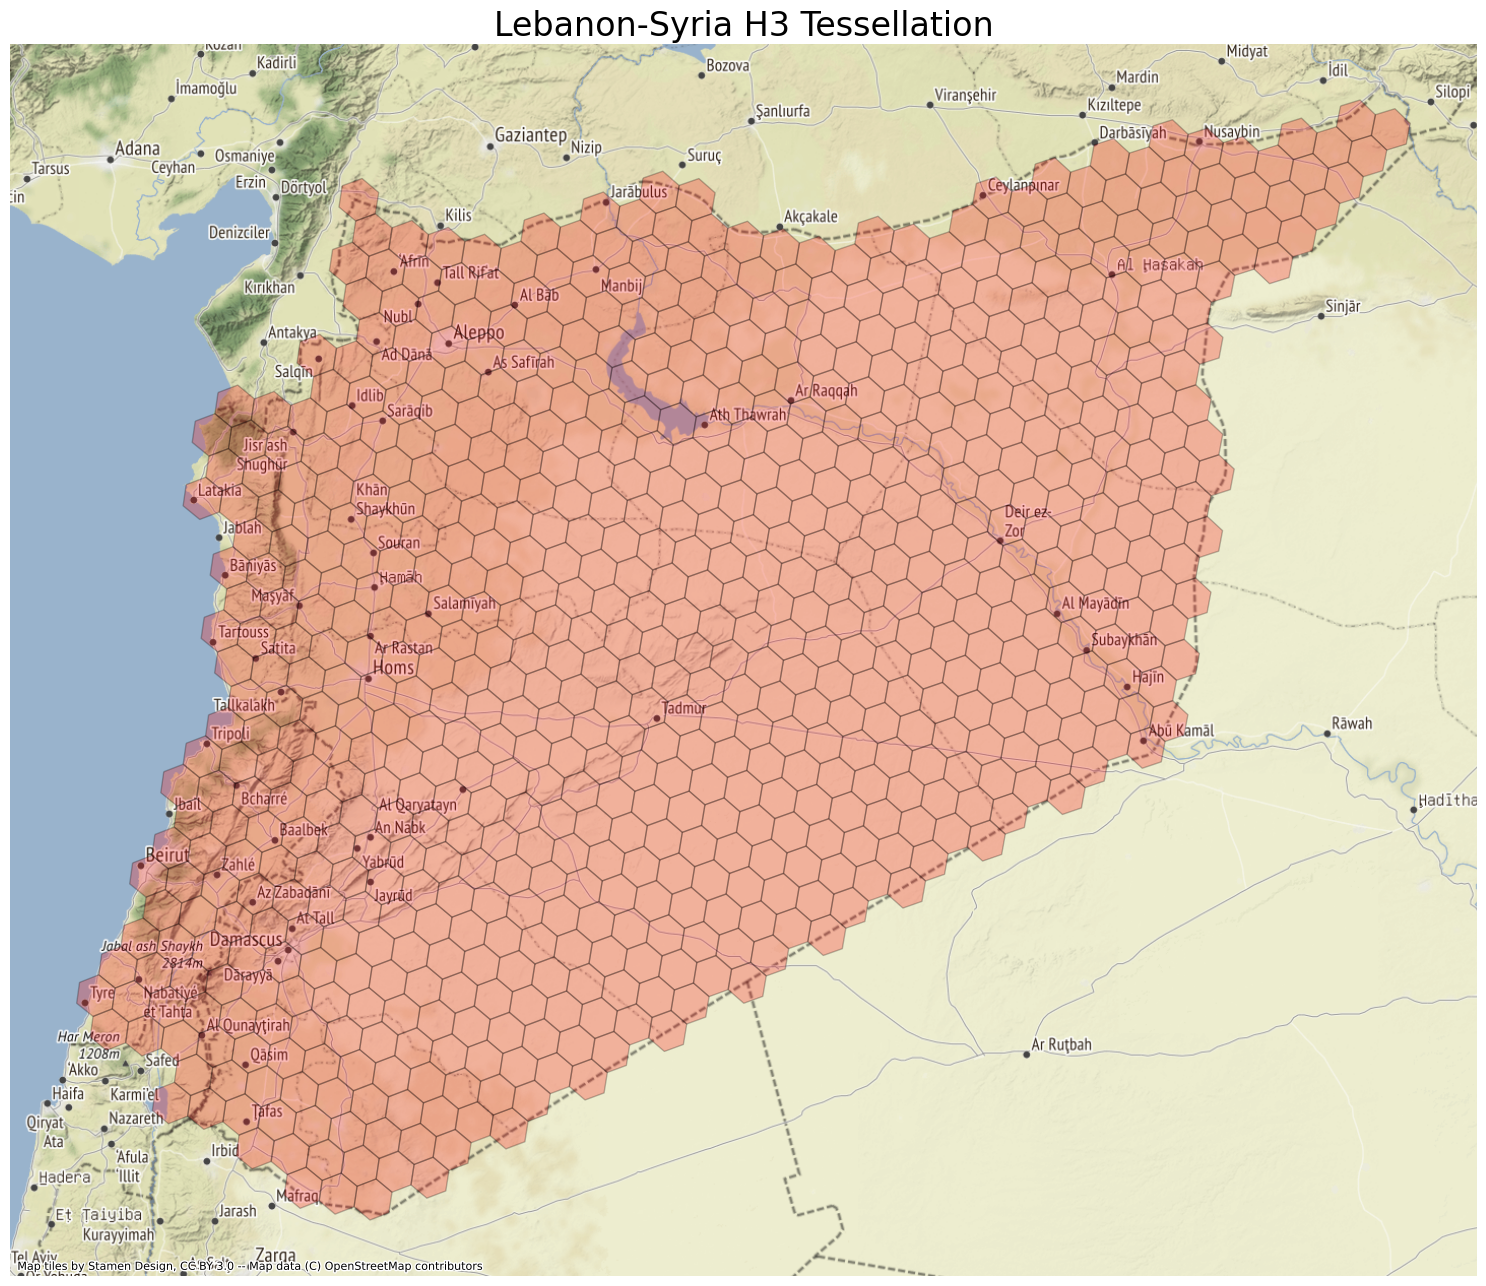
Tessellation#
In this step, we generate tessellation layers using the H3 hexagonal hierarchical geospatial indexing system.
LB-SY Tessellation#
LBN = geopandas.read_file(
"../../data/external/geoBoundaries/geoBoundaries-LBN-ADM1-all/geoBoundaries-LBN-ADM1_simplified.shp"
)
SYR = geopandas.read_file(
"../../data/external/geoBoundaries/geoBoundaries-SYR-ADM1-all/geoBoundaries-SYR-ADM1_simplified.shp"
)
AOI = pd.concat([LBN, SYR], ignore_index=True)
Exploding MultiPolygon to Polygon
AOI = AOI.explode()
/var/folders/9h/d730wcc12x58ffvkft3gs4sr0000gn/T/ipykernel_49173/3456624557.py:1: FutureWarning: Currently, index_parts defaults to True, but in the future, it will default to False to be consistent with Pandas. Use `index_parts=True` to keep the current behavior and True/False to silence the warning.
AOI = AOI.explode()
Removing irrelevant (non-convex) regions
a = AOI[AOI.index.isin([(1, 4)])]
b = AOI[AOI.index.isin([(15, 1)])]
AOI = AOI[AOI["shapeISO"] != "LB-AS"]
AOI = AOI[AOI["shapeISO"] != "SYR-TA"]
AOI = pd.concat([AOI, a, b])
AOI.explore()
Preparing tessellation for further steps and saving.
AOI["tile_ID"] = AOI["shapeISO"]
AOI.to_file("../../data/interim/tessellation/LNBSYR.geojson", driver="GeoJSON")
LB-SY Tessellation (H3)#
mapper, HEXID_SY = get_h3_tessellation(AOI, name="shapeISO", resolution=5)
TESSELLATION = geopandas.GeoDataFrame(
data=HEXID_SY,
geometry=[Polygon(h3.h3_to_geo_boundary(idx, True)) for idx in HEXID_SY],
columns=["tile_ID"],
crs="EPSG:4326",
)
Plotting with matplotlib,
fig, ax = plt.subplots(figsize=(20, 16))
TESSELLATION.to_crs(epsg=3857).plot(ax=ax, alpha=0.25, color="red", edgecolor="k")
ax.axis("off")
ax.set_title("Lebanon-Syria H3 Tessellation", fontsize=24)
cx.add_basemap(ax)