Humanitarian Assistance Survey#
Data#
We use data from the Humanitarian Situation Overview Survey (HSOS) conducted by REACH. REACH is a joint initiative of IMPACT Initiatives, ACTED and the United Nations Institute for Training and Research - Operational Satellite Applications Programme (UNITAR-UNOSAT). The HSOS is collected monthly in Northeast Syria (NES) and Northwest Syria (NWS). The survey uses key informant interviews to collect data at the community (admin4) level. The panel used for the analysis includes 1,426 communities (371 in NWS and 1246 in NES) which are included in all rounds of data collection.
The HSOS includes information on community situations and needs relating to shelter, electricity, water sanitation and hygiene (WASH), food security, livelihoods, health, education, humanitarian assistance, and priority needs. HSOS has disaggregated information on the different conditions and needs of residents and internally displaced persons (IDPs).
Methodology#
In the analysis, we look at trends in the data before and after the earthquake, and whether those trends differ depending on severity of exposure to the earthquake. We use data from December 2022 as the most recent data before the earthquake and April 2023 as the first dataset after the earthquake. Note that we do not include data from January 2023 as it was collected for NWS only, and we do not include data from February 2023 as it was collected during the time of the earthquake.
We compare outcomes for communities severely impacted by the earthquake before/after the earthquake compared to communities moderately affected or lightly affected. We additionally compare the trends observed before/after the earthquake to the trends for the same three subsets of communities over the same period of time one year earlier. Specifically, we measure trends from December 2022 to March/April 2023, and compare those to trends from December 2021 to March/April 2022.
The earthquake exposure measure uses the Modified Mercalli Intensity Scale (mmi). From this we derive three groups of communities: light earthquake intensity, moderate intensity, and strong or very strong intensity.
Implementation#
Code to replicate the analysis can be found here. The main script loads all packages and runs all scripts for the analysis. The script to produce the graphs can be found here. All data used in the analysis can be downloaded from Syria Humanitarian Situation Overview Survey.
Findings#
Humanitarian Assistance#
Communities strongly affected by the earthquake (in Northwest Syria) were more likely to receive humanitarian assistance than communities that were less affected (in Northeast Syria), both before and after the earthquake. Approximately 80% of the communities that were strongly affected by the earthquake were already receiving humanitarian assistance prior to the earthquake. As Figure 9 shows, by March 2023 access to humanitarian aid increased for the resident population but remained comparable to pre-earthquake levels for the internally displaced population (IDPs).
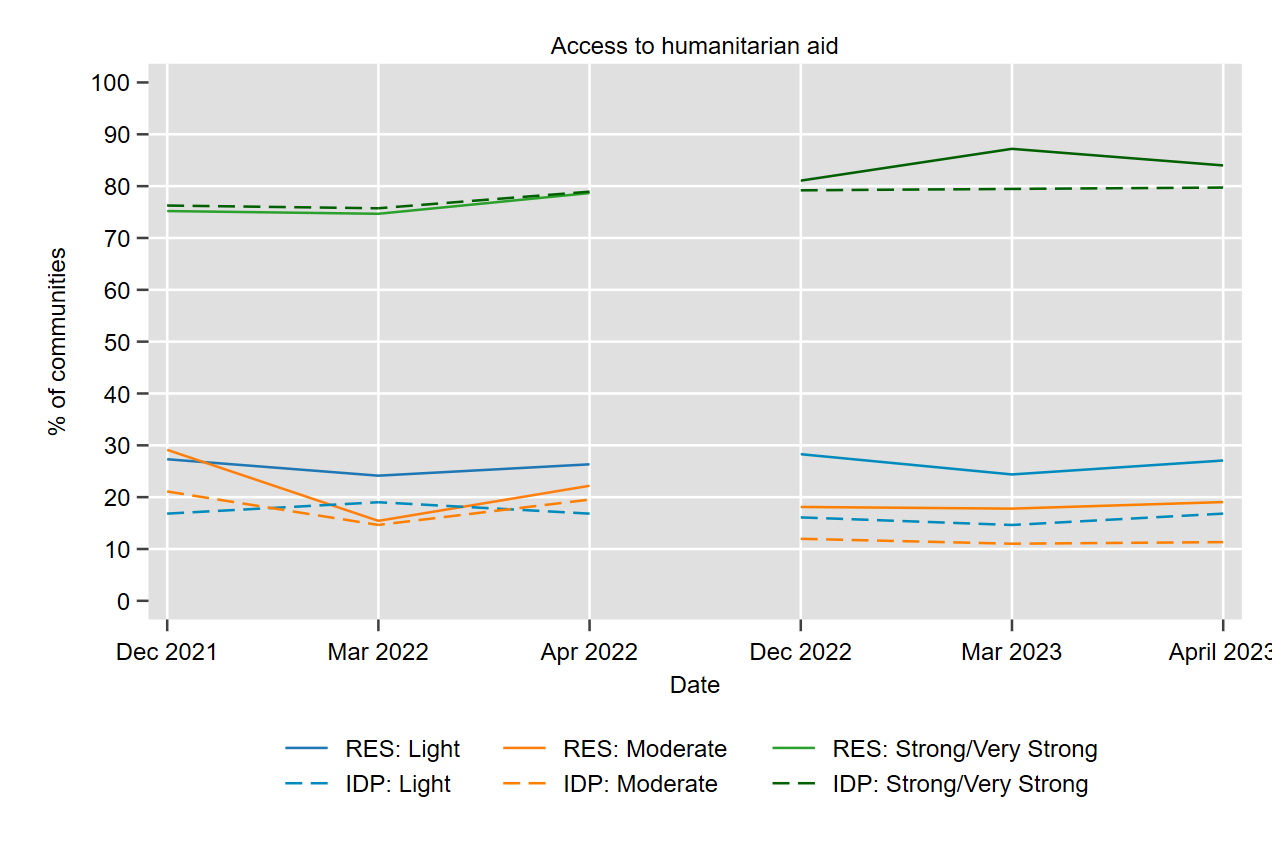
Fig. 1 Access to Humanitarian Aid#
The data suggests that increases for residents were short-lived; by April 2023 access to aid was comparable to pre-earthquake levels for both populations. There is a notable change in composition of aid post-earthquake: cash and food vouchers increase significantly immediately after the earthquake as shown in Figures 10 and 11. By April, cash assistance had returned to pre-earthquake level but provision of food vouchers remained higher than it was in the pre-earthquake period. For residents, these changes contribute to an overall increase in humanitarian assistance. For IDPs, increases in cash and food were offset by decreases in direct food aid and water and sanitation services.
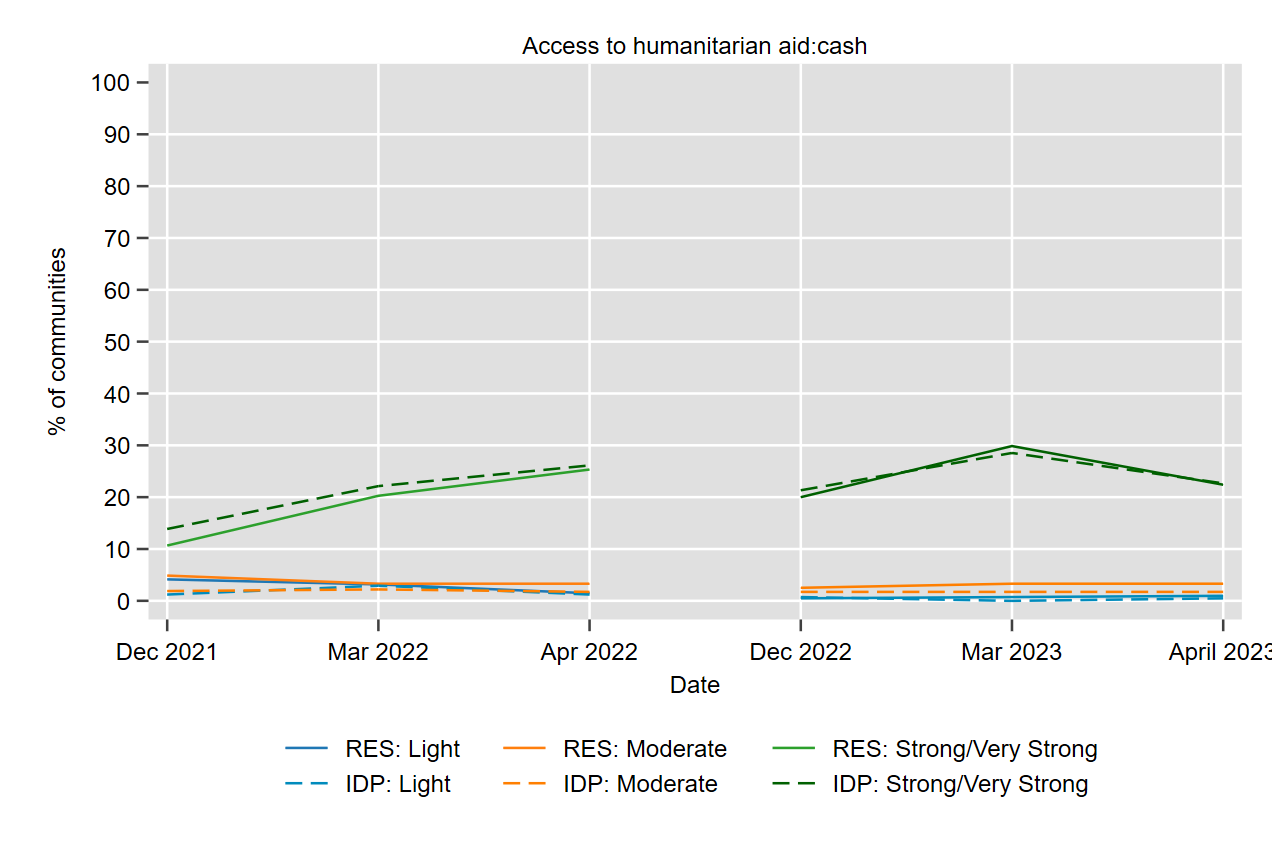
Fig. 2 Access to Humanitarian Aid - Cash#
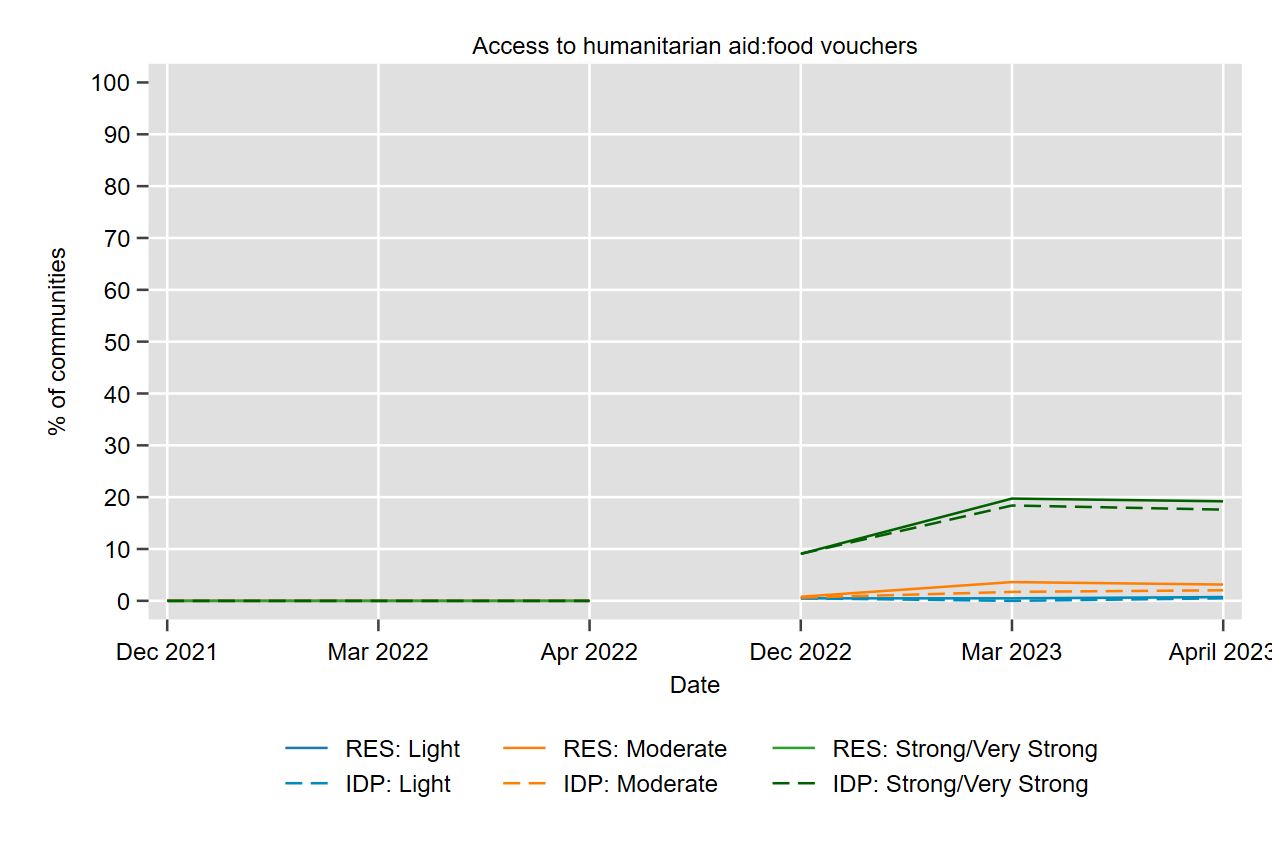
Fig. 3 Access to Humanitarian Aid - Voucher#
Access to Services#
Access to community electricity networks was substantially lower for communities in NWS strongly affected by the earthquake than communities that were less affected (in NES). Immediately after the earthquake, access to electricity increases substantially in the strongly affected communities but does not change in communities lightly or moderately affected, as shown in Figure 12. These new connections translate directly into improved access for households: in strongly affected communities, the proportion of communities reporting less than 8 hours of electricity per day drops from two-thirds (pre-earthquake) to less than half (post-earthquake). Access to food markets, health services and education is not noticeably affected by the earthquake. Communities strongly affected by the earthquake had more access to food markets and health services prior to the earthquake and there is no significant change in trend observed after the earthquake. Nearly all communities in the sample had access to education services prior to the earthquake and there is no noticeable effect of the earthquake.
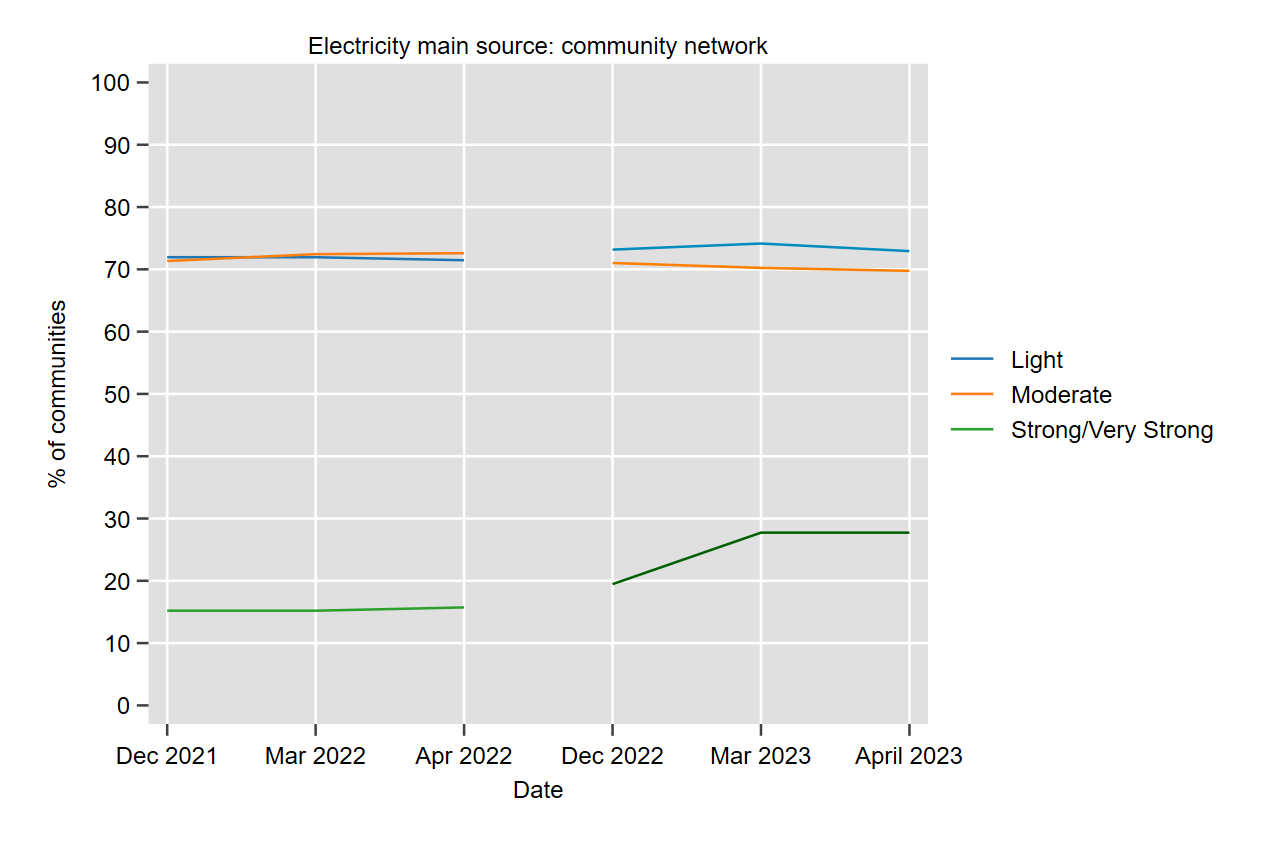
Fig. 4 Electricity Main Source - Community Network#
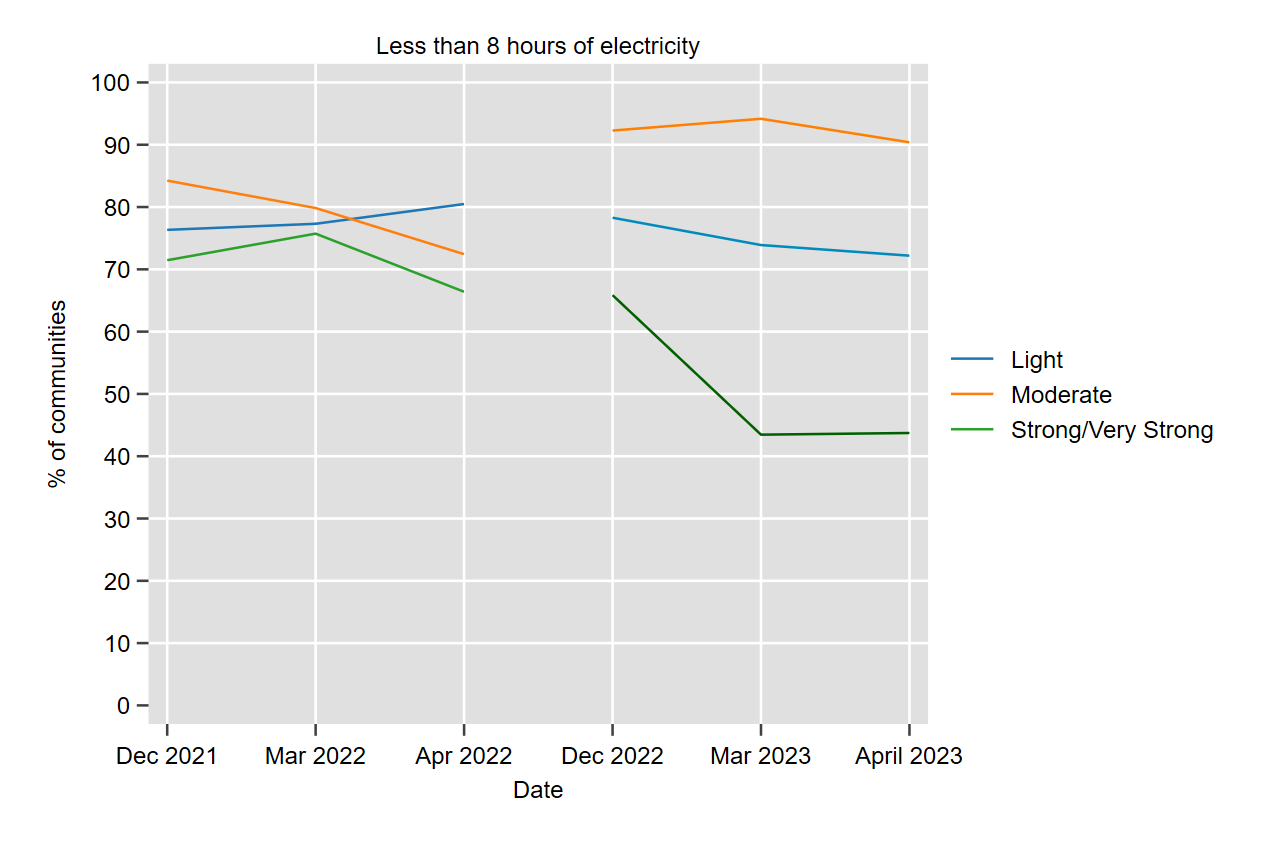
Fig. 5 Less than 8 hours of electricity#
Priority Needs & Coping Strategies#
In the post-earthquake period, the primary needs for the IDP population are food, shelter, and livelihood support. For residents, the top priority needs are food, livelihoods support and water and sanitation services. In communities strongly affected by the earthquake, food and shelter needs are particularly pronounced; these needs were already higher in the pre-earthquake period and the gap increases in the period after the earthquake, as shown in Figures 14 and 15. One-third of the strongly affected communities report that food is the top priority need for IDPs, compared to only about 1 in 10 of the less-affected communities. Residents in communities strongly affected by the earthquake also reported a significant increase in food needs directly after the earthquake. By April, residents’ demand for food had dropped, which is consistent with the significant increase in food aid observed in the same communities. Demand for shelter increased for residents and IDPs immediately after the earthquake; April data suggests that residents shelter needs are increasingly being met whereas shelter remains an important priority for IDPs.
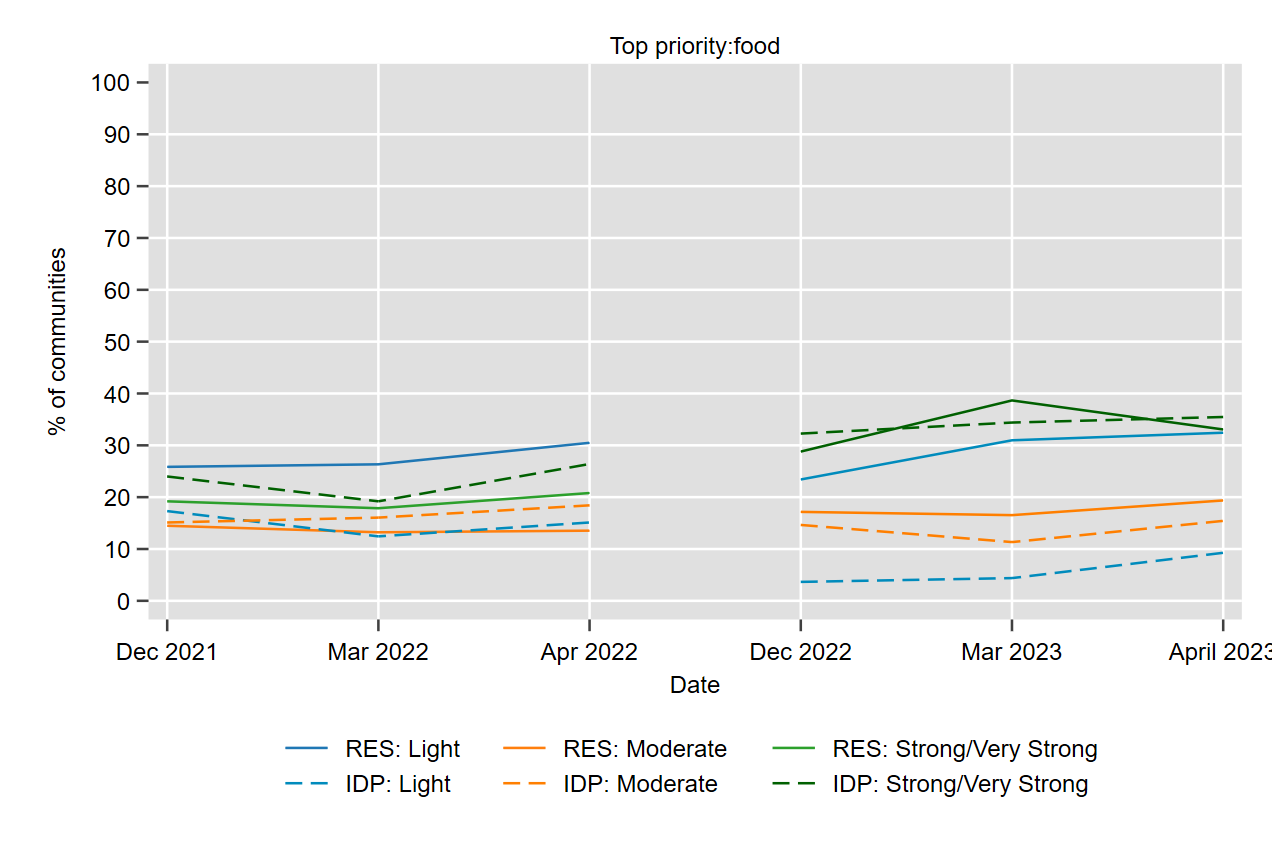
Fig. 6 Food as a primary need#
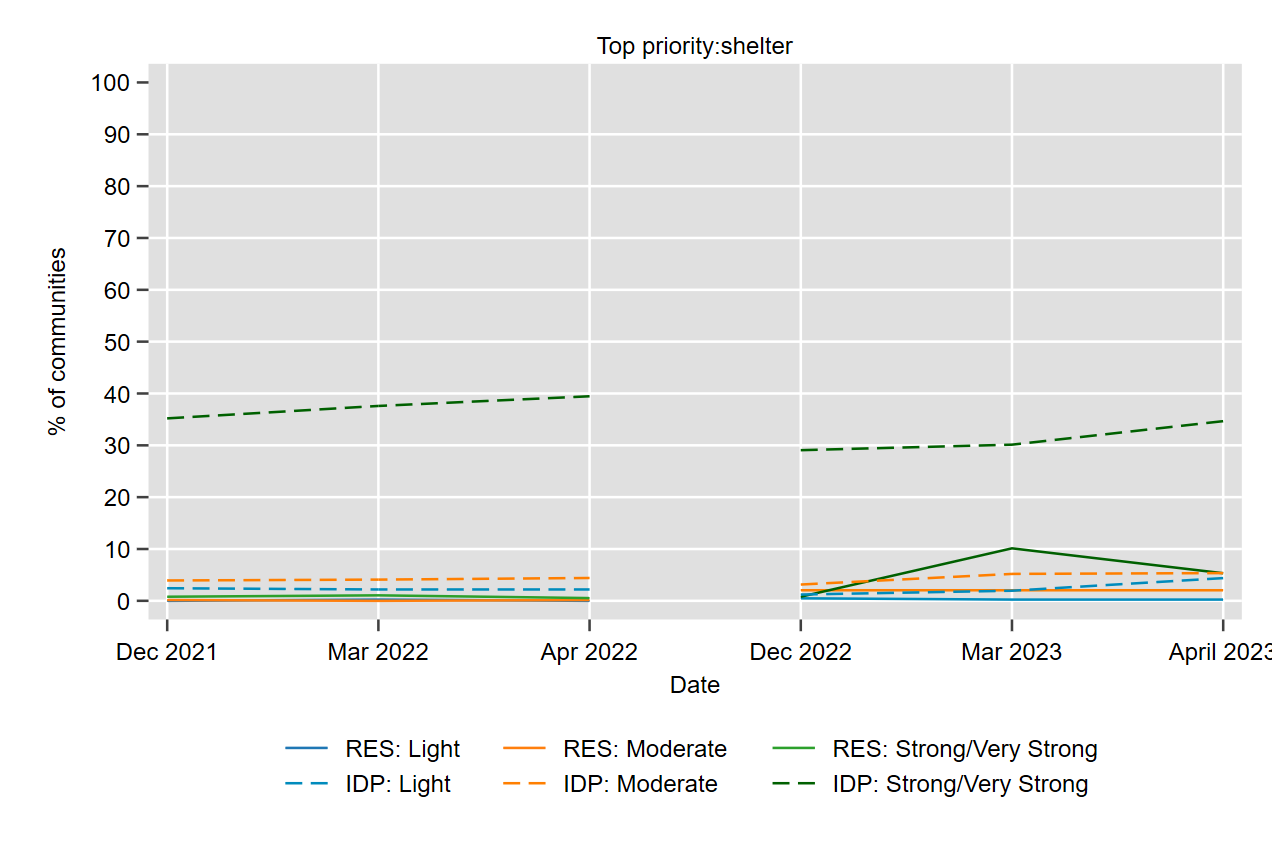
Fig. 7 Shelter as a primary need#
In terms of coping strategies, IDPs and residents both increases sales of household items and productive assets in communities strongly affected by the earthquake. Somewhat surprisingly, there are substantial decreases in reports of sending children to work or to early marriage for both residents and IDPs, possibly due to humanitarian interventions.
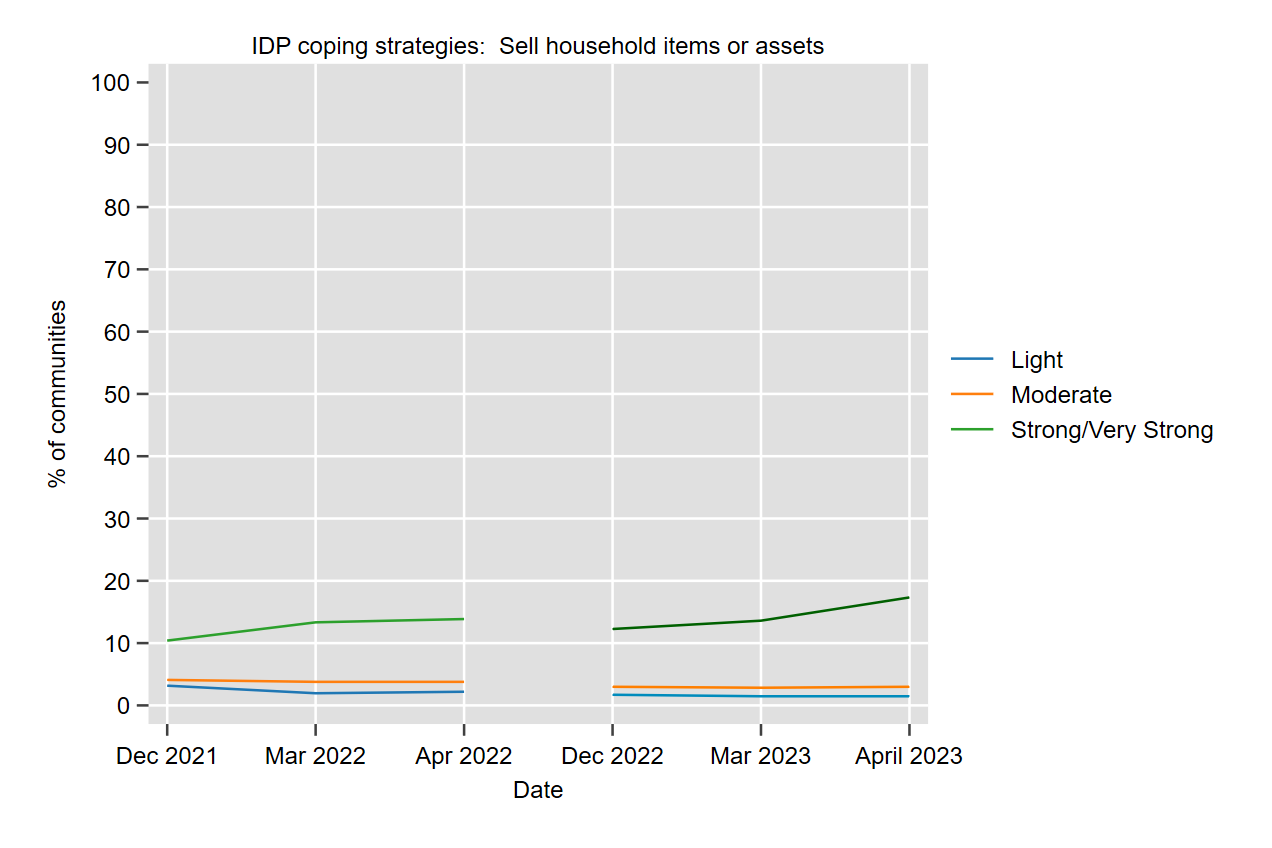
Fig. 8 Coping strategies - Selling household items or assets#
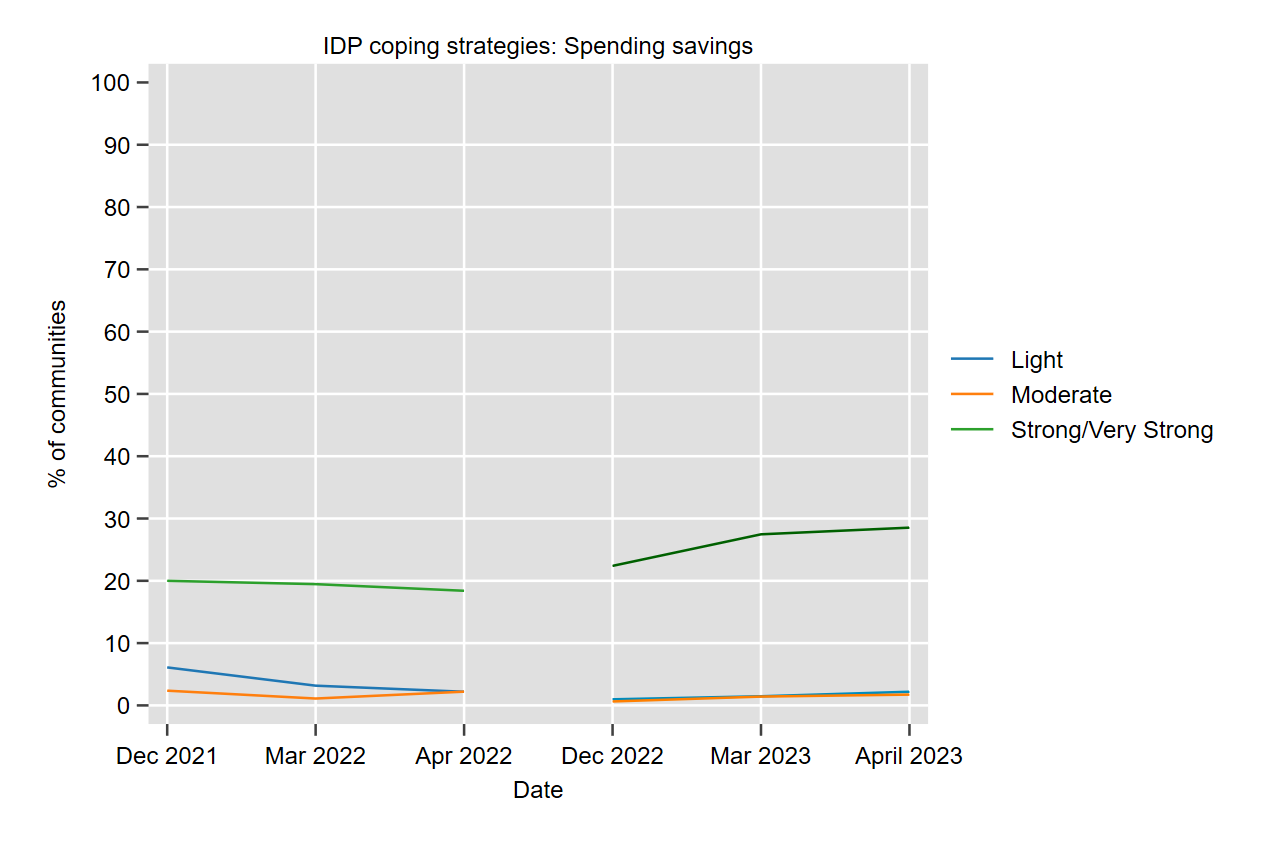
Fig. 9 Coping strategies - Spending savings#
Limitations#
The categorical definition of exposure to the earthquake: light, moderate, or strong intensity is highly geographically correlated within the HSOS sample. Of the 346 communities in NWS, 331 were affected strongly by the earthquake and the remaining 15 were affected moderately. In NES, in contrast, only 45 communities were strongly affected, 625 were moderately affected, and 410 were lightly affected. This is to say, nearly all strongly affected communities are in NWS and all lightly affected communities are in NES. NES and NWS differ in important observable and unobservable ways - such as the controlling regime, which limits the conclusions that can be drawn from the data.
Next Steps#
Given the limited variation in the measure of earthquake intensity, the first next step will be to explore distance from the epicenter as a more continuous measure which may be less correlated with other underlying conditions (such as soil characteristics). If we are able to establish parallel trends prior to the earthquake, a difference-in-difference strategy would be appropriate. Longer-term, a larger survey sample, ideally nationally-representative would all for more robust analysis.