Crop Productivity and Time Series Analytics#
Overview#
This notebook is designed to analyze and monitor agricultural productivity trends in Syria using remote sensing data, specifically focusing on vegetation health and precipitation patterns. The analysis incorporates Enhanced Vegetation Index (EVI) data and climatic factors like precipitation from trusted datasets such as MODIS and CHIRPS.
Analyzing Vegetation Trends: Utilizing EVI anomalies to understand deviations from historical norms over the last five years and their implications on agricultural productivity.
Conflict and Agriculture Dynamics: Exploring correlations between vegetation anomalies and conflict events to assess the impact of socio-political factors on agriculture.
Precipitation Analysis: Evaluating annual median precipitation trends and their relationship with observed vegetation health.
Data Integration: Combining spatial and temporal datasets for comprehensive insights at administrative levels (e.g., governorate or region).
Visualization and Reporting: Generating informative plots and maps to visualize trends in vegetation health, precipitation, and their overlaps with conflict events.
Cropland area statistics#
| Region | Crop Area ha. | Crop Area Share (% of Country) | Crop Area Share (% of Region) | |
|---|---|---|---|---|
| 0 | Al-Hasakeh | 1,873,816 | 30.69% | 64.89% |
| 1 | Aleppo | 1,222,789 | 20.03% | 49.49% |
| 2 | Ar-Raqqa | 706,843 | 11.58% | 32.37% |
| 3 | Hama | 495,341 | 8.11% | 36.39% |
| 4 | Idleb | 370,121 | 6.06% | 55.31% |
| 5 | Homs | 318,995 | 5.23% | 6.07% |
| 6 | Deir-ez-Zor | 316,665 | 5.19% | 10.27% |
| 7 | Dar'a | 316,359 | 5.18% | 69.13% |
| 8 | As-Sweida | 198,094 | 3.24% | 26.13% |
| 9 | Rural Damascus | 164,694 | 2.70% | 5.22% |
| 10 | Quneitra | 95,210 | 1.56% | 46.33% |
| 11 | Tartous | 15,455 | 0.25% | 6.74% |
| 12 | Lattakia | 9,392 | 0.15% | 3.19% |
| 13 | Damascus | 878 | 0.01% | 6.26% |
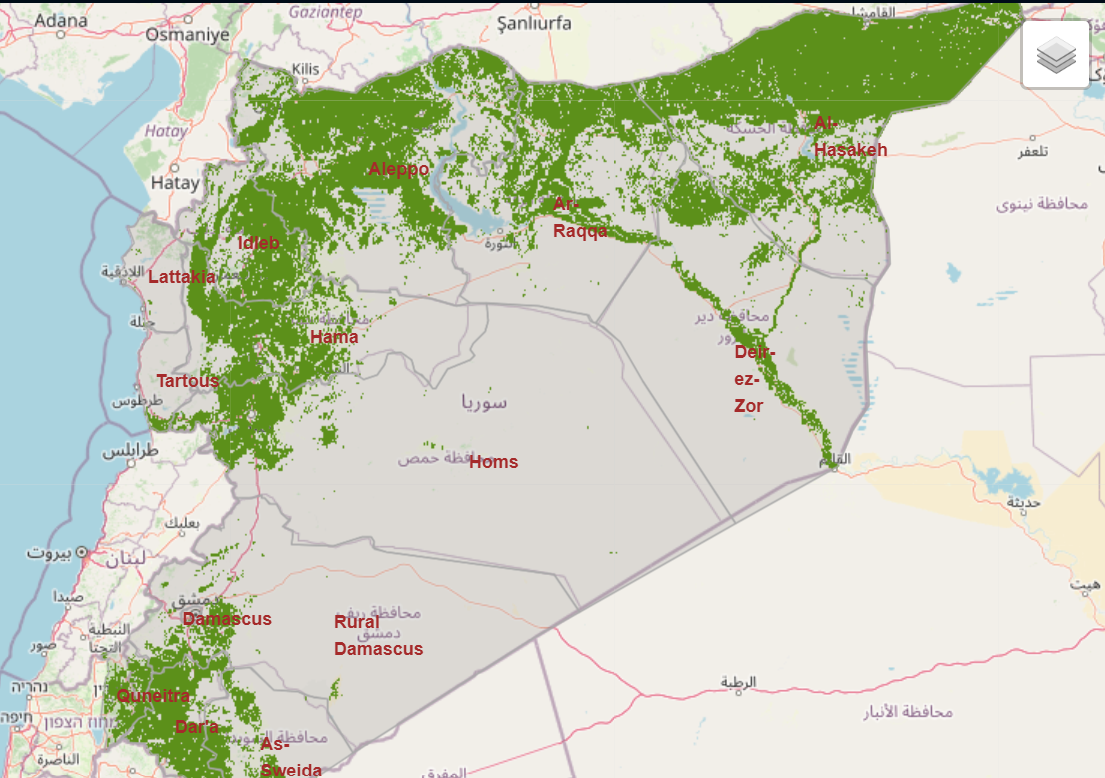
cropland extent [ESA WorldCover Cropmask]#
EVI Difference Maps#
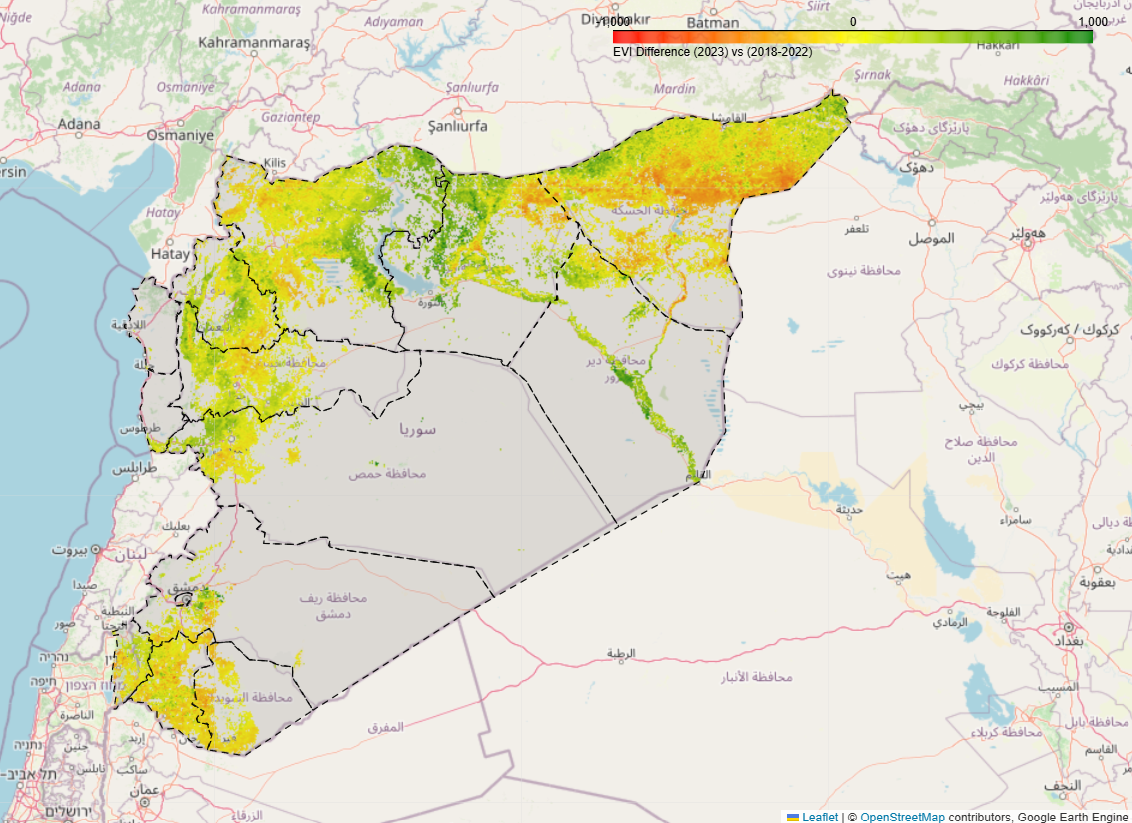
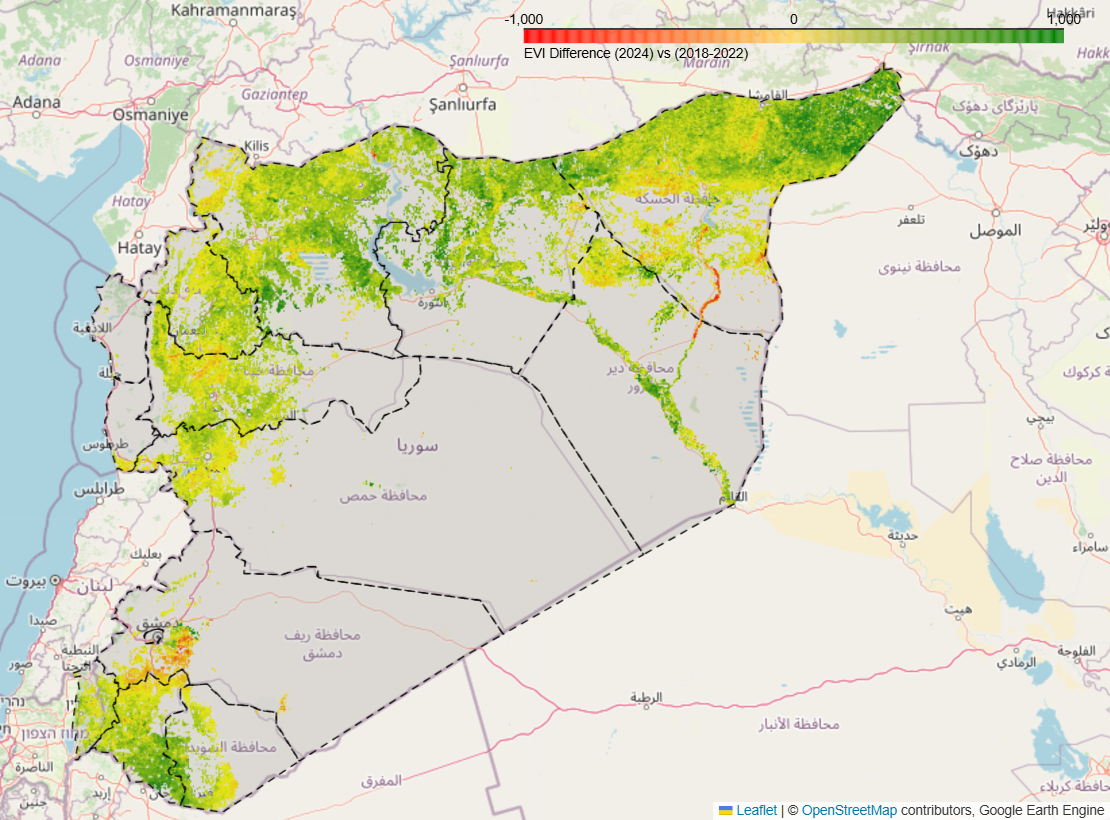
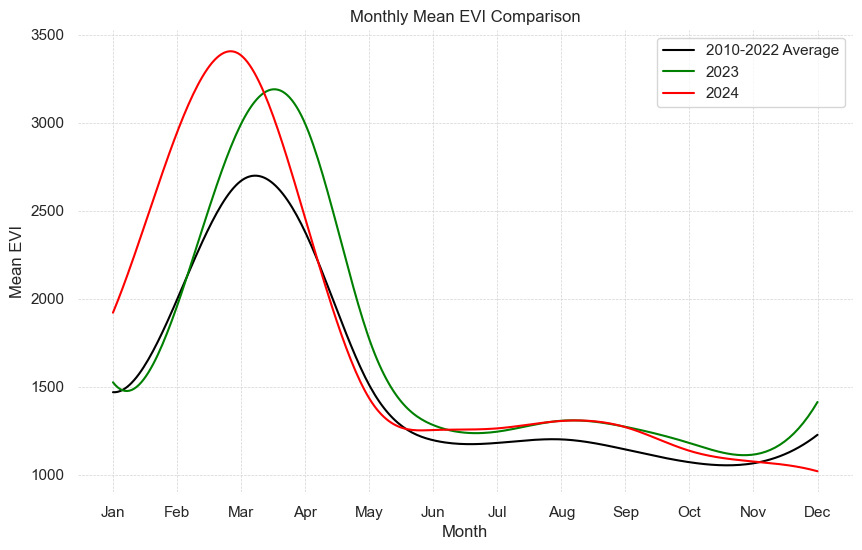
2023 and 2024 with past 5 years reference
While the EVI data throughout the year is considered for 2023 map, for 2024, EVI data for only the first 8 months across 2018 to 2022 is considered.
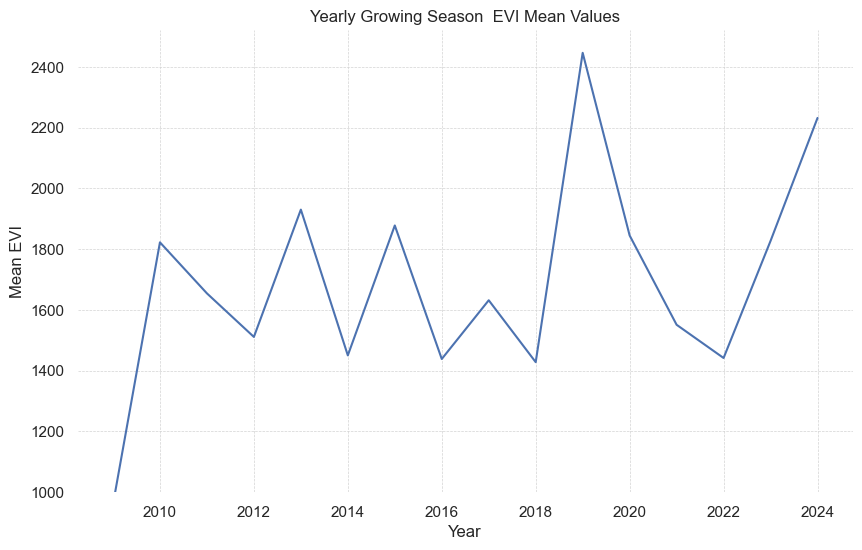
Yearly Trends in EVI#
Anomalies#
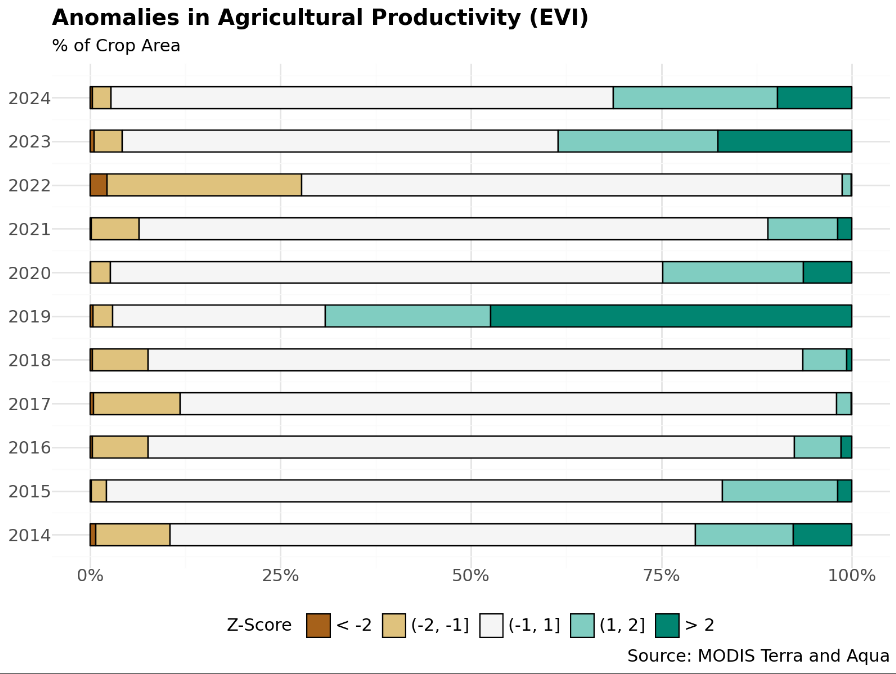
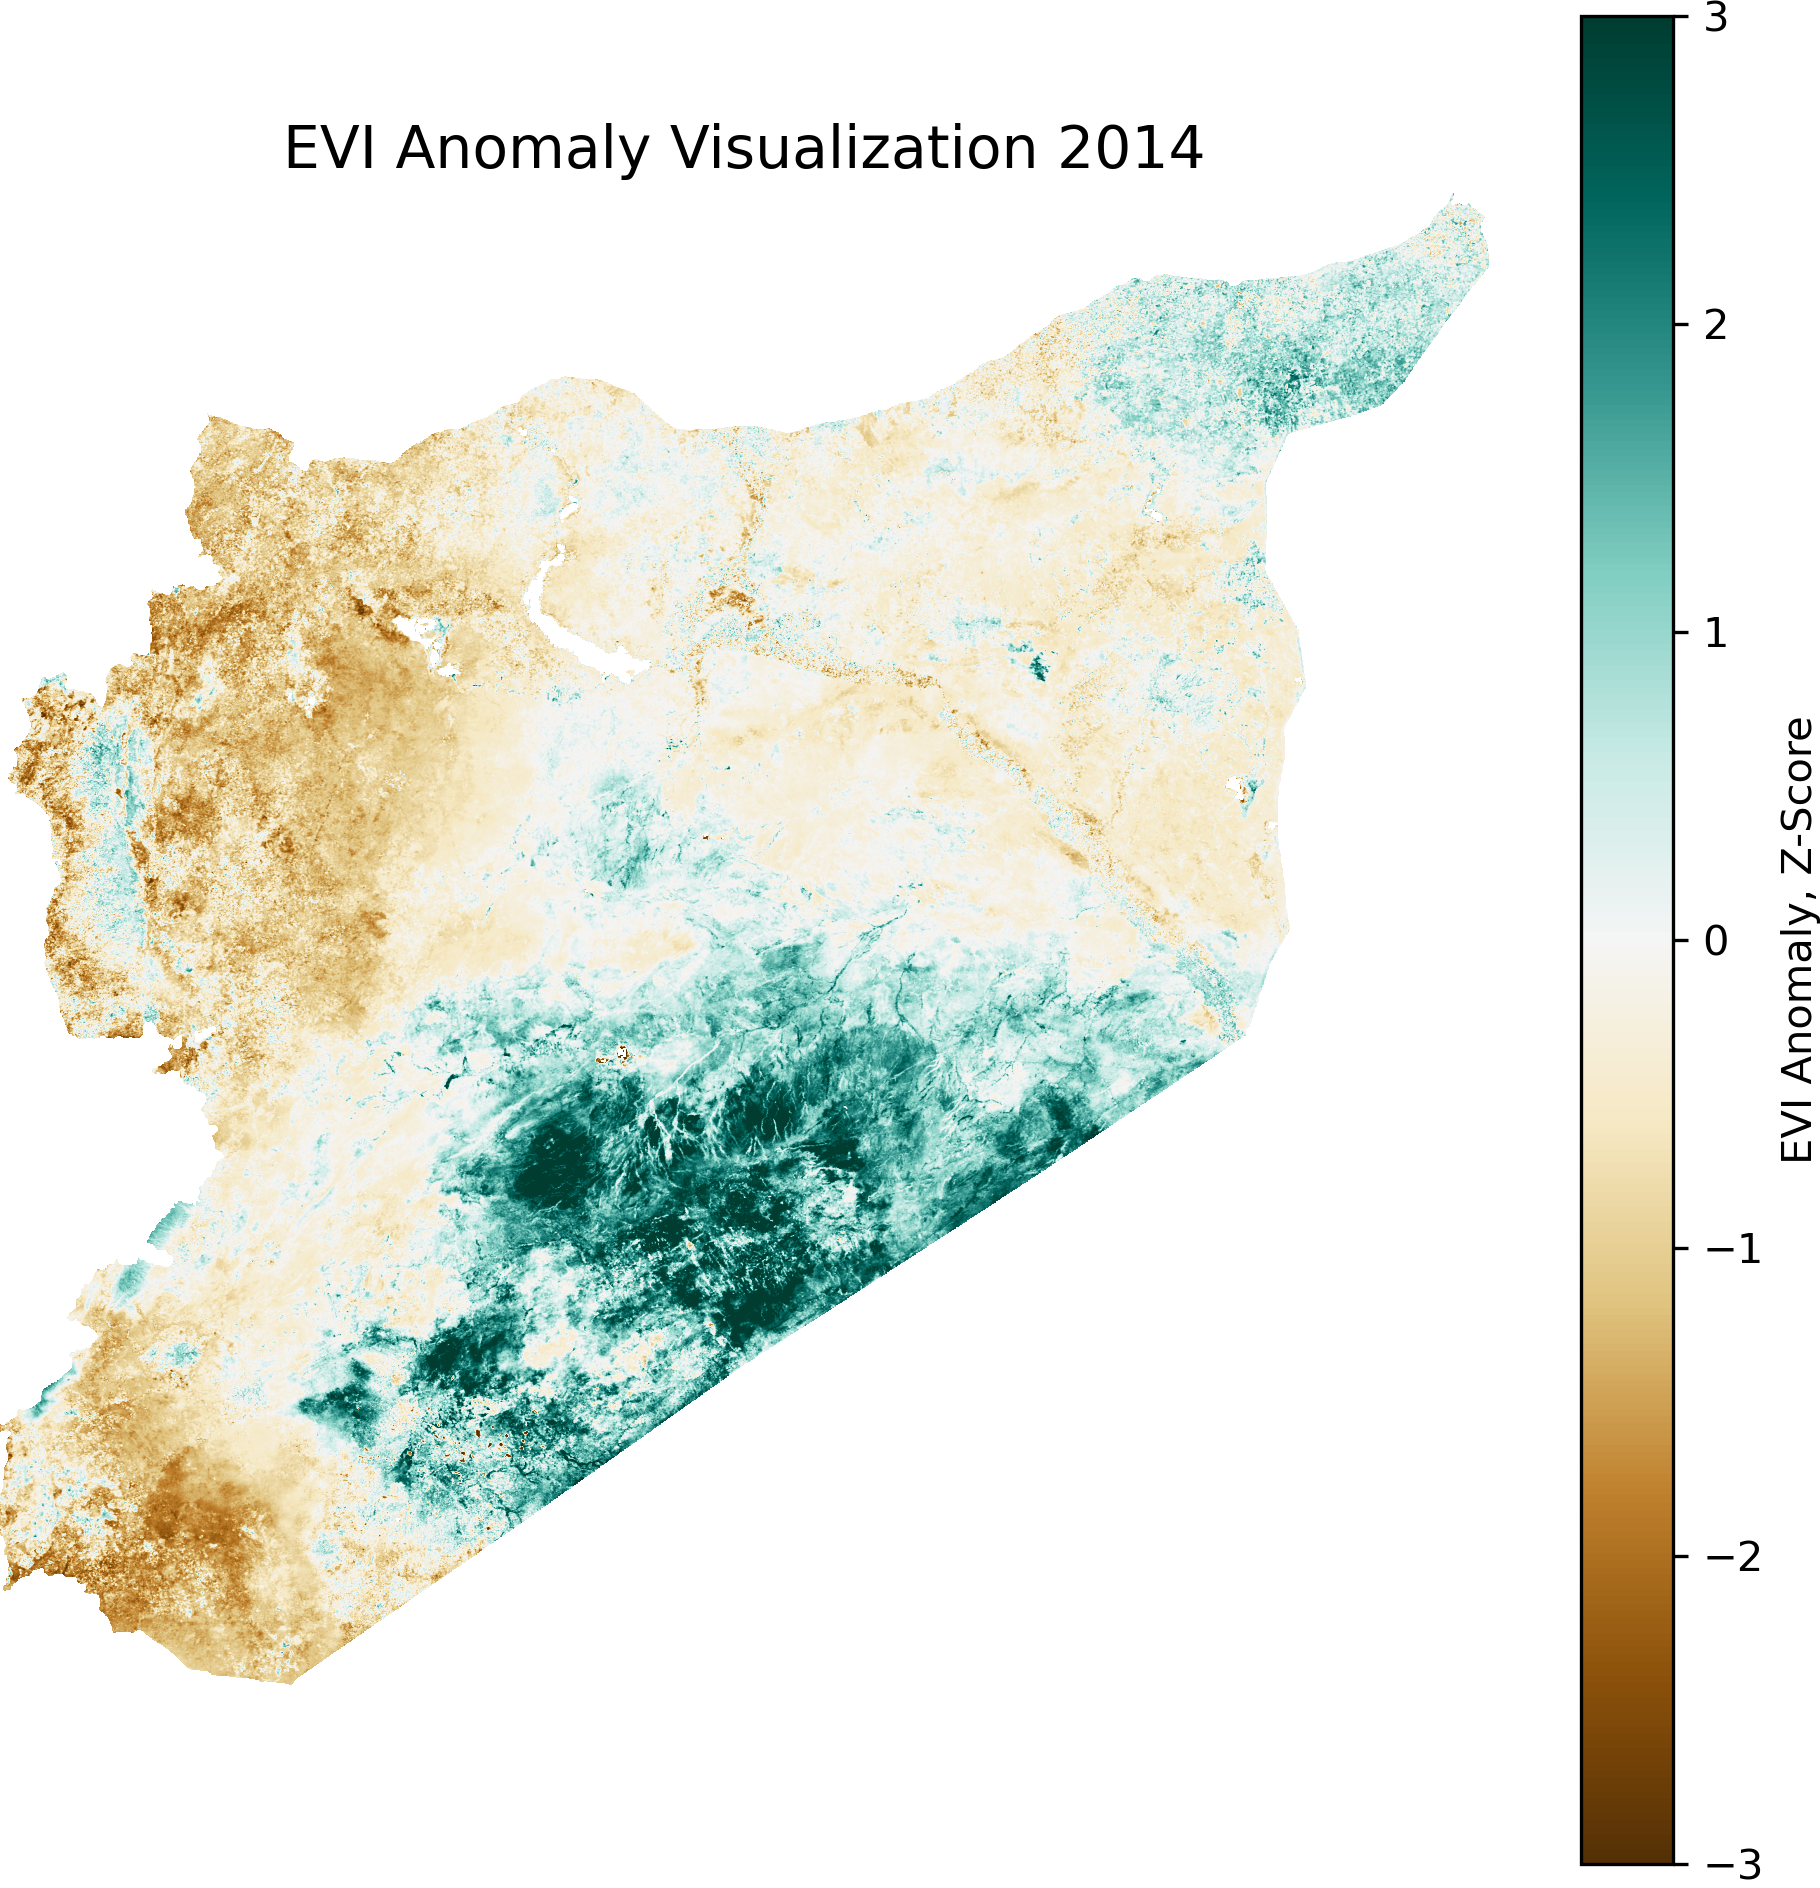
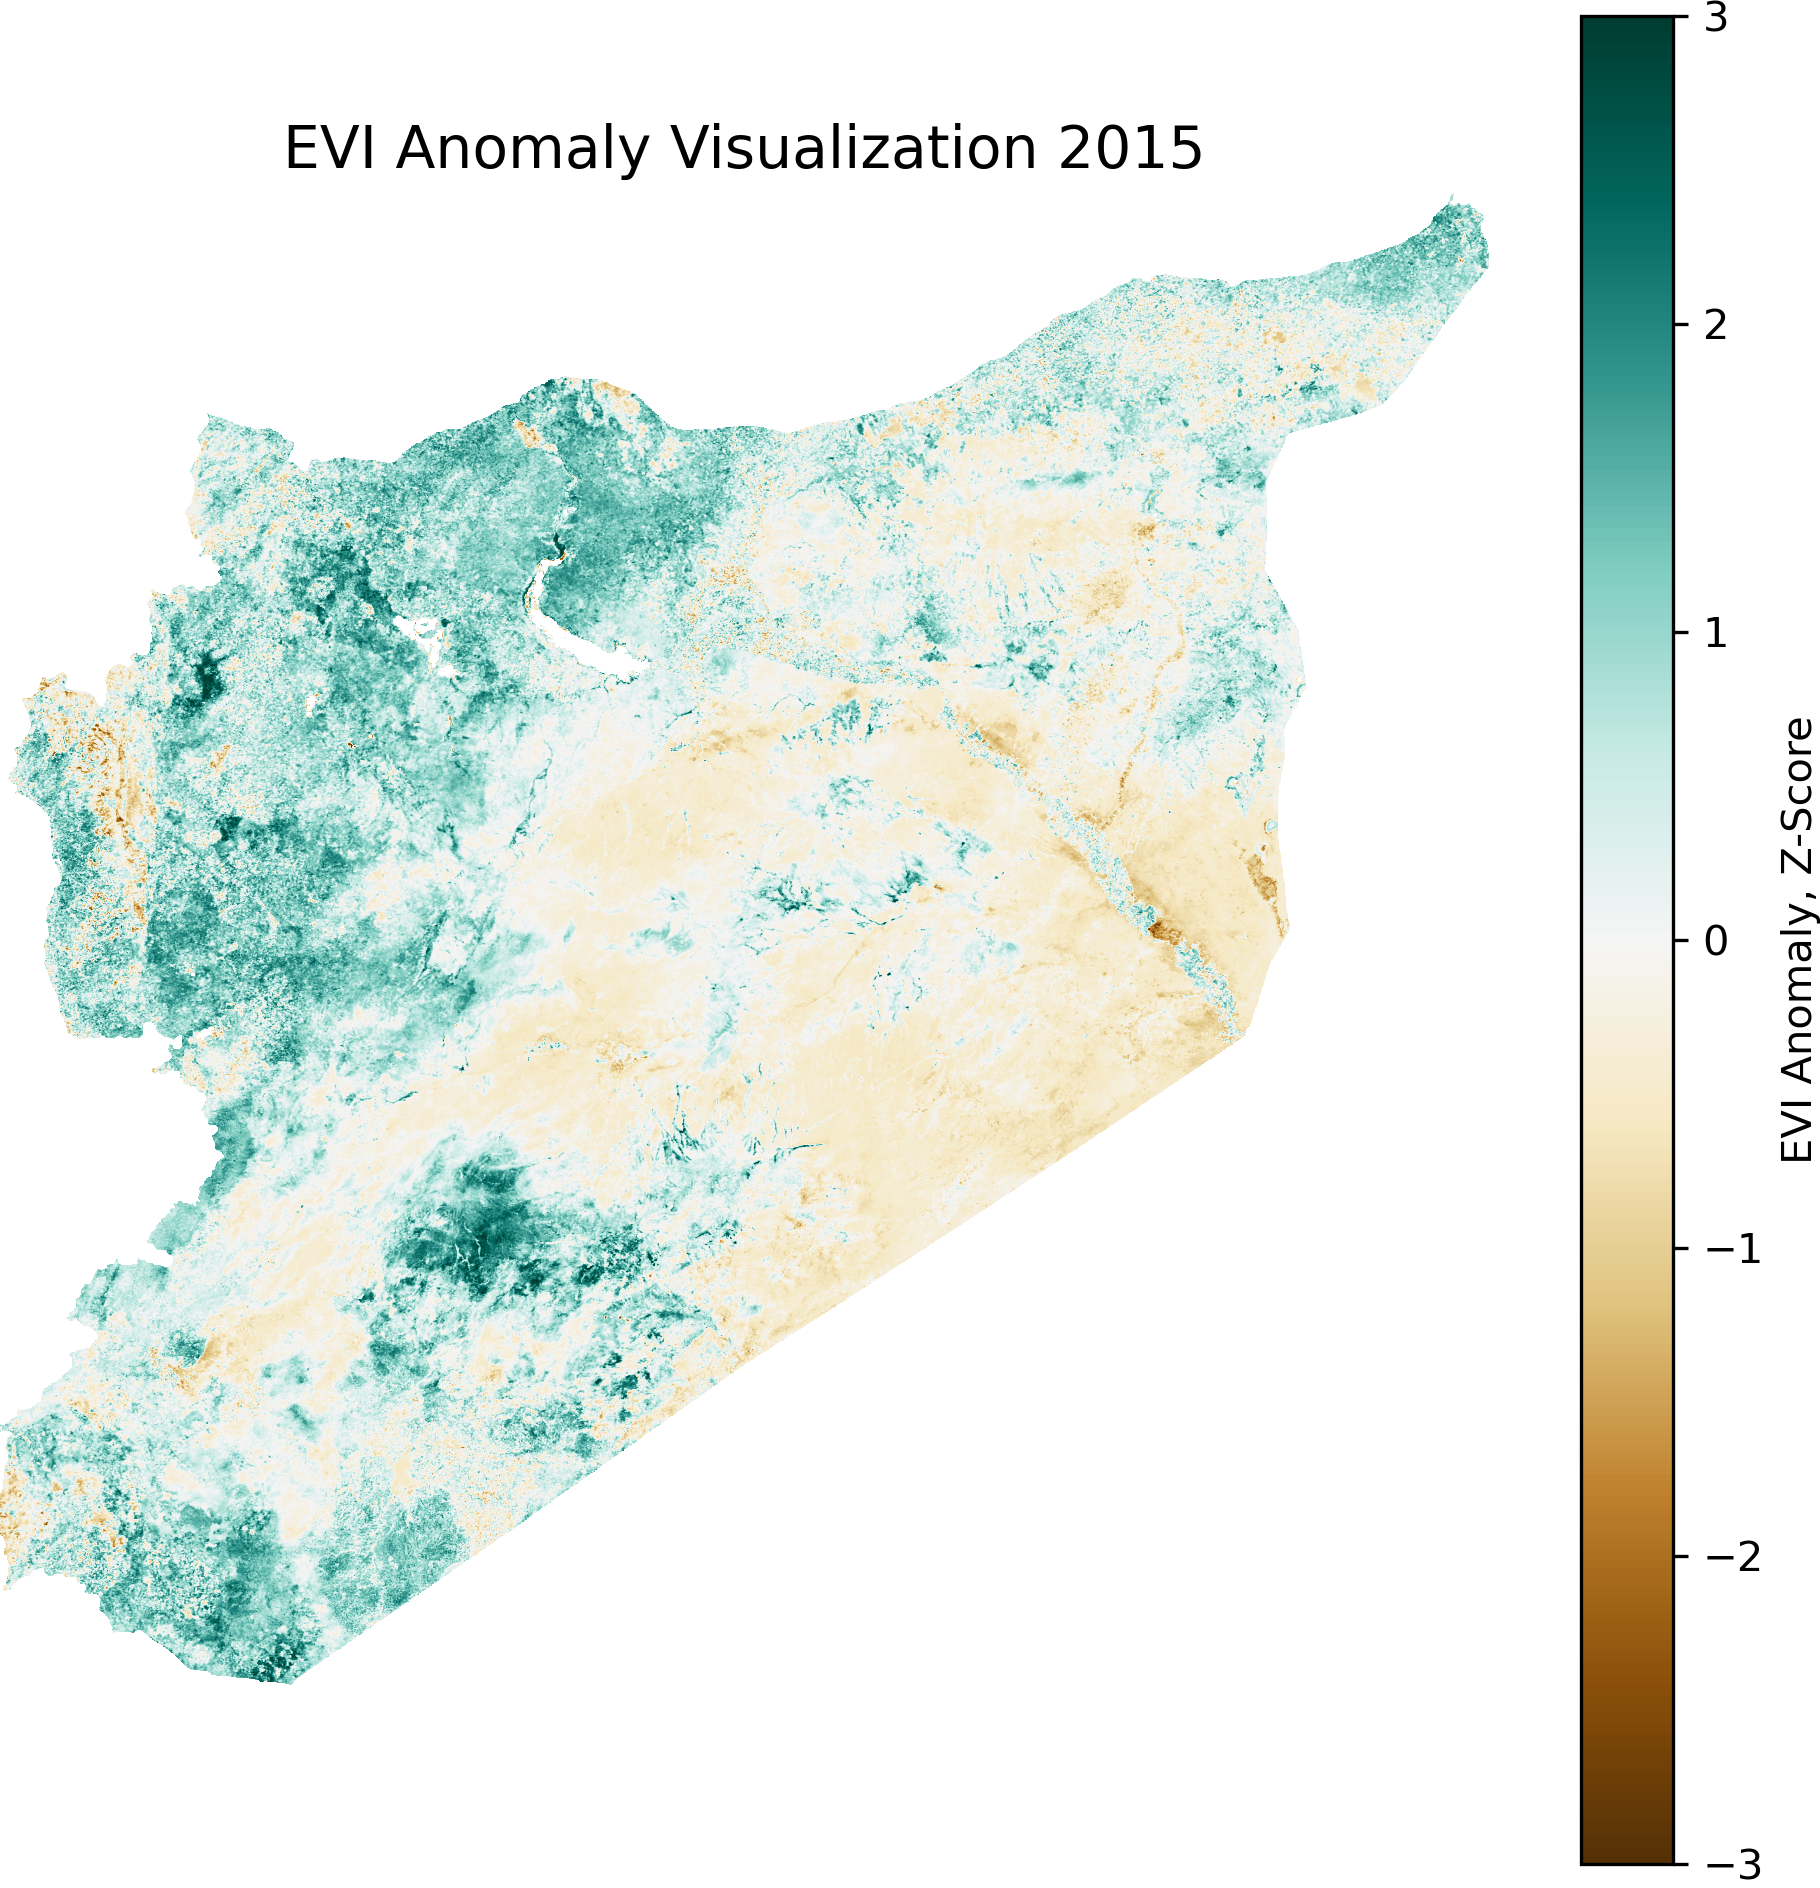
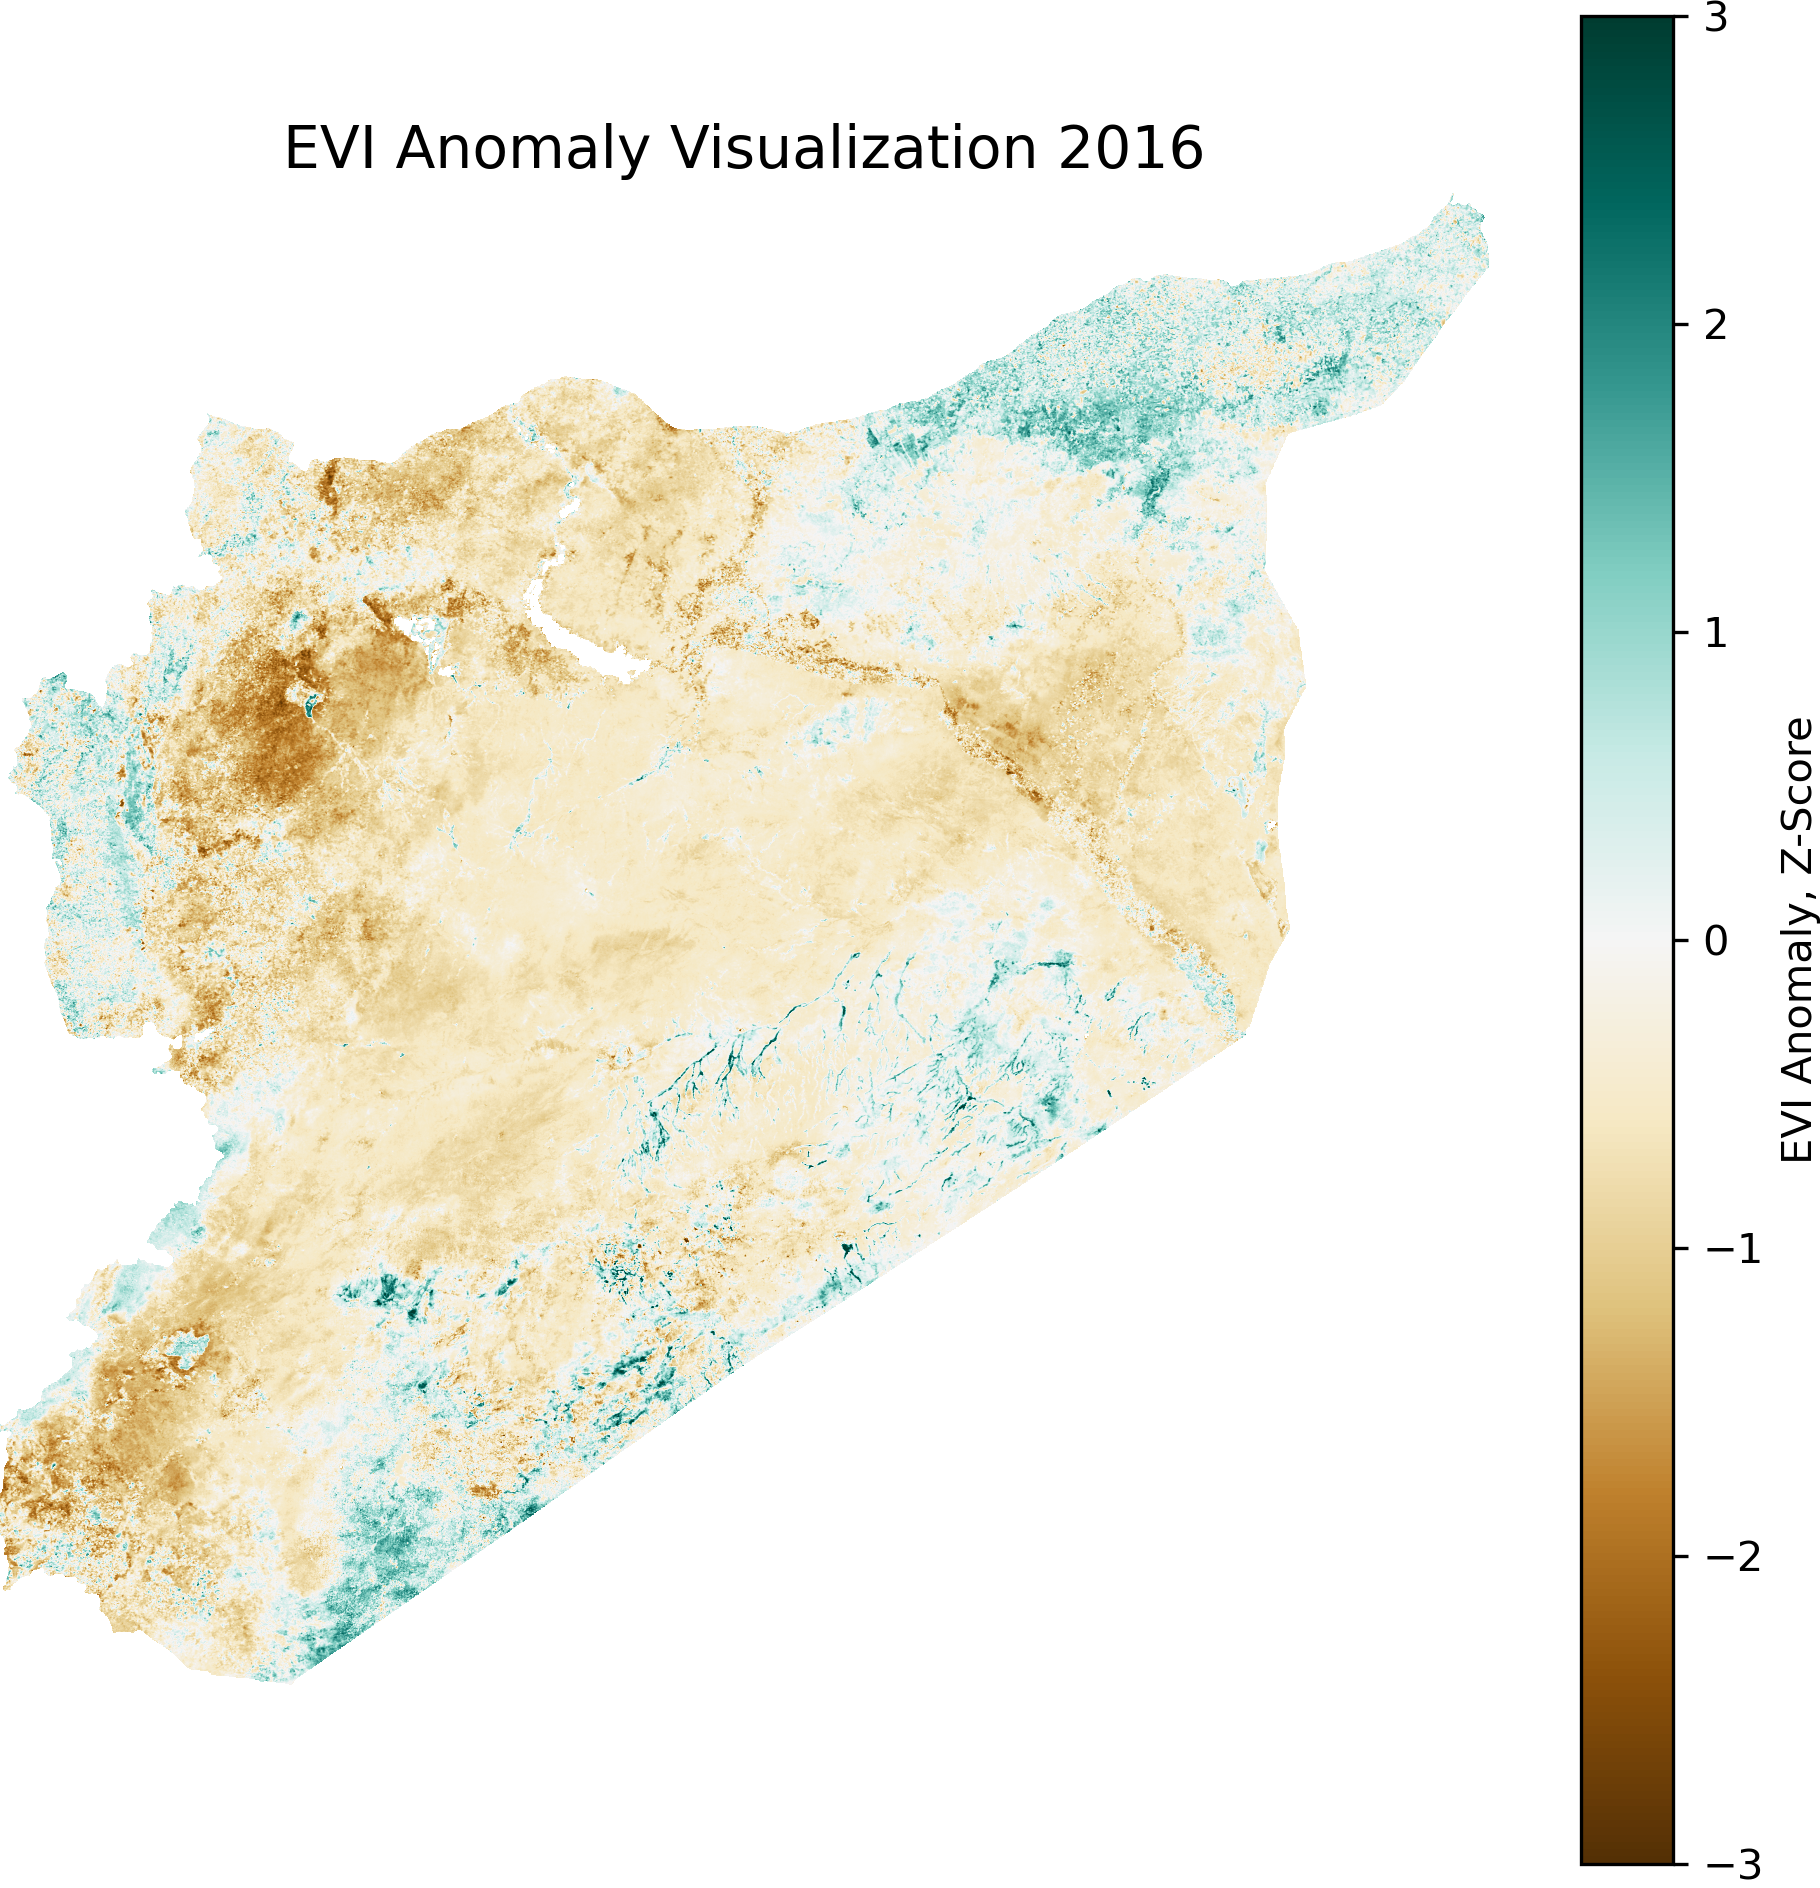
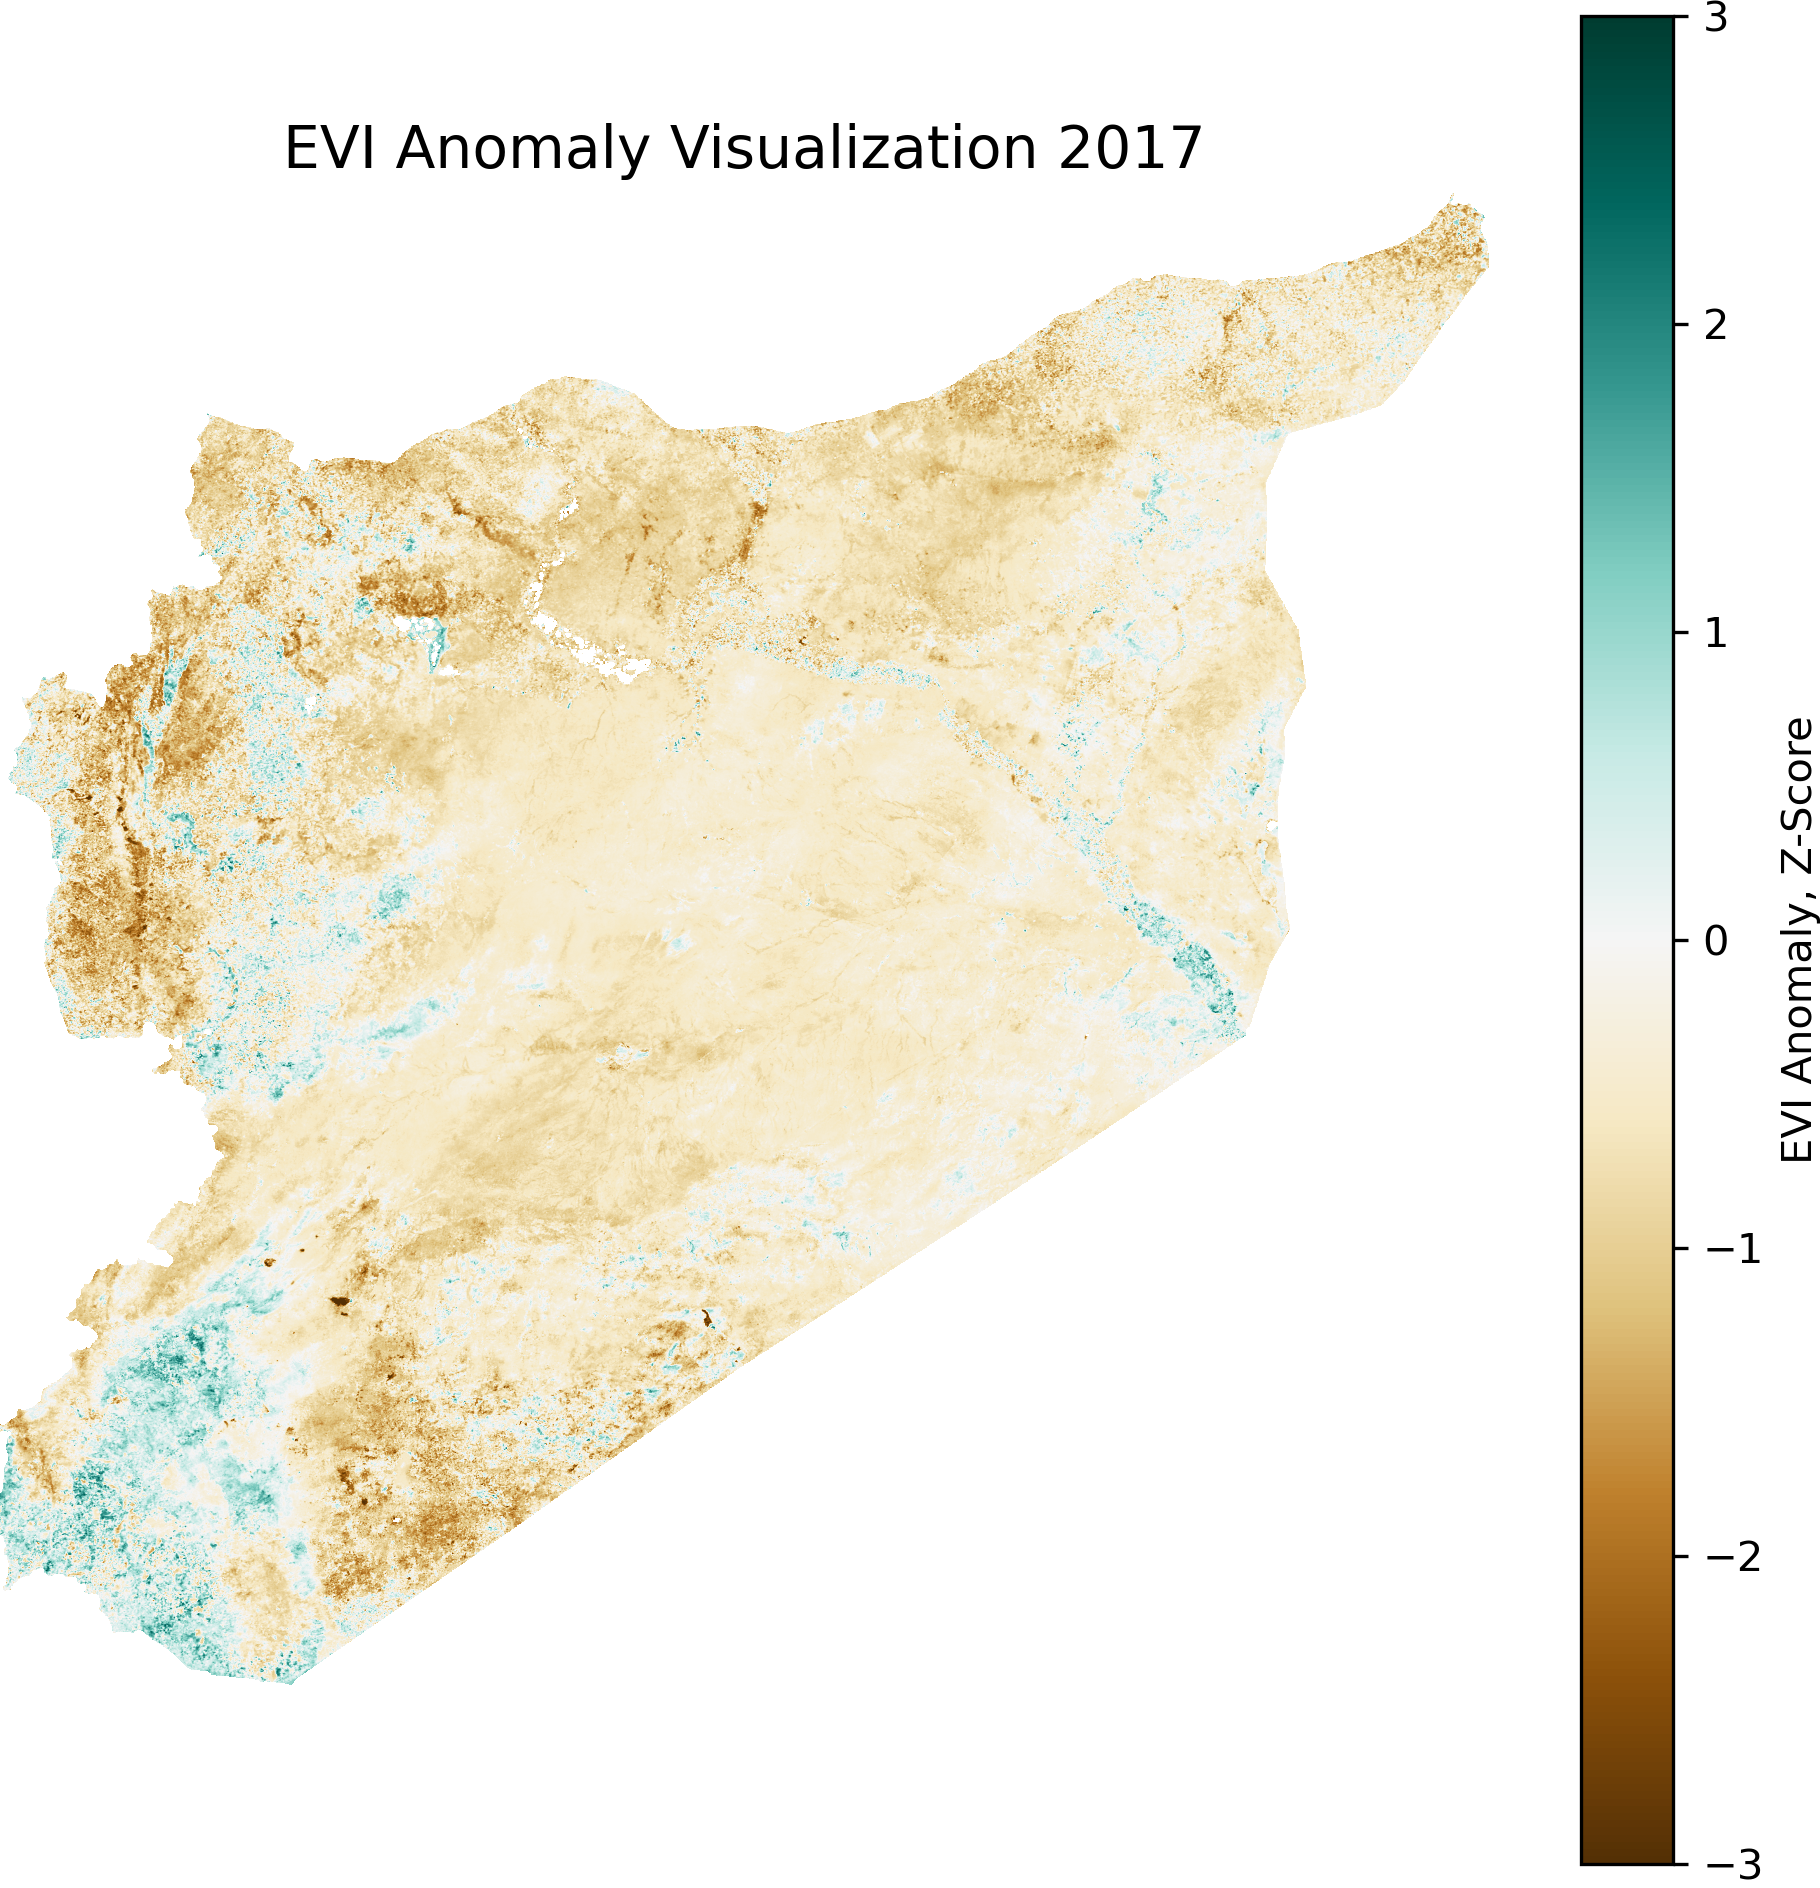
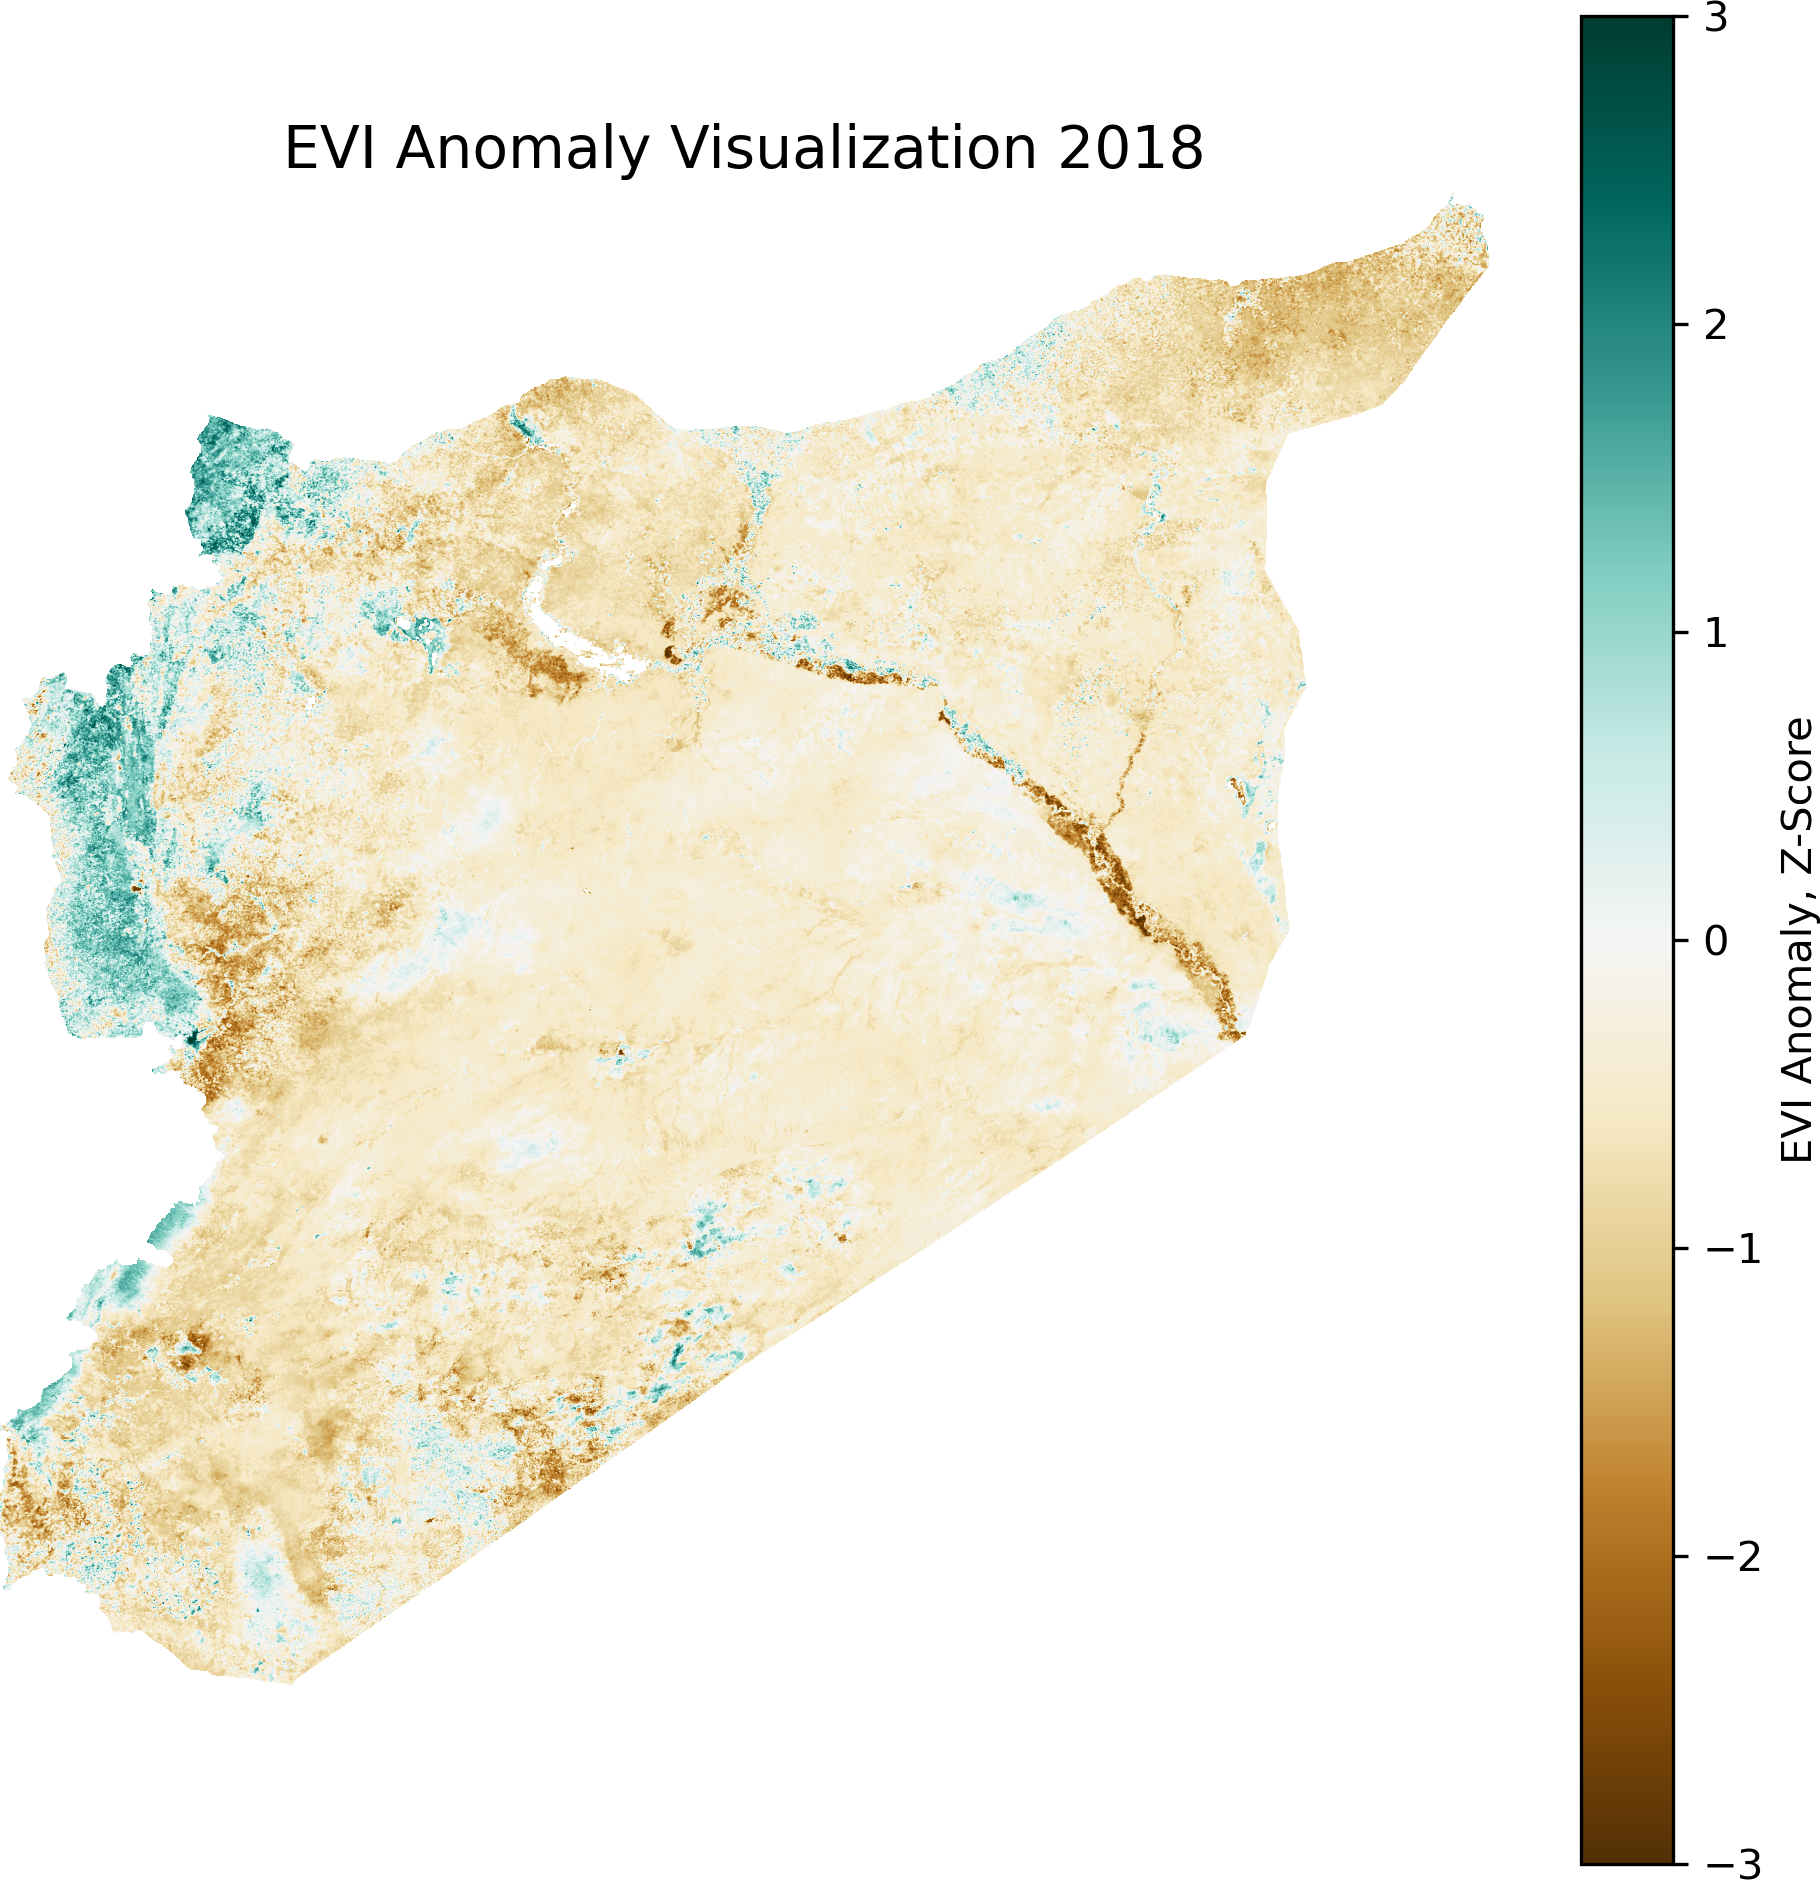
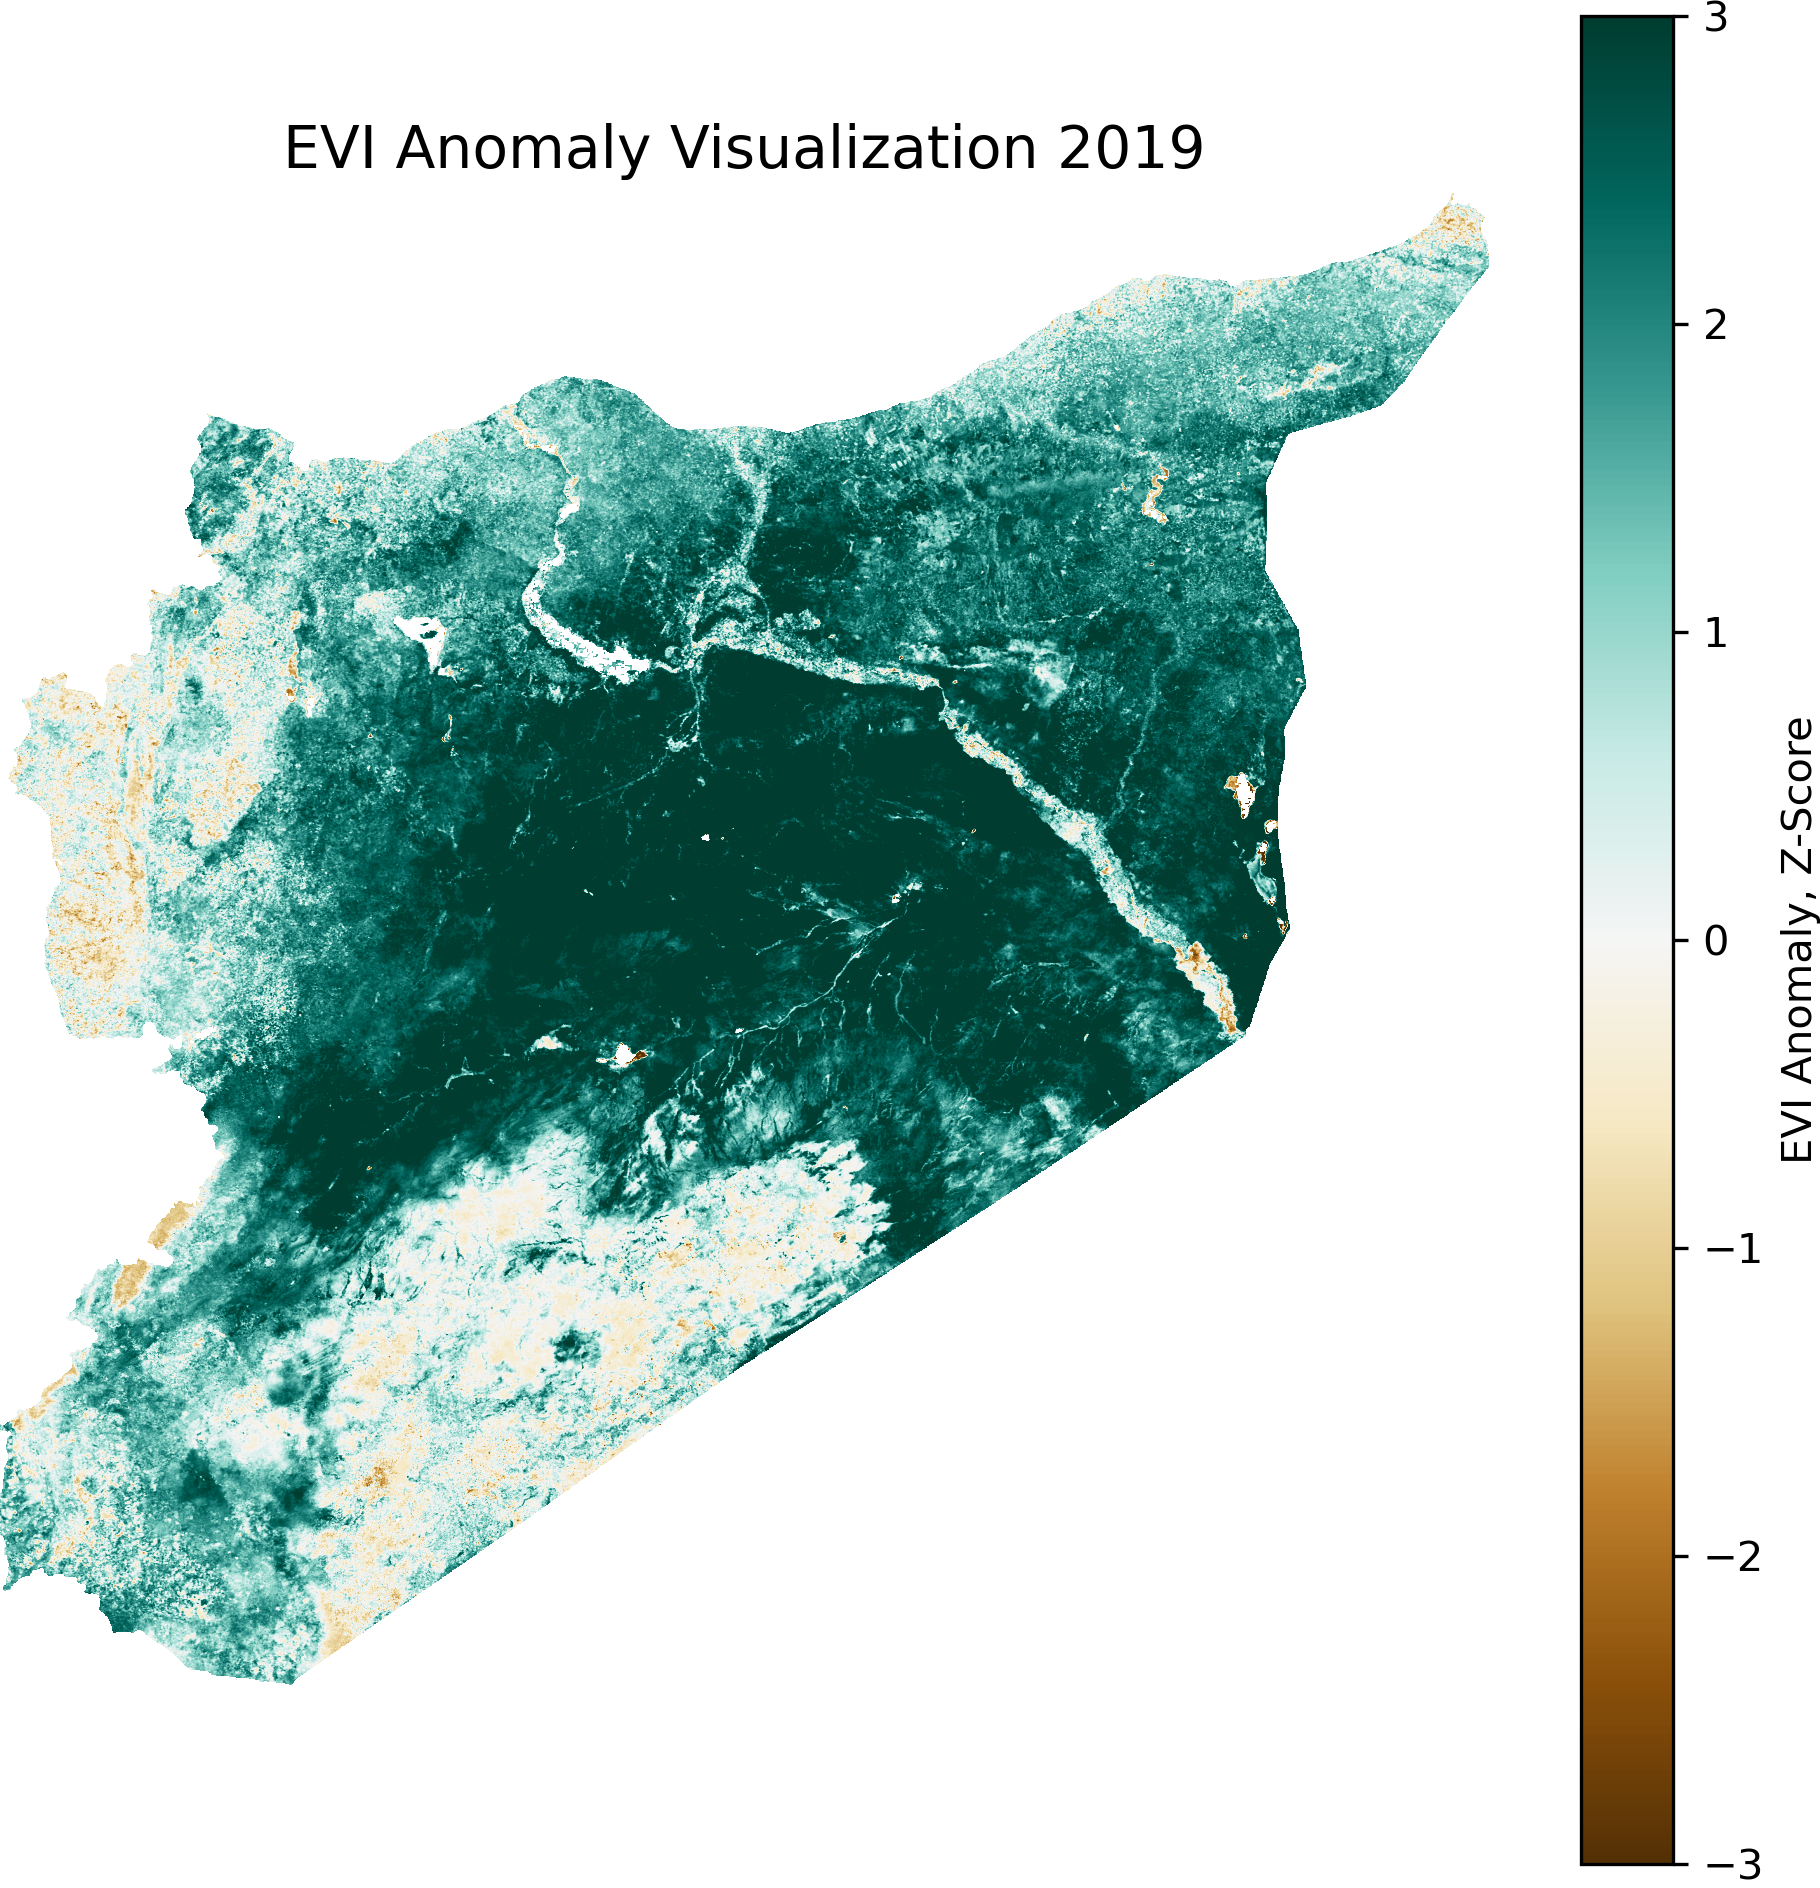
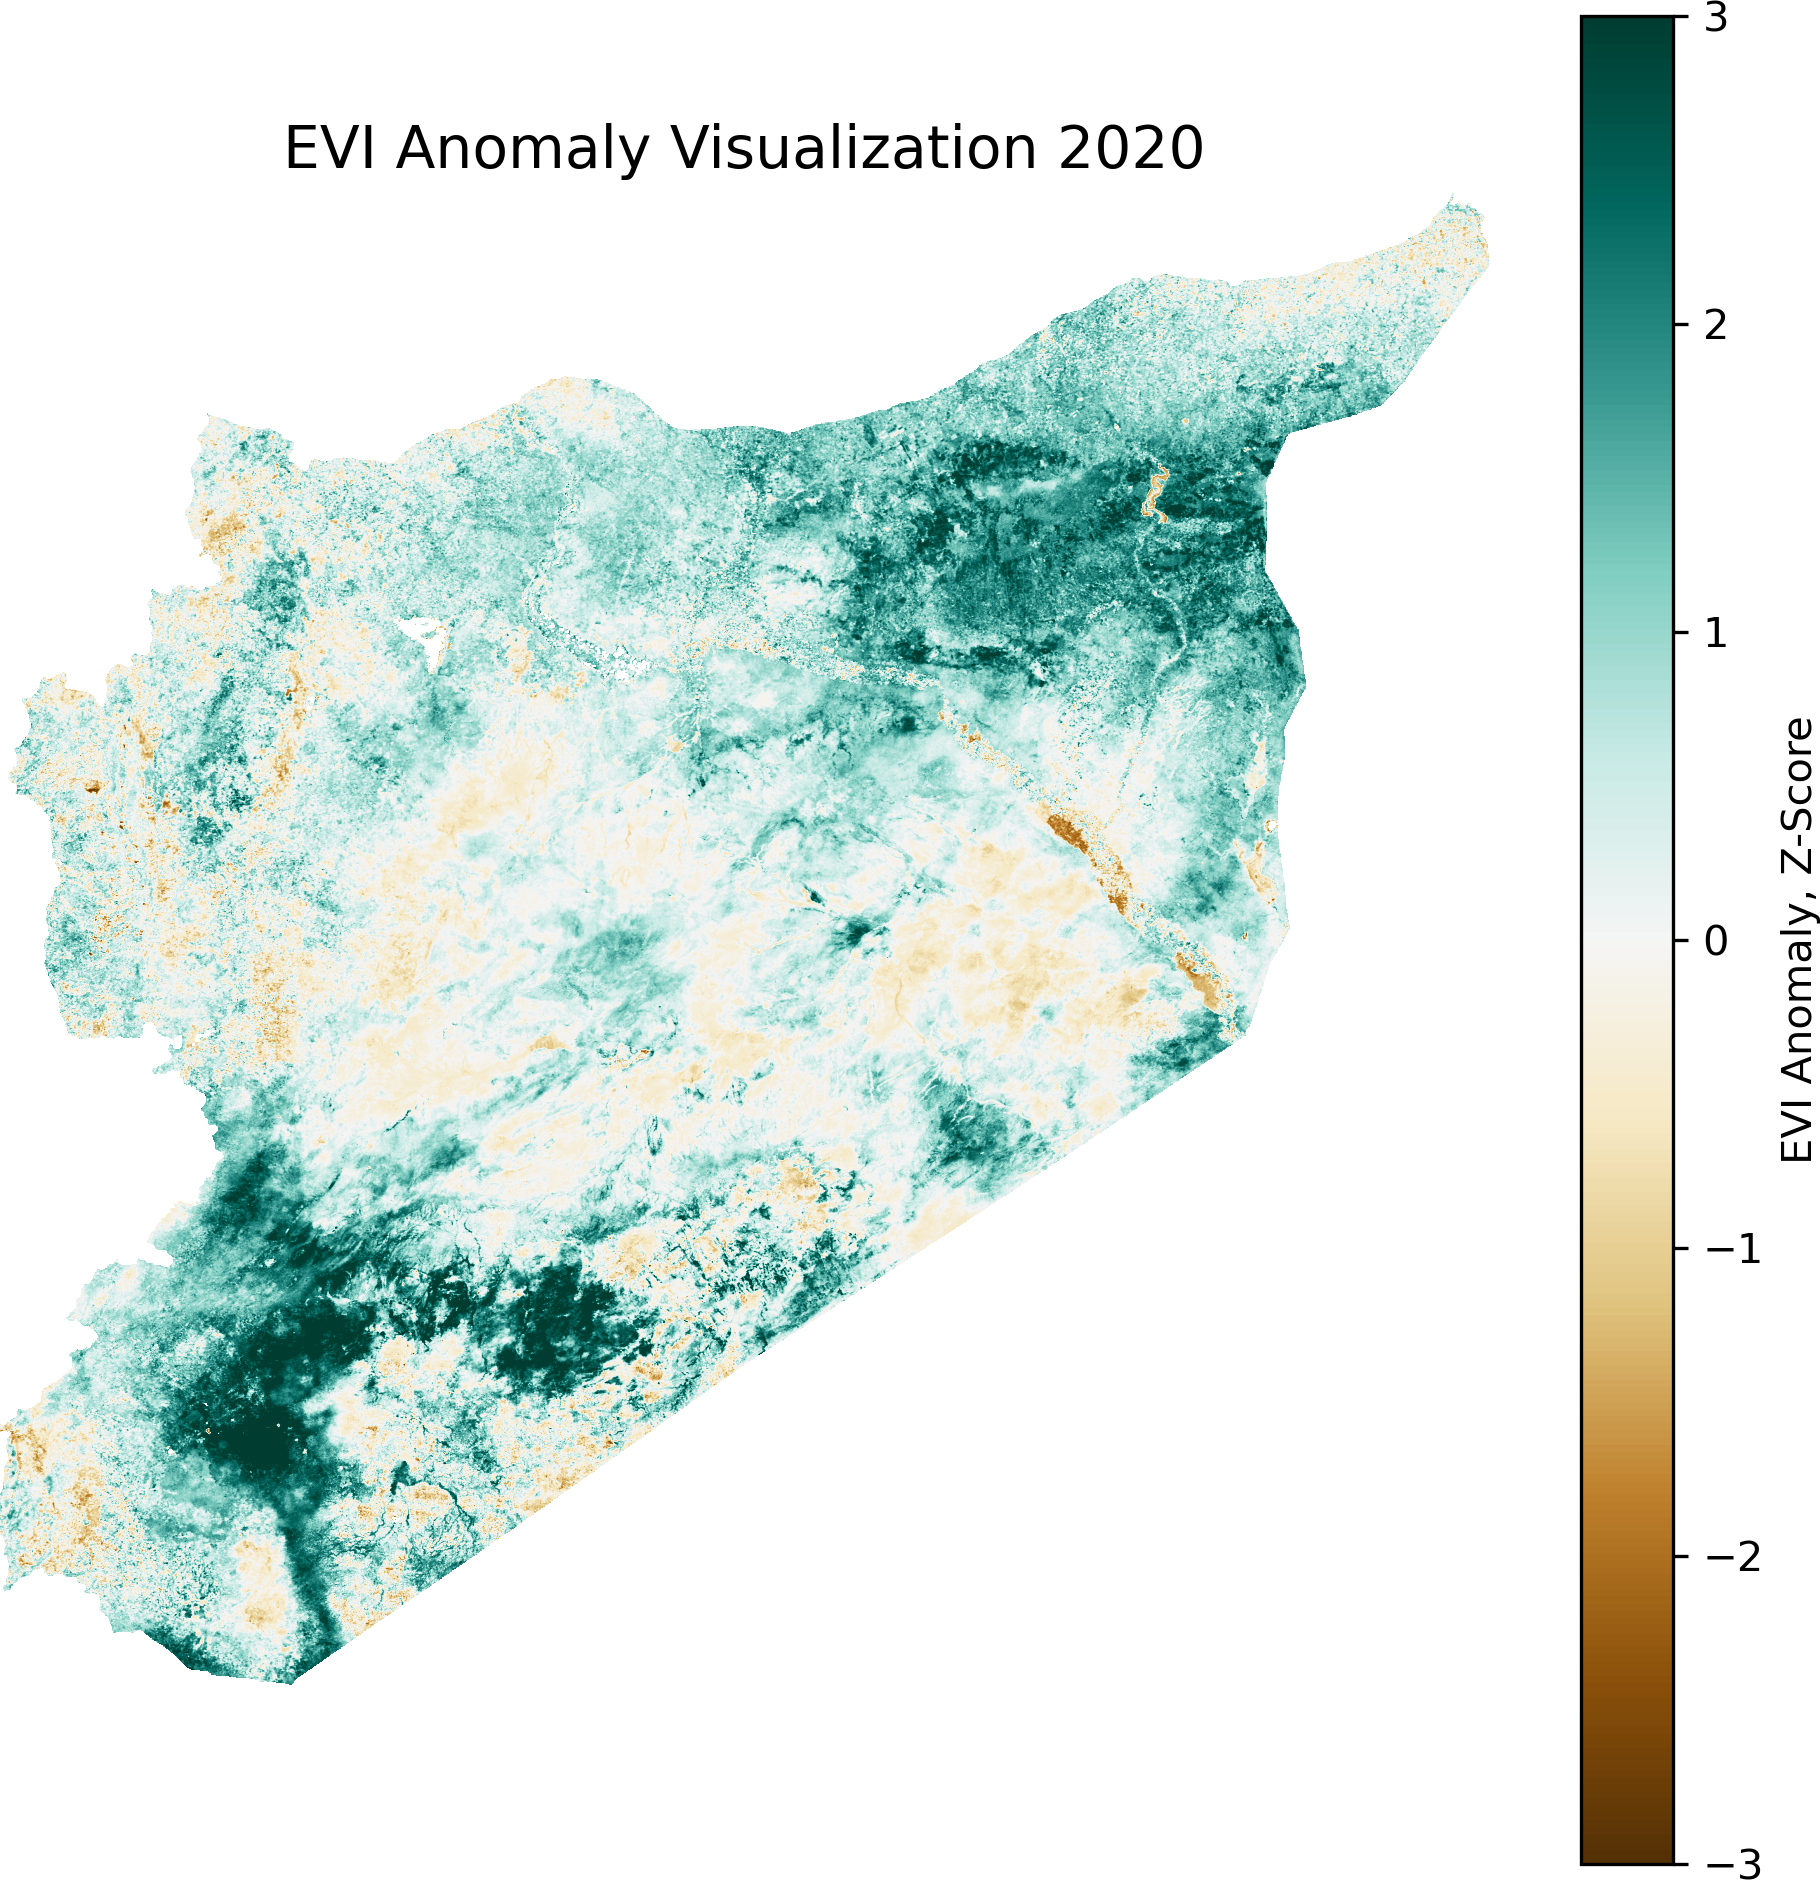
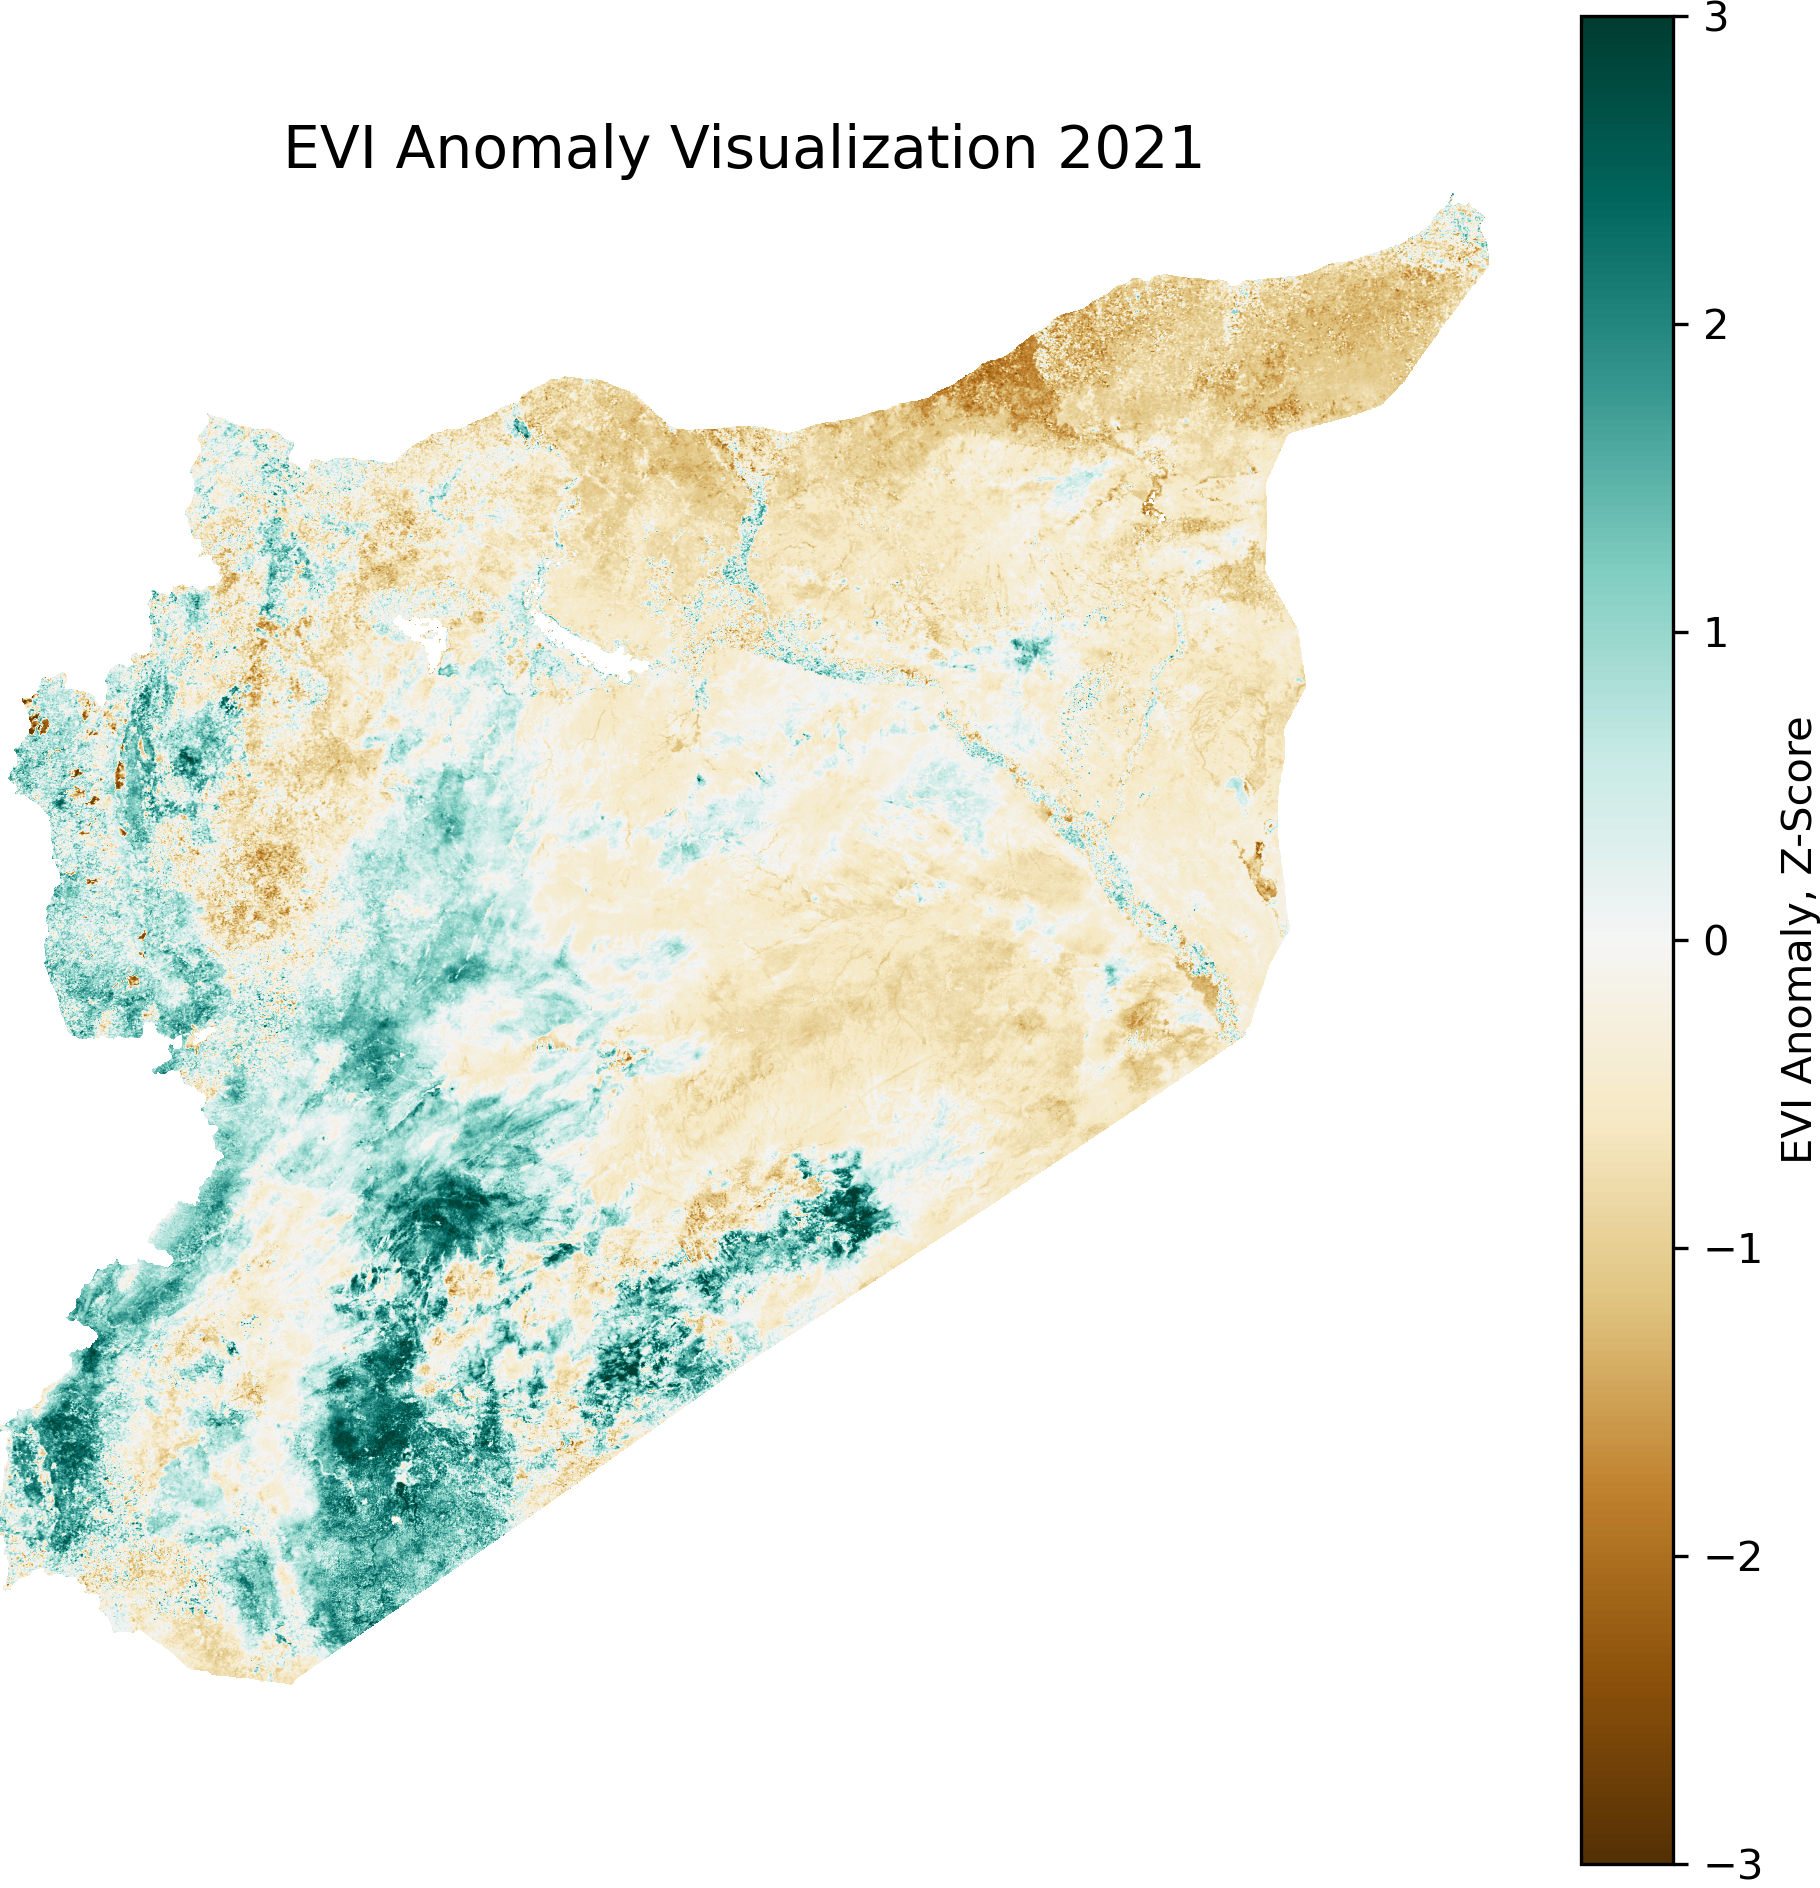
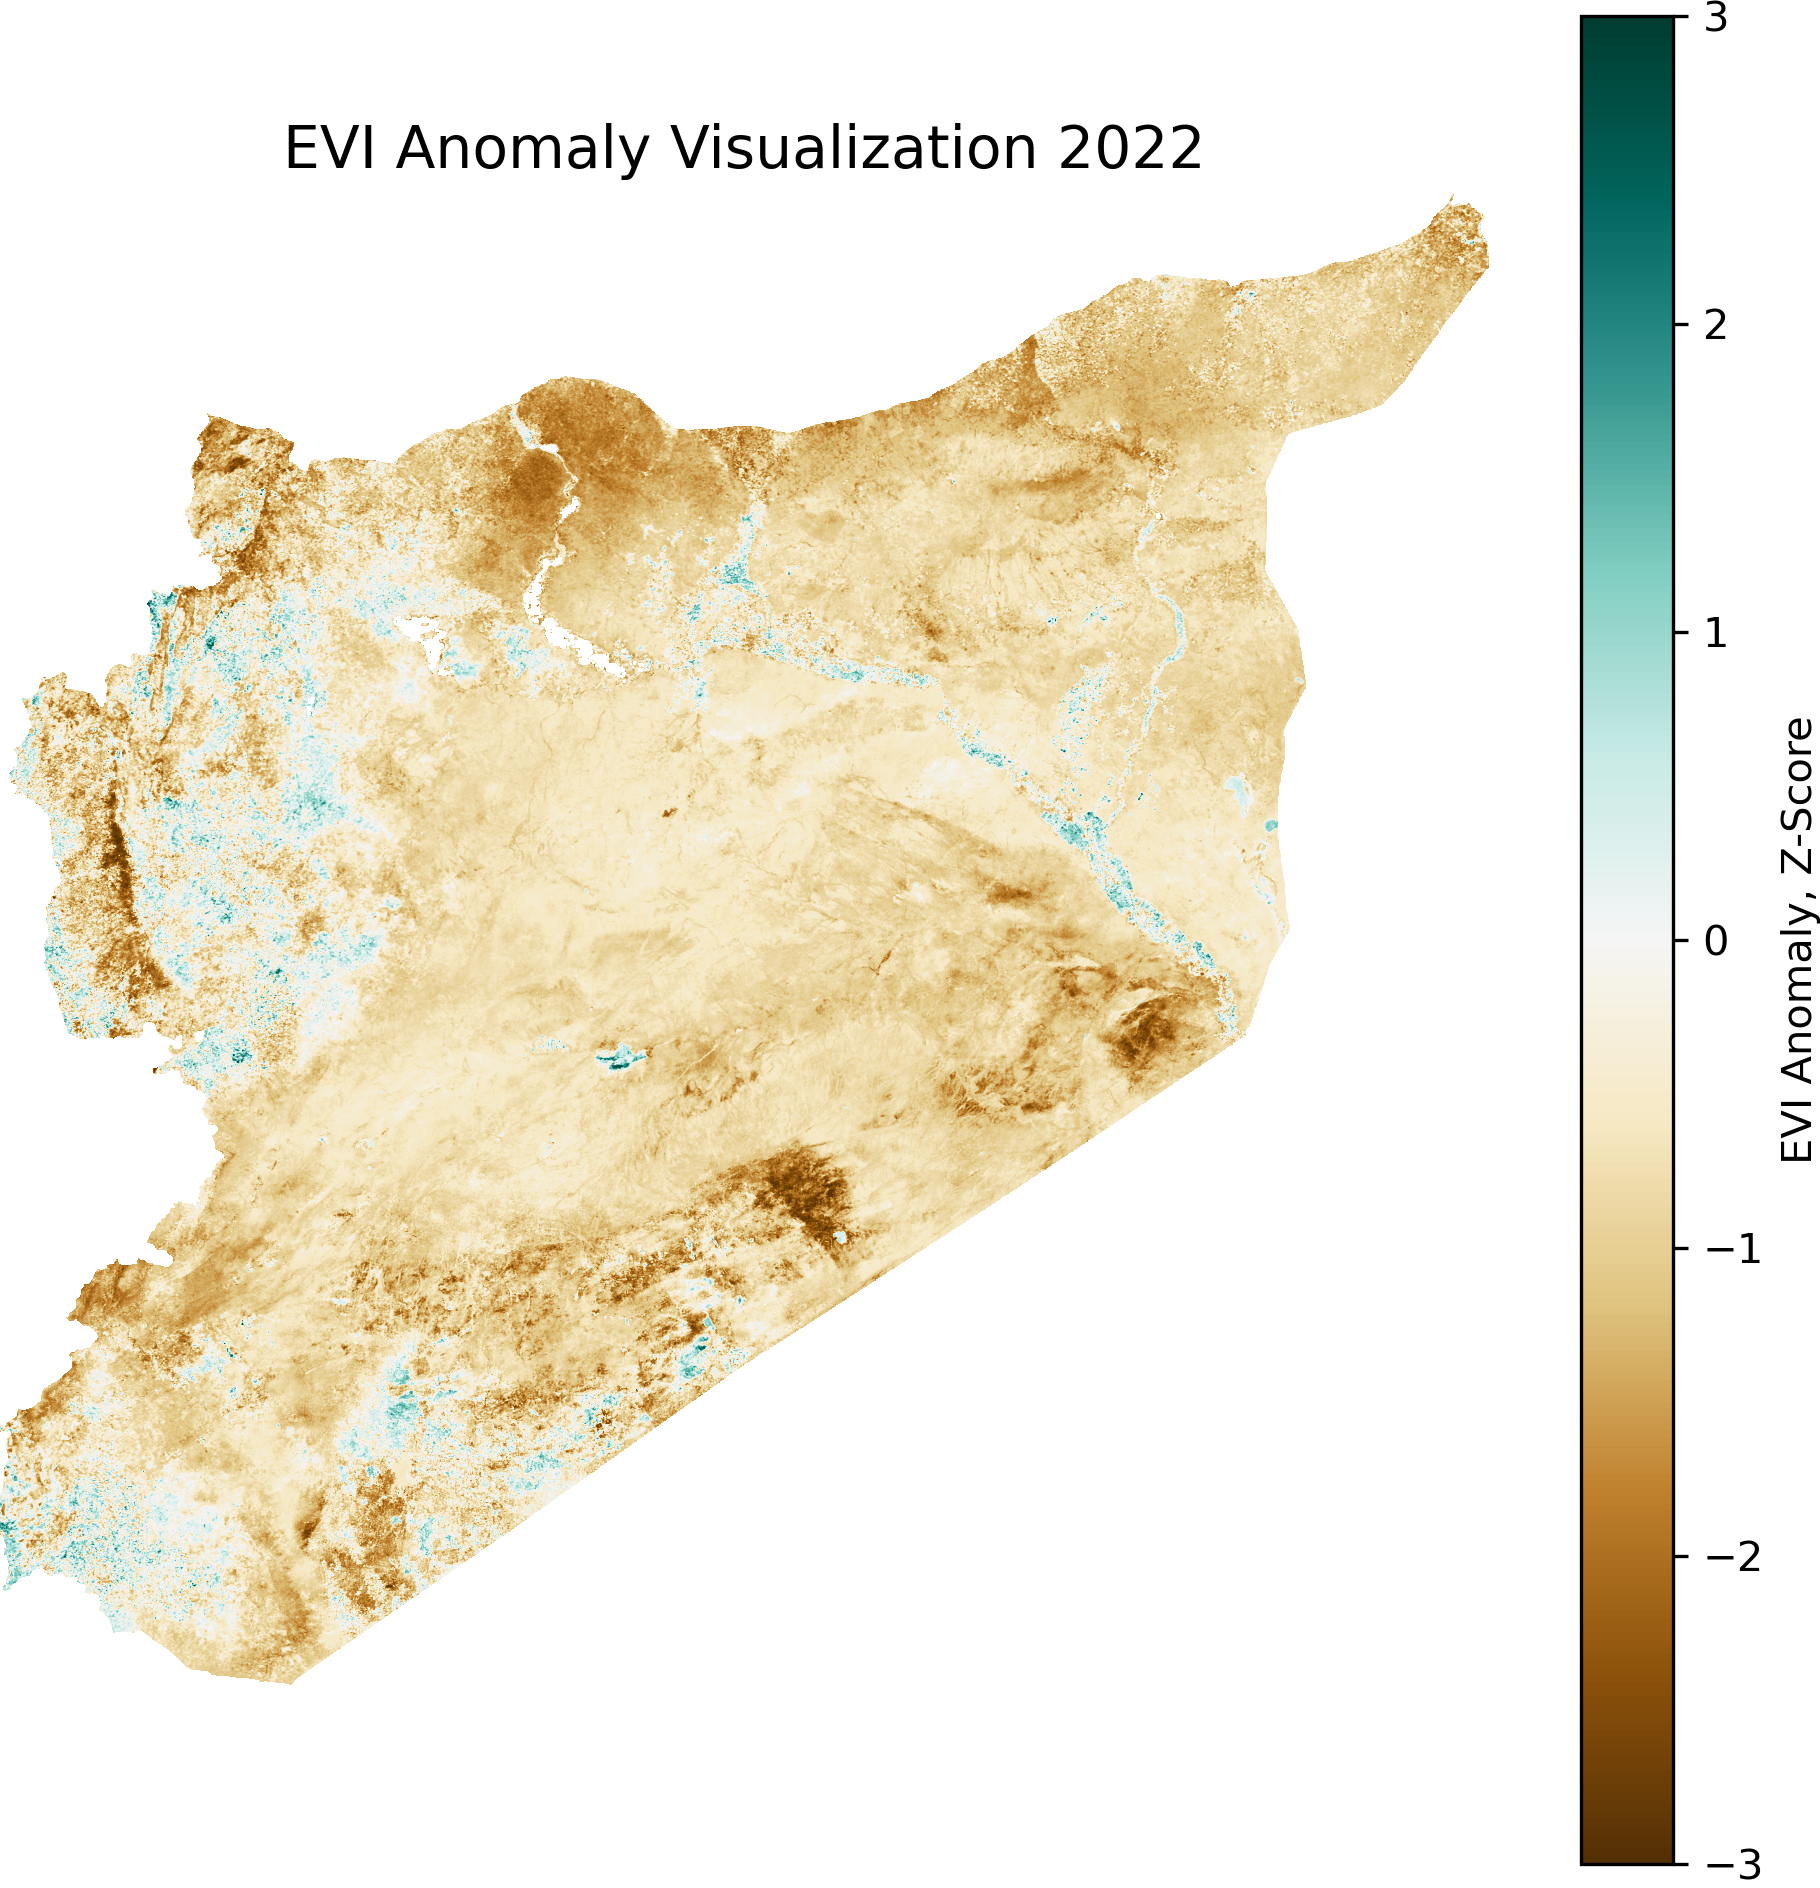
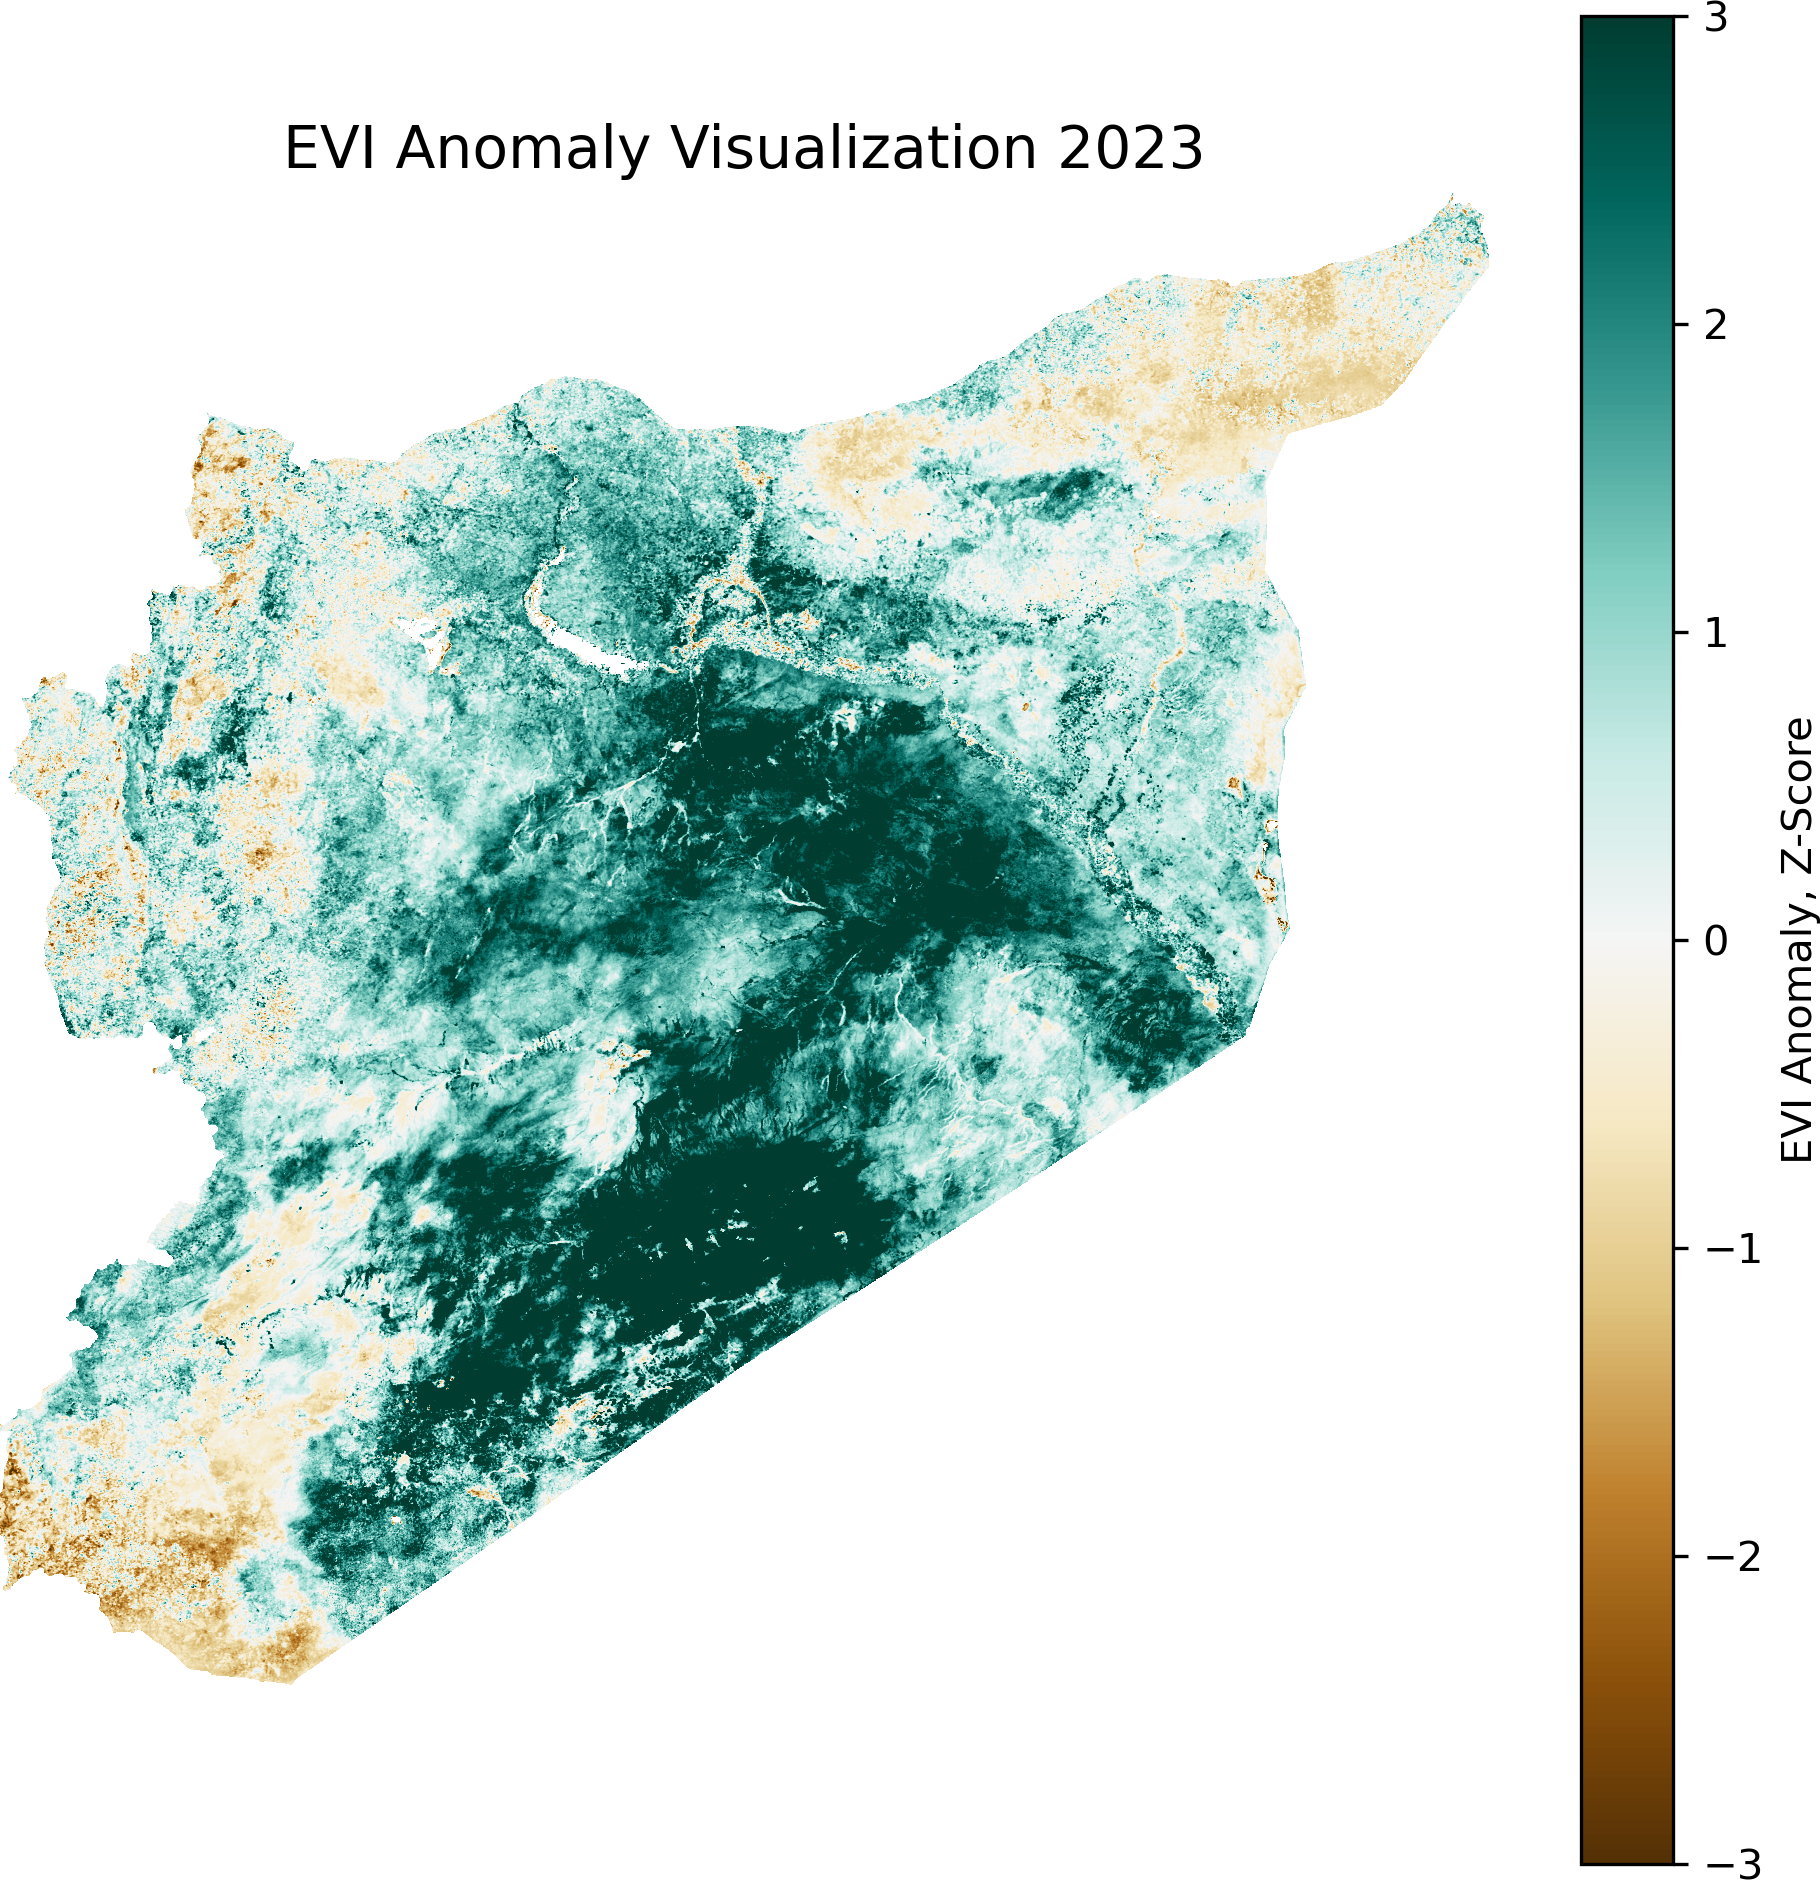
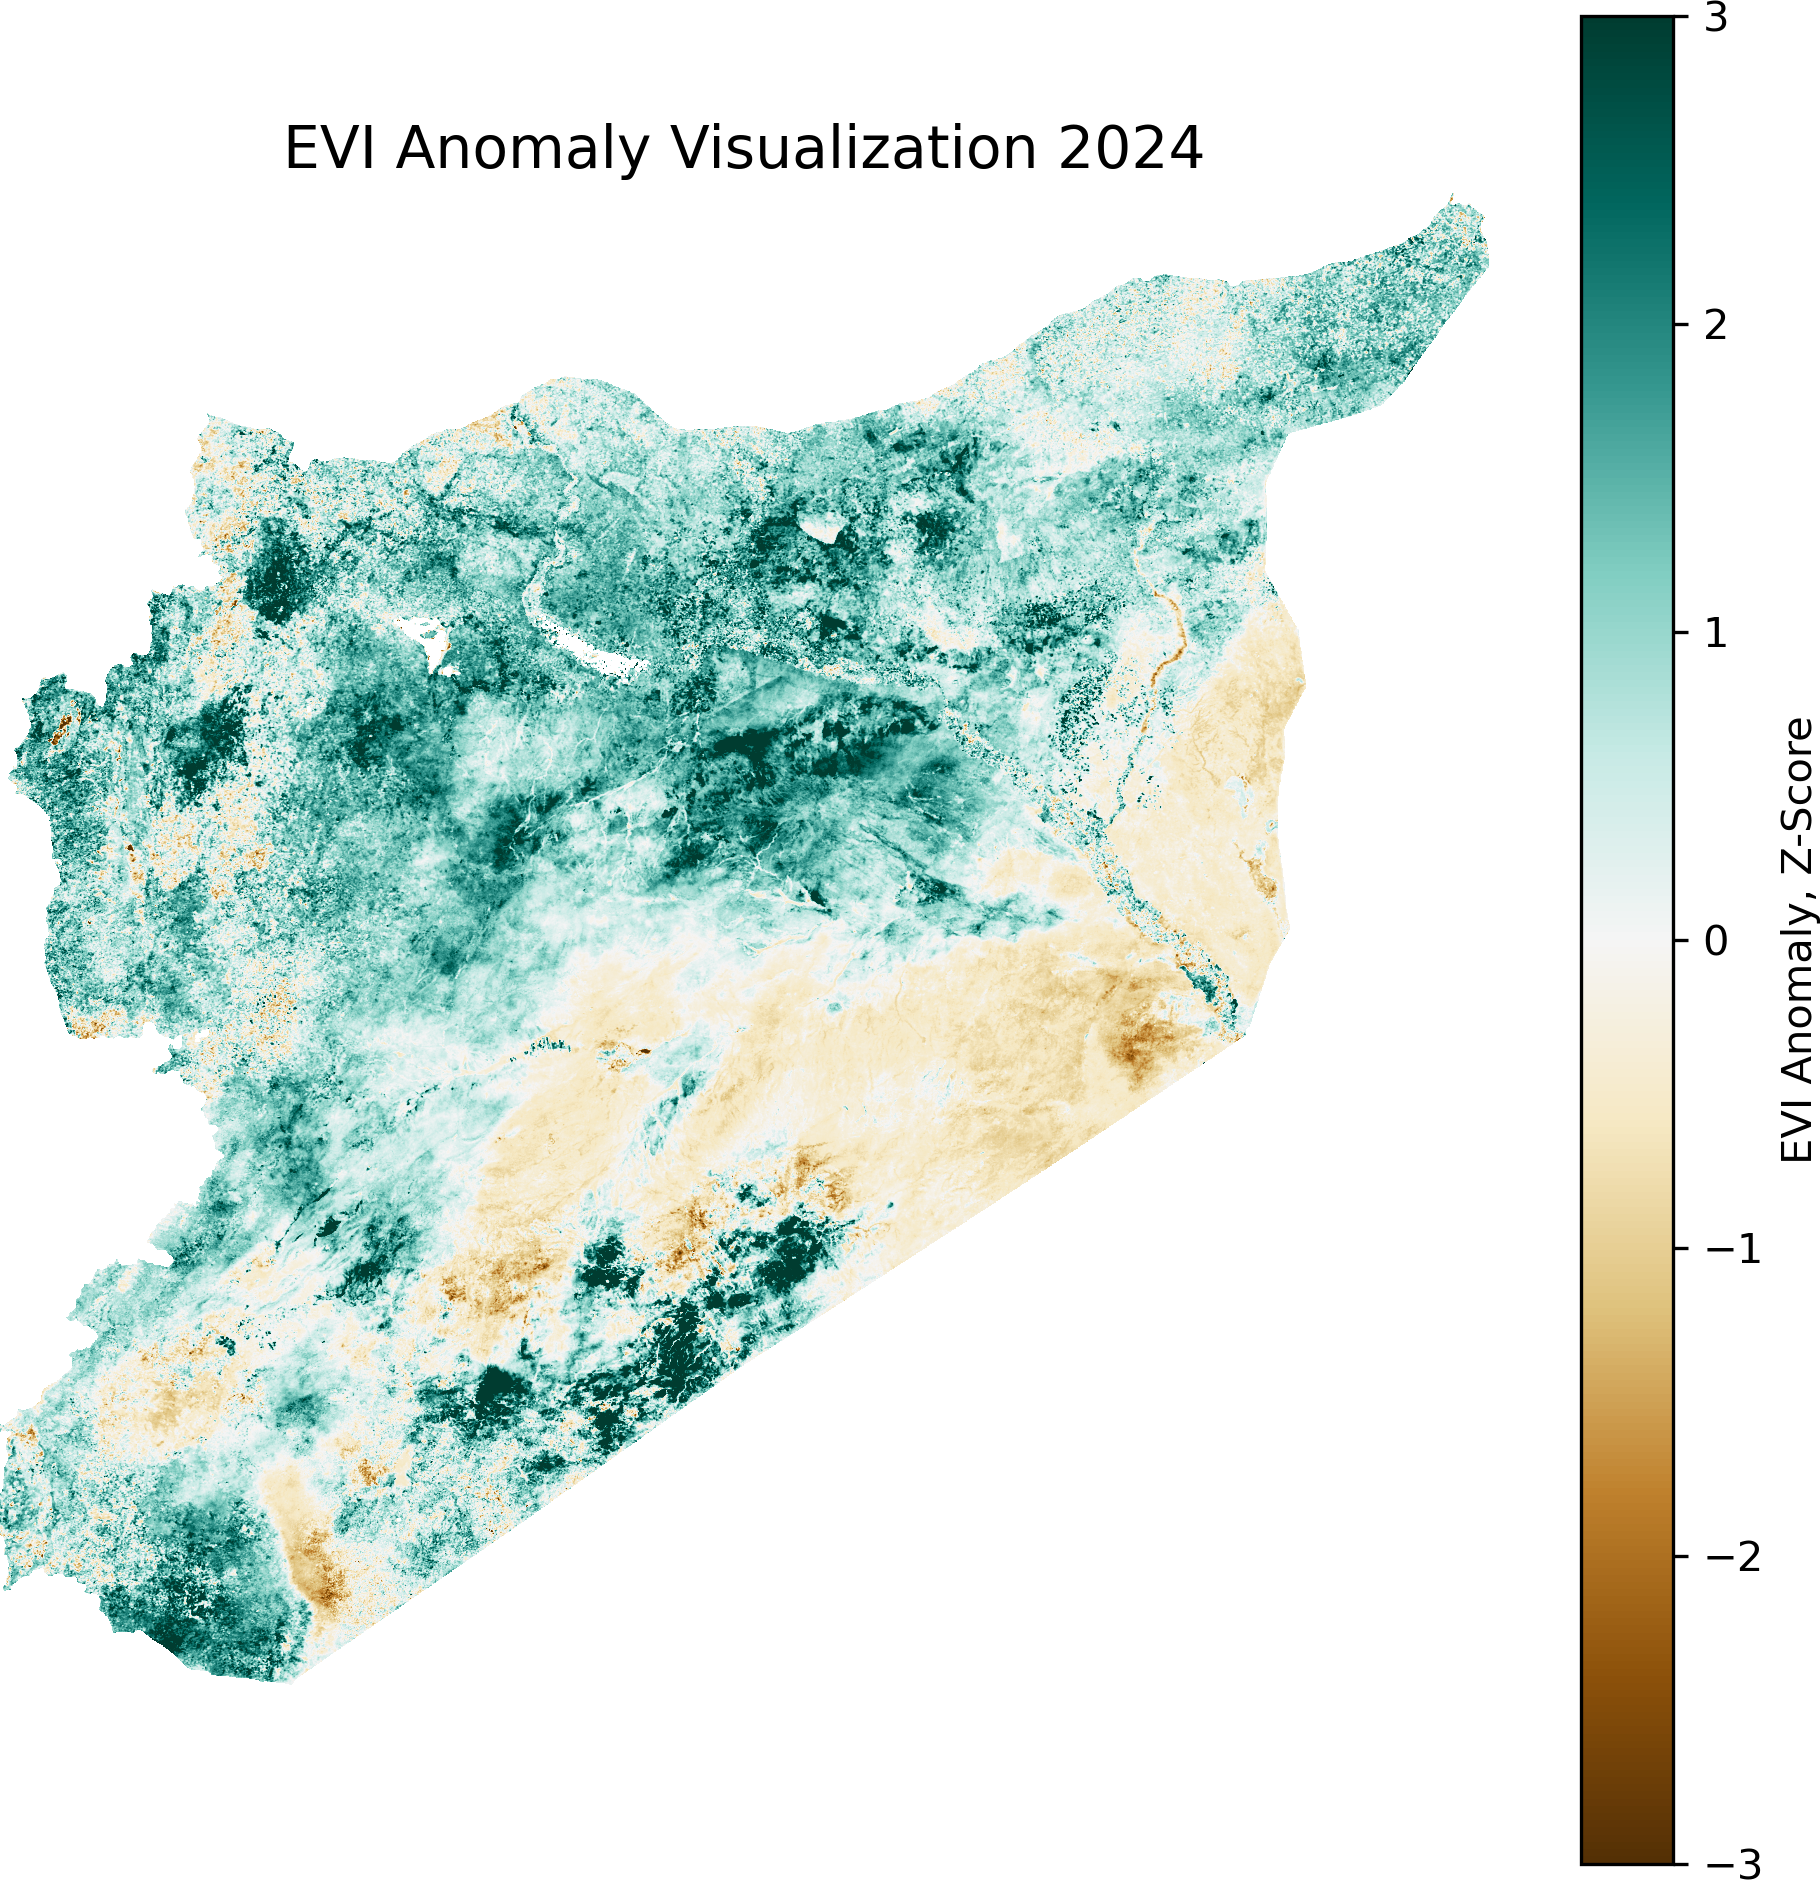
The seasonality parameters extracted confirm the crop calendar provided by FAO’s Global Information and Early Warning System, highlighting September as the peak month for the growing season. In order to estimate changes in agricultural productivity for a given year, we compare the monthly EVI value for September (median) against a historical baseline with 10 years of data (2004 through 2018).
There are different approaches to calculate a deviation from a reference baseline, we express it as a z-score deviation.
Z-Score Calculation#
The anomaly is calculated based on difference from the average and standard deviation.
EVI and conflict Trends#
Conflict Impact and Agriculture#
Declining Fatalities and Conflict Intensity:
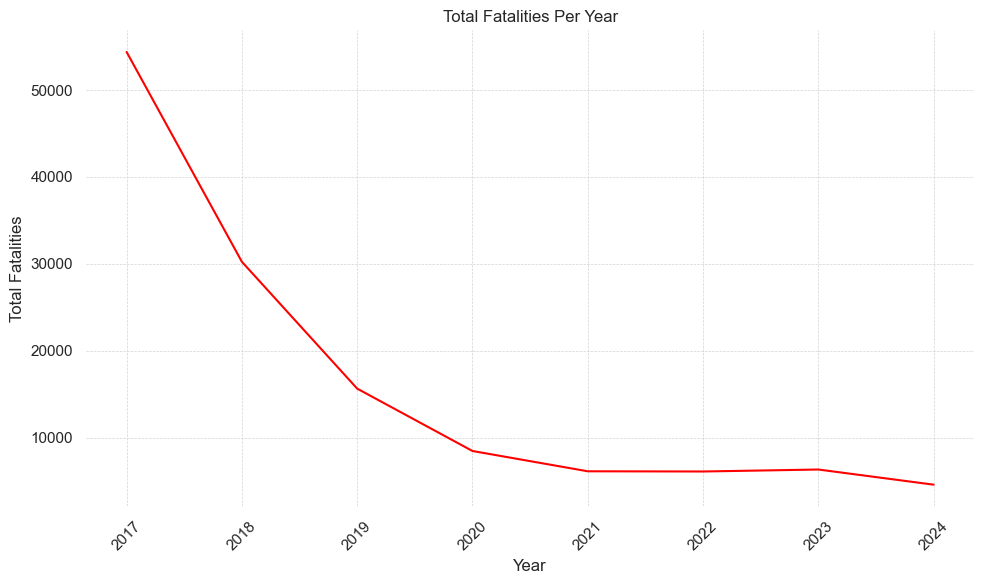
Graph 1 (Aggregate Fatalities by Year): Reflects a steep decline in total fatalities, especially post-2017, suggesting a possible stabilization in conflict-affected areas.
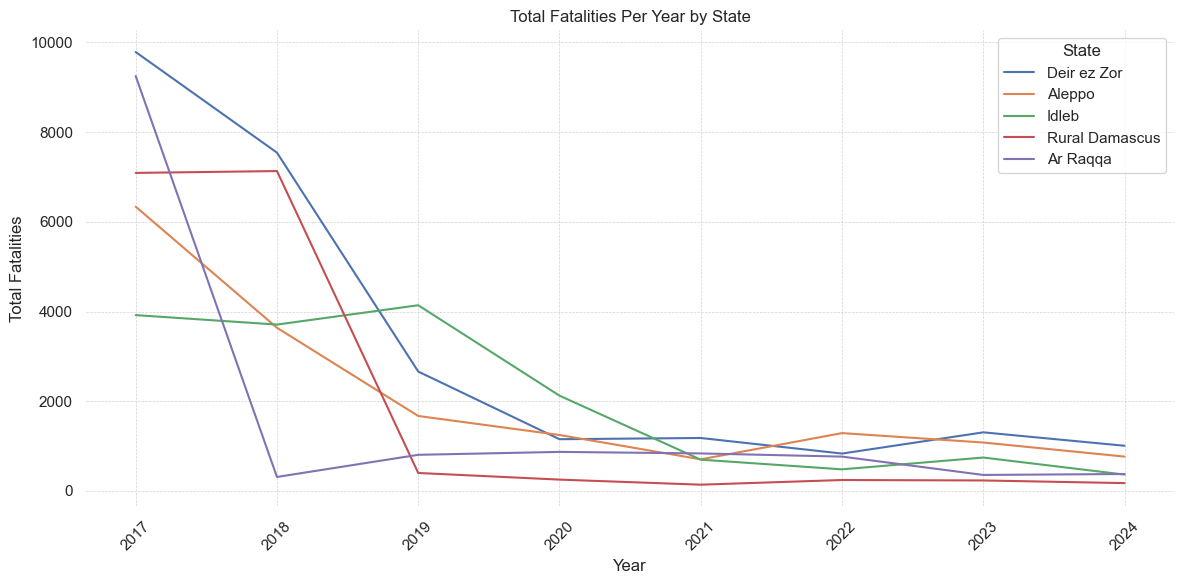
Graph 2 (Fatalities by Year and State): Shows a sharp decline in total fatalities across states from 2017 onward, indicating reduced conflict intensity in recent years.
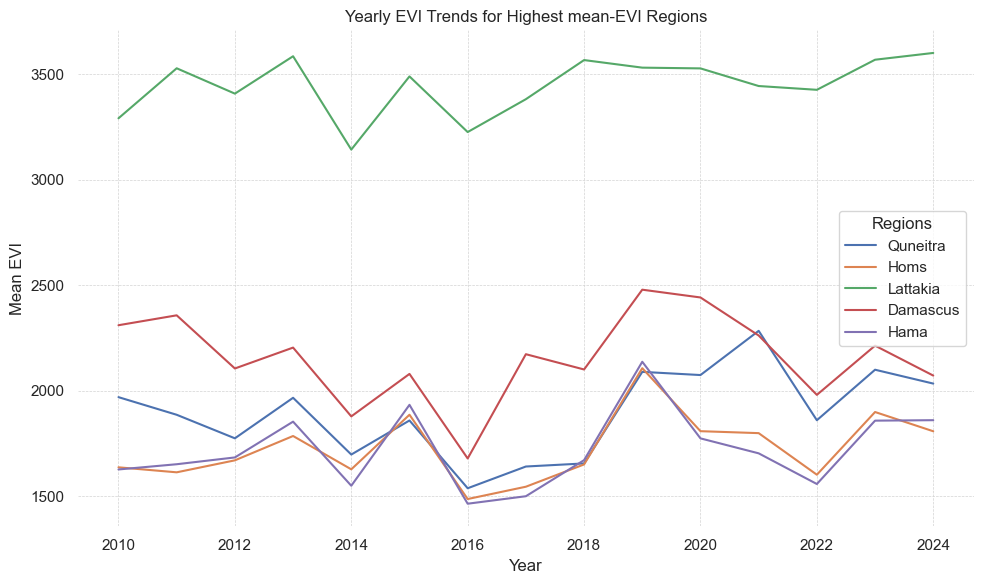
EVI Trends in High Conflict Regions:
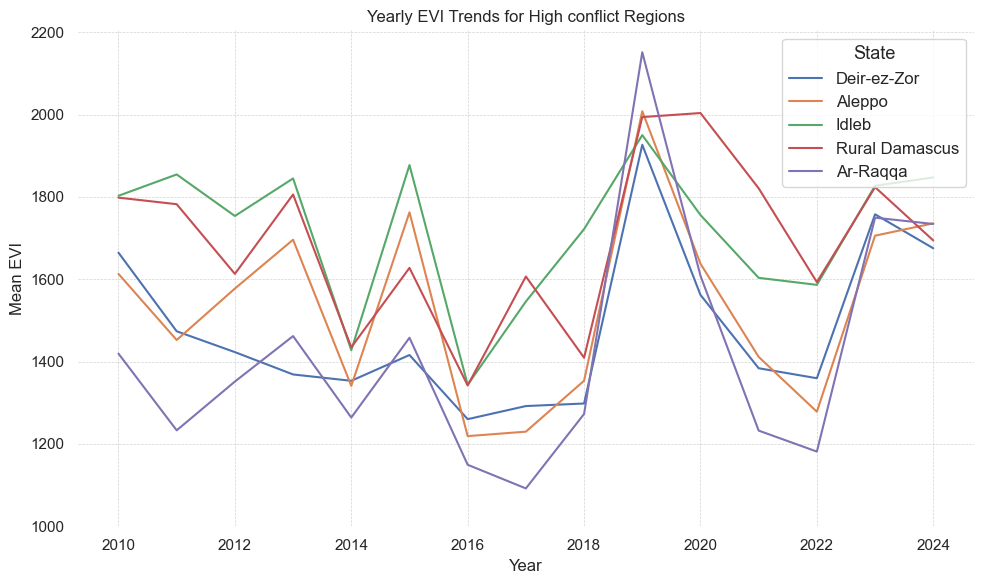
Graph 3 (EVI Trends for High Conflict Regions): Significant variability is observed in EVI values between 2015 and 2020, reflecting disruptions to agricultural activity due to conflict. For instance:
Idleb and Deir-ez-Zor show marked drops in EVI during intense conflict years, suggesting direct impacts of conflict on farming activities. Recovery in EVI values is noticeable post-2020, coinciding with reduced fatalities.
Implication: Conflict in high-intensity regions likely disrupted agricultural systems, leading to lower vegetation indices. Post-conflict stabilization may have allowed recovery in these areas
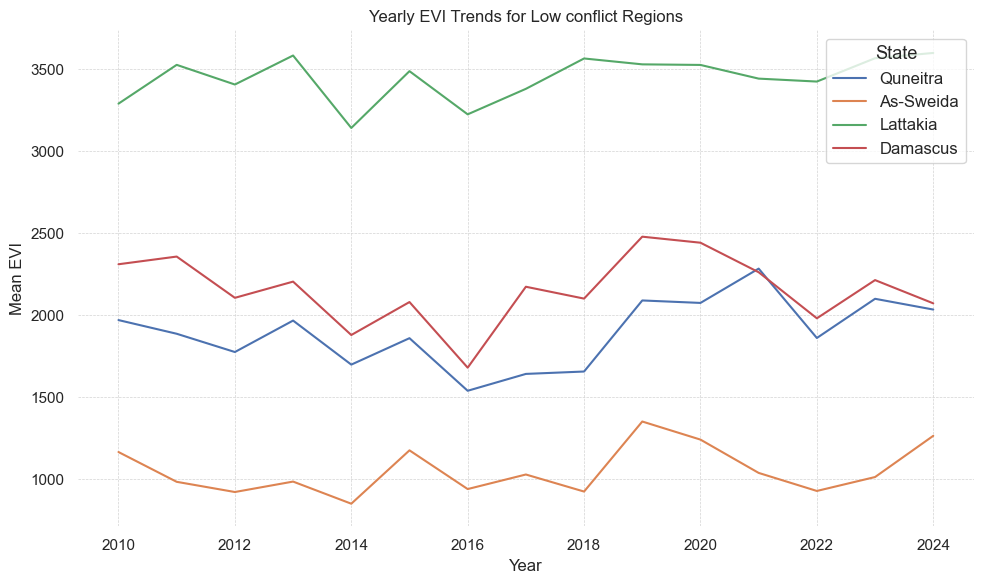
EVI Trends in Low Conflict Regions:
Graph 4 (EVI Trends for Low Conflict Regions): These regions (e.g., Lattakia, Damascus) exhibit relatively stable EVI trends over the years, with minimal disruptions during the conflict period.
Agricultural Anomalies (Z-Score Analysis): The Z-Score Anomalies visual highlights notable drops in agricultural productivity (negative Z-scores) during conflict years (2015-2020). However, years like 2019 show positive anomalies, potentially linked to localized resilience or external support.
Post-2020, the share of areas with severe negative anomalies (<-2 Z-score) diminishes, aligning with reduced conflict intensity.
Conclusion
Conflict Impact: The data and trends suggest that conflict has slight influence on agriculture, particularly in high-intensity regions. Disruptions are evident in reduced EVI values during peak conflict years, these variations may also be a result of environmental parameters. Gradual recovery observed post-2020 but no strong directed pattern observed.
Recovery Potential: The trends in recent years indicate recovery potential, but the pace of recovery may vary depending on local conflict intensity, infrastructure rebuilding, and external support.

