Estimating cross-border movement in Lebanon and Syria through Mobility Data#
This pilot exploratory study seeks to leverage mobility data to estimate the location of activity and, in particular, tentatively estimate the location of formal and informal activity between Lebanon and Syria. The working hypothesis is that by identifying devices seen in the proximity of point of interests, such as border checkpoints, and mapping their mobility traces throughout the time horizon, the movement captured may indicate changes in trade patterns and potentially identify new trade centers and corridors.
The results presented are the stay locations (or “stops”) generated by sub-panels composed of (A) devices seen at 6 border checkpoints and (B) devices seen in the proximity of border, except the 6 checkpoints. The sub-panels aim to estimate “formal” activity” and “informal” activity, respectively.
Data#
The WB Data Lab team obtained a high-frequency longitudinal panel of human mobility. The data consisted of anonymized timestamped geographical points generated by 639,233 GPS-enabled devices, located in Lebanon and Syria and spanning the period of January 1, 2020, to October 15, 2022. The mobility data panel has been provided pro-bono by Outlogic through the proposal Syria Economic Monitor (Outlogic) of the Development Data Partnership.
During the project’s execution, Outlogic Observation Panel’s global daily data feed was ingested and processed through the Mobility pipeline maintained by the Development Data Partnership. As input, the mobility data has been accessed as an Apache Parquet dataset, partitioned on country, year, and date. For additional information, please refer to the Mobility documentation accessible to all World Bank staff.
Methodology#
In this working methodology, we propose to investigate and map the mobility traces of sub-panels (or sub-samples) of devices. The working hypothesis is that by selecting sub-panels of devices based on whether they were detected in the proximity of points of interest (POIs) and reconstructing their mobility traces – in other words, where they went and where they stopped throughout the horizon – the movement captured could suggest trade activity that, more importantly, could be located and quantified if combined with other datasets.
The sampling strategy - convenience sampling, a non-probability form of sampling - is a significant limitation of this approach. Nevertheless, in the face of significant data scarcity in Syria [World Bank, 2022] and thanks to the mobility data’s availability and finer granularity, we propose to utilize and trace the movement of different sub-panels of devices to tentatively identify and pinpoint formal and informal cross-border trade activity. Particularly, we define sub-panels composed of (A) devices seen at six border checkpoints and (B) devices seen in the proximity of border, except the six checkpoints.
We rely on a loose definition of cross-border flows, as “movement of people and goods between regions and between countries” [Kunaka, 2014] that, in this study, is quantified by the number stay locations and by the number of “trips” observed throughout the horizon, according to the methodology described by [Hariharan and Toyama, 2004].
Sampling Strategy#
Devices are drawn out from the mobility data panel to compose sub-panels. The sub-panel composition criterium is whether the device was detected within the proximity of a point of interest at least once throughout the time horizon.
The following are the selected points of interest.
Six official border crossing checkpoints between Lebanon and Syria
Jdeidet Yabbous (Al- Masnaa)
Tartous (Al-Arida)
Al-Dabbousieh (Al- Abboudiyeh)
Tel Kalakh (Al-Buqayaa)
Joussieh (Al-Qaa)
Matraba
Based on the points of interest above, we define the areas of interest below that aim to capture cross-border (A) “formal” activity and (B) “informal” activity along the Lebanese Syrian border.
(A) The area within a 2Km distance of any six official border crossing checkpoints
(B) The area within a 500-meter buffer strip along the Lebanese Syrian border, except (A).
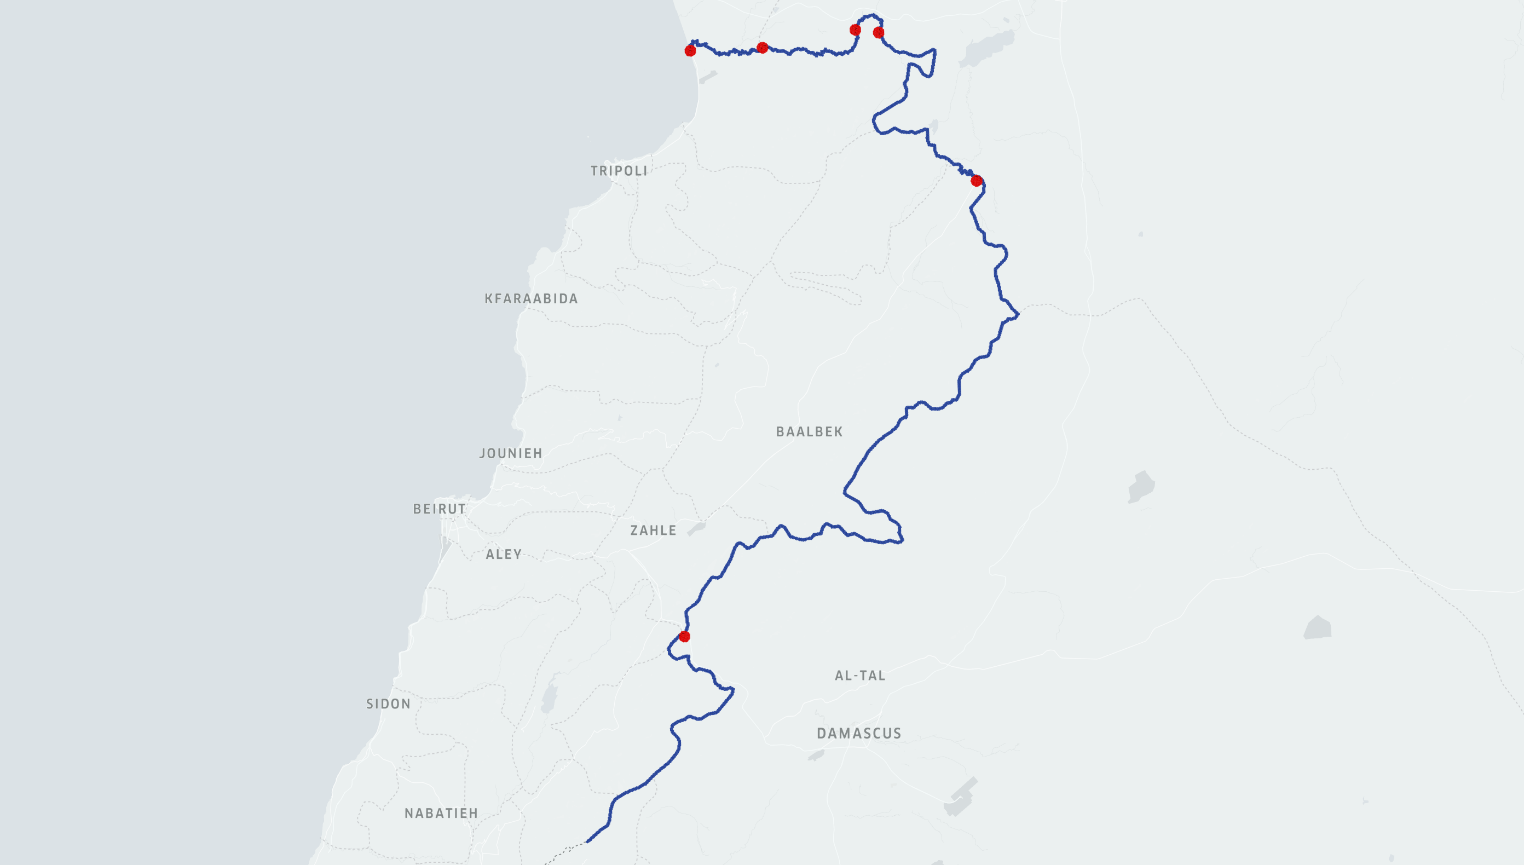
Fig. 11 Areas of Interest A (format) and B (informal): The figure illustrates Region A (red) and Region B (blue).#
Findings#
LB-SY Stay Locations#
The results below are the quarterly number of stay locations (or “stops”) generated by each sub-panel, that can be visualized as an interactive map below.
Fig. 12 This interactive map displays the number of stay locations aggregated quarterly between 2020-Q1 and 2022-Q4 (until October 15) on H3 resolution 10. The stay locations are generated by sub-panels A (“formal”) and B (“informal”).#
LB-SY Movement Corridors#
This interactive map displays the origin-destination flux pairs by governorate or by H3 tiles. The user can choose the region of interest/sub-panel, change color, change date range, filter by origin and destination and filter incoming or outcoming flux from selected.
Formal and Informal Activity#
The working hypothesis is that movement captured within preselected regions of interest, e.g., within the proximity of border checkpoints, could be proportional to trade flows and, thus, could potentially inform the dynamics of population movement and trade corridors, in the absence of other data sources.
“Activity” is defined as the number of stay locations generated by sub-panels of devices based on whether they were detected at least once in the proximity of points-of-interest through the time horizon. We approximate formal activity based on the stay locations generated by the sub-panel of devices seen within a 2Km distance from border checkpoints and informal activity based on the stay locations generated by the sub-panel of devices seen within a 500-meter border strip between Lebanon and Syria, excluding official border checkpoints.
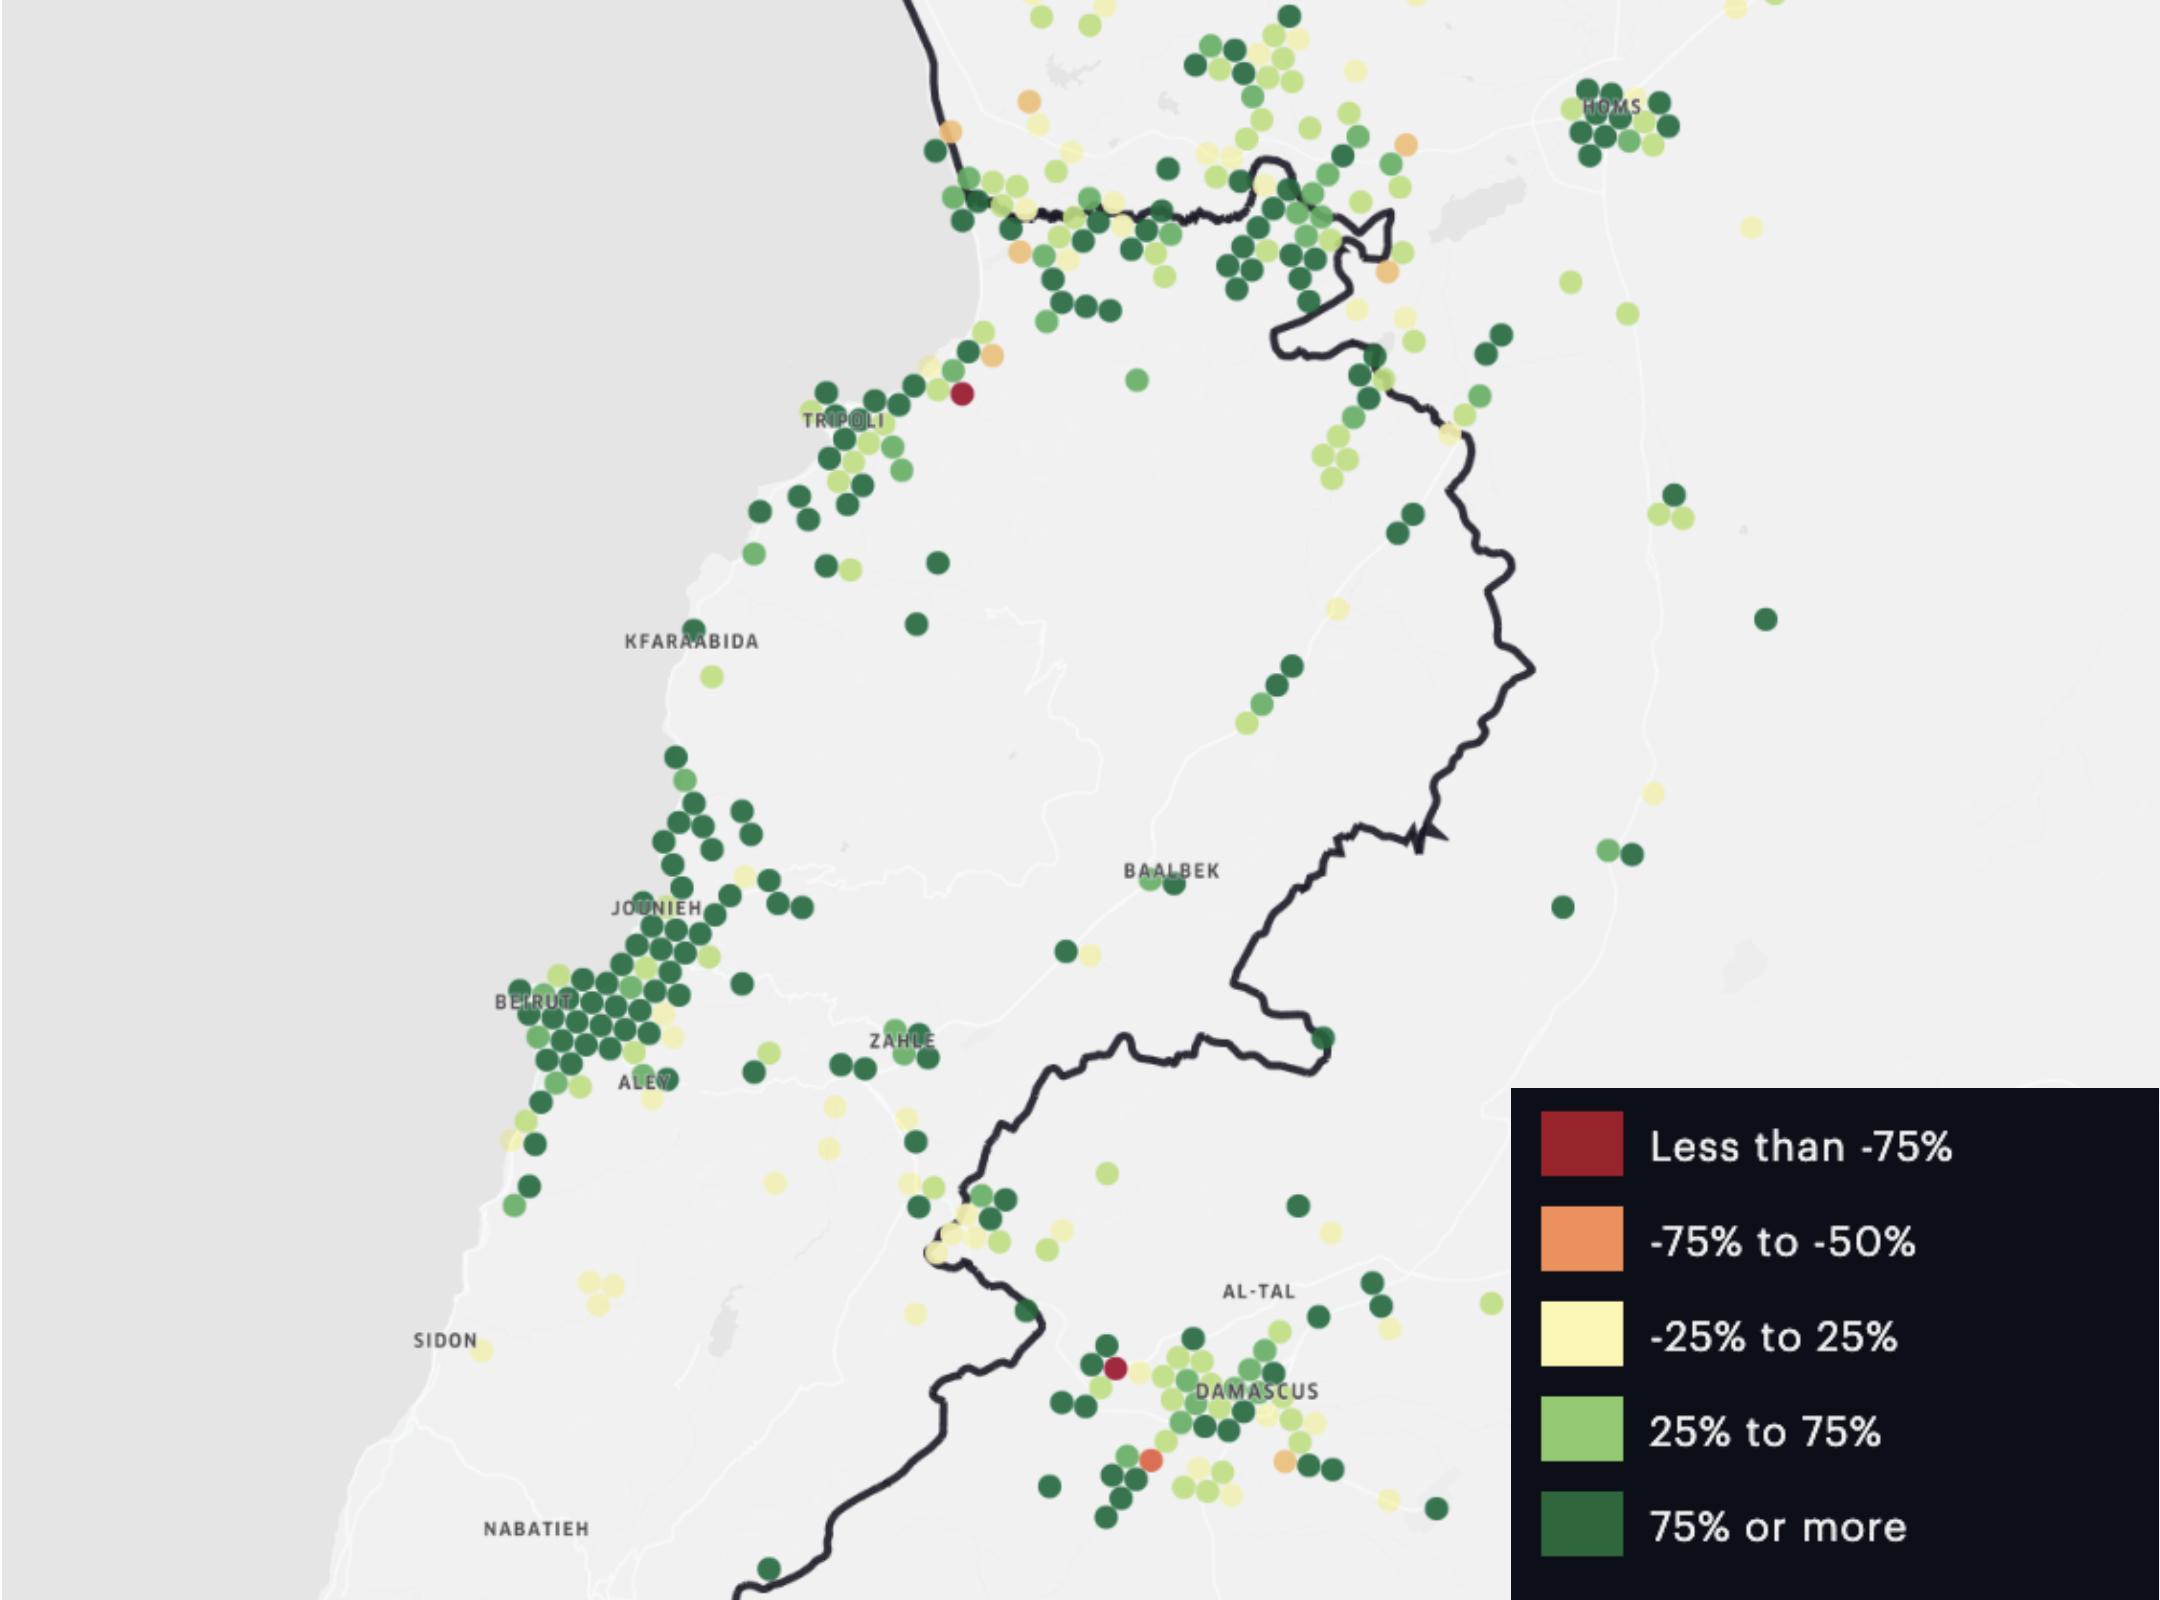
Fig. 13 Change in informal activity in Apr-Jul 2021 compared to Dec-Mar 2021: The figure is a snapshot of the change in informal activity in Apr-Jul 2021 (the optimal smuggling period) compared to Dec 2020-Mar 2021. In red, 75 percent or more decrease in informal activity; in green, areas with a 75 percent or more increase.#
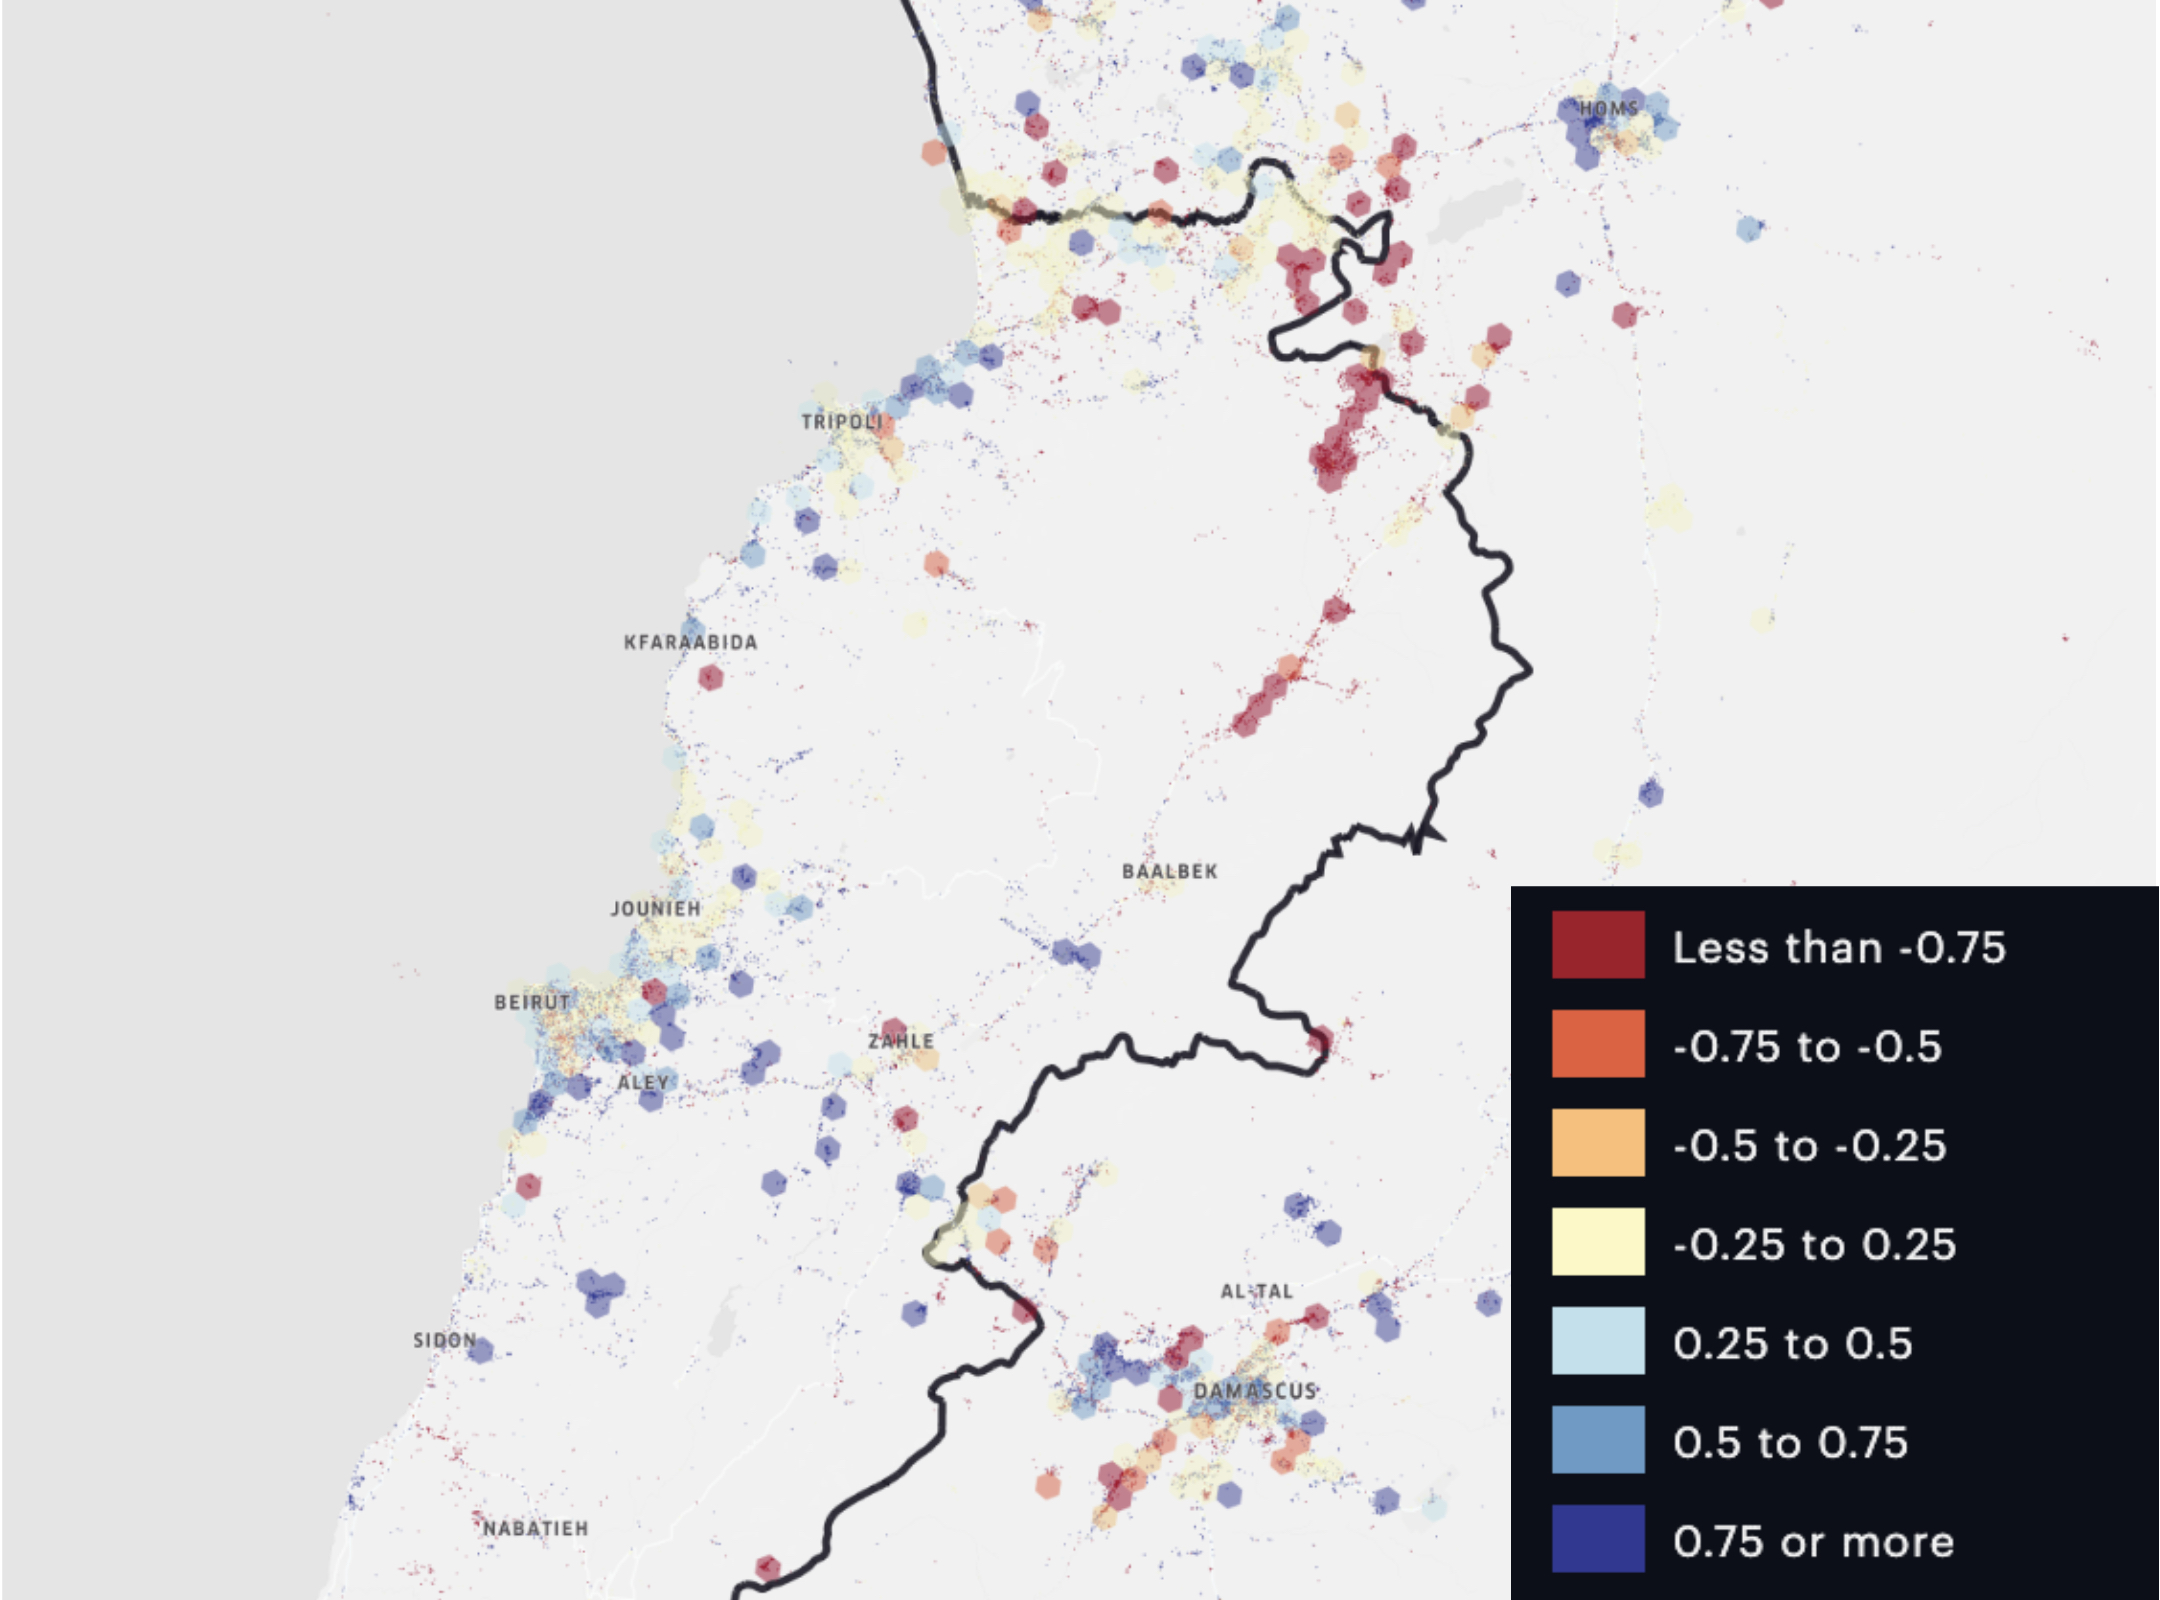
Fig. 14 Normalized difference between formal and informal activity in Apr-Jul 2021: The image presents a snapshot map of the sub-panels’ activity. The activity index is a normalized difference between the formal and informal sub-panels and ranges from –1 to 1 (informal to formal). For instance, an activity index of –0.5 indicates that informal sub-panel’s devices were 3 times as many as the formal sub-panel’s devices within an area.#
Point-in-time Comparison#
Using the interactive maps, the results can be easily filtered and regrouped. For instance, it may be relevant to explore point-in-time comparisons. or example, selecting panel A and comparing 2020 Q1 and 2020 Q4, a significant reduction in movement can be identified.
The analysis of mobile location data suggests that informal movement has been consistently observed, especially around Joussieh (Al-Qaa) and Jdeidet Yabbous (Al- Masnaa) (quarterly, between 2020-2022).
Limitations#
The methodology relies on private intent data in the form of mobile location data. In other words, the input data was not produced or collected to analyze the population of interest or address the research question as its primary goal but repurposed for the public good. The benefits and caveats when using private intent data have been extensively discussed in the World Development Report 2021 [World Bank, 2021]. On the one hand, the mobility data panel is spatially and temporally granular and readily available, on the other hand it is created as a convenience sampling which constitutes an important source of bias. The panel composition is not entirely known and susceptible to change, the data collection and the composition of the mobility data panel cannot be controlled. For example, Outlogic has reported a significant data reduction since April 30, 2022, which impacted the panel composition.
A significant limitation is that the methodology is based on convenience sampling, which is a non-probabilistic sampling method. One of the criticisms of convenience sampling is that the results are not easily generalizable to the entire population. It is important to emphasize that in the current implementation, no treatment regarding the origin-destination or transportation mode is in place. In other words, we consider all trips not only trips that are border crossings. The idea was to select devices based on where they were seen once and map their mobility traces - where they went and where they stopped.
In summary, the results cannot be interpreted to generalize the entirety of population movement but can potentially provide information on movement panels to inform Syrian economic situation, considering time constraints and the scarcity of traditional data sources in the context of Syria.
Caution
Here are some limitations associated with mobility data:
Limitations:
Sampling Bias: Mobility data is primarily collected through convenience sampling and lacks the controlled methodology of randomized trials.
Selection Bias: Users who opt to share their mobility data may not be representative of the entire population, potentially introducing selection bias.
Privacy Concerns: The collection of mobility data may raise privacy issues, as it can sometimes be linked to individuals, potentially violating their privacy.
Data Quality: Data quality can vary, and errors, inaccuracies, or missing data points may be present, which can affect the reliability of analyses.
Temporal and Spatial Resolution: Mobility data may not capture all movements or may lack fine-grained temporal or spatial resolution, limiting its utility for some applications.
Lack of Contextual Information: Mobility data primarily captures movement patterns and geolocation information. It may lack other crucial contextual information, such as transactional data, business types, or specific economic activities, which are essential for accurate estimation of economic activity.
References#
- HT04
Ramaswamy Hariharan and Kentaro Toyama. Project Lachesis: Parsing and Modeling Location Histories. In Geographic Information Science. Volume 3234, volume 3234, 106–124. 2004. doi:10.1007/978-3-540-30231-5_8.
- Kun14
Robin Kunaka, Charles; Carruthers. Trade and Transport Corridor Management Toolkit. World Bank Training, World Bank, 2014. License: CC BY 3.0 IGO. URL: http://hdl.handle.net/10986/18241.
- WorldBank21
World Bank. World Development Report 2021 : Data for Better Lives. World Bank, 2021. License: CC BY 3.0 IGO. URL: http://hdl.handle.net/10986/35218.
- WorldBank22
World Bank. Syria Economic Monitor - Spring 2022 : Lost Generation of Syrians. Economic Updates and Modeling, World Bank, 2022. License: CC BY 3.0 IGO. URL: http://hdl.handle.net/10986/37617.