Computing Stay Locations#
In this notebook, we estimate stay locations as described in the methodological notes of this pilot study using scikit-mobility.
Data#
Mobility Data#
In this step, we import the filtered down panel of longitudinal location data generated by devices identified within the proximity of the Area of Interest.
PATH = [
    f"../../data/interim/panels/{NAME}",
]

filters = [
    ("year", "=", YEAR),
    ("quarter", "=", QUARTER),
]
Reading with Dask,
ddf = dd.read_parquet(PATH, filters=filters)
Now, let’s convert to a pandas.DataFrame and store in memory.
df = ddf.compute()
Finally, the number of observations,
3241357
Trajectory Analysis#
Creating skmob.TrajDataFrame#
In this step, we leverage scikit-mobility, including its built-in data structures skmob.TrajDataFrame and skmob.FlowDataFrame to analyse the mobile location data.
tdf = skmob.TrajDataFrame(
    df, latitude="latitude", longitude="longitude", datetime="datetime", user_id="uid"
)
len(tdf)
3241357
Filtering#
In this step, we filter and compress the mobile location data to reduce complexity.
ftdf = filtering.filter(tdf, max_speed_kmh=250.0)
Stay Locations#
stdf = detection.stay_locations(
    ftdf,
    stop_radius_factor=0.5,
    minutes_for_a_stop=20.0,
    spatial_radius_km=0.2,
    leaving_time=True,
)
See also
Clustering#
cstdf = clustering.cluster(stdf, cluster_radius_km=0.1, min_samples=1)
Visualizing#
Stay Locations#
cstdf.plot_stops(max_users=10)
Next, we aggregate the stay locations using the H3 geospatial indexing system.
gdf = cstdf.to_geodataframe()
gdf["hexid"] = gdf.apply(lambda x: h3.geo_to_h3(x["lng"], x["lat"], 7), axis="columns")
Aggregating on hexid and counting the number of stay location within the corresponding hexagon.
count = gdf.groupby(["hexid"])["uid"].count().to_frame("count")

count["geometry"] = count.index.to_series().apply(
    lambda x: Polygon(h3.h3_to_geo_boundary(x))
)
Visualizing,
geopandas.GeoDataFrame(
    count,
    geometry="geometry",
    crs="EPSG:4326",
).explore("count", cmap="cividis", scheme="Percentiles")
Trajectories#
We identify the device with the longest travelled distance to visualize and illustrate its trajectory.
dsl_df = distance_straight_line(cstdf)
100%|████████████████████████████████████████| 176/176 [00:00<00:00, 604.16it/s]
user = dsl_df.sort_values("distance_straight_line").iloc[-1]["uid"]
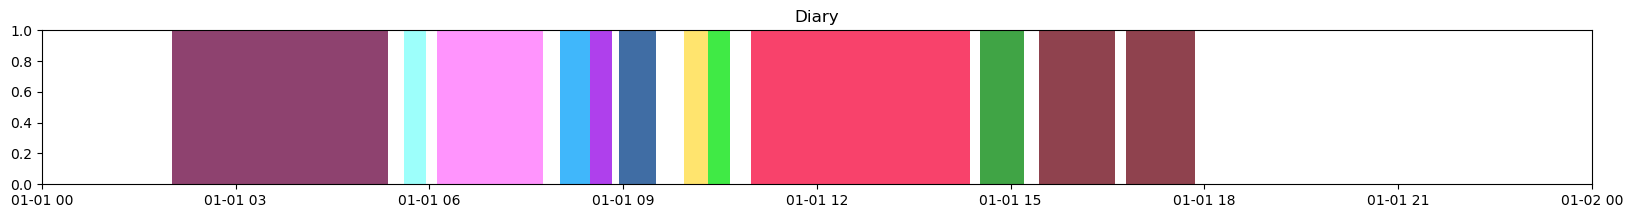
start_datetime = pd.Timestamp("2022-01-01 00:00:00", tz="Asia/Damascus")
end_datetime = pd.Timestamp("2022-01-02 00:00:00", tz="Asia/Damascus")

ax = cstdf.plot_diary(user, start_datetime, end_datetime)
ax.set_title("Diary")
Text(0.5, 1.0, 'Diary')