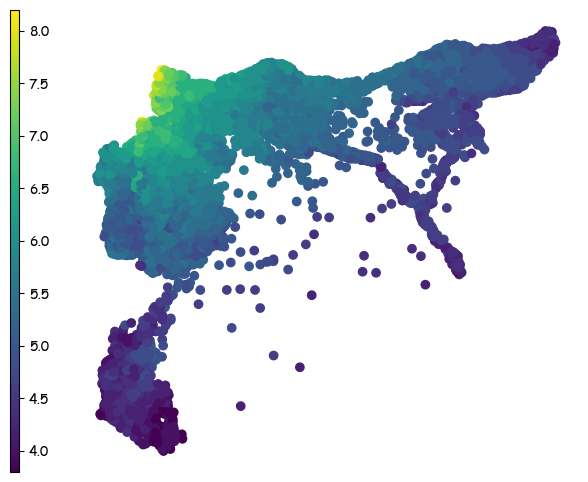
Earthquake Intensity Map of Syria#
Earthquake Intensity Data was obtained from version 15 from USGS and was overlayed with shapefiles of Turkey admin 2 region taken from UNOCHA. This can be used as a baseline map upon which other indicators can be visualized.
Show code cell source
fig, ax = plt.subplots(figsize=(12, 6))
plt.rcParams["font.family"] = "cursive"
gdf.plot(column="max_intensity_feb06", cmap="viridis", ax=ax)
# turkey_adm2.boundary.plot(ax=ax, edgecolor = '#D3D3D3', linewidth=0.5)
ax.spines["top"].set_visible(False)
ax.spines["bottom"].set_visible(False)
ax.spines["right"].set_visible(False)
ax.spines["left"].set_visible(False)
ax.set_xticks([])
ax.set_yticks([])
vmin = gdf["max_intensity_feb06"].min()
vmax = gdf["max_intensity_feb06"].max()
sm = plt.cm.ScalarMappable(cmap="viridis", norm=plt.Normalize(vmin=vmin, vmax=vmax))
divider = make_axes_locatable(ax)
dvider_kwargs = dict(position="left", size="1.5%", pad=0)
fig.colorbar(
sm,
cax=divider.append_axes(**dvider_kwargs),
# format = matplotlib.ticker.FuncFormatter(lambda x, pos: ''),
# ticks = matplotlib.ticker.FixedLocator([])
)
# plt.savefig('../images/final_check_in/01_earthquake_intensity_feb6.png')
<matplotlib.colorbar.Colorbar at 0x1d46f118fd0>
