Nighttime Lights#
Nighttime lights have become a commonly used resource to estimate changes in local economic activity. This section shows where nighttime lights are concentrated across Syria and observed changes over time.
Data#
We use nighttime lights data from the VIIRS Black Marble dataset. Raw nighttime lights data requires correction due to cloud cover and stray light, such as lunar light. The Black Marble dataset applies advanced algorithms to correct raw nighttime light values and calibrate data so that trends in lights over time can be meaningfully analyzed. From VIIRS Black Marble, we use monthly data from January 2012 through August 2022—where data is available at a 500-meter resolution.
For more information, please refer to datasets.
Methodology#
In the analysis, we distinguish lights between lights observed in gas flaring locations and lights in other locations. Oil extraction and production involves gas flaring, which produces significant volumes of light. Separately examining lights in gas flaring and other locations allows distinguishing between lights generated due to oil production versus other sources of human activity. We use data on the locations of gas flaring sites from the Global Gas Flaring Reduction Partnership; we remove lights within 5km of gas flaring sites.
Implementation#
Code to replicate the analysis can be found here.
The main script (_main.R) loads all packages and runs all scripts for the analysis. There are separate scripts for processing the data (e.g., downloading and cleaning Black Marble data), and separate scripts to produce each of the figures (e.g., producing maps showing changes in nighttime lights).
Data for the analysis can be downloaded from:
Black Marble Nighttime Lights: There are two options to access the data:
The code here downloads raw data from the NASA archive and processes the data for Syria—mosaicing raster tiles together to cover Syria. Running the code requires a NASA bearer token; the documentation here describes how to obtain a token.
Pre-processed data can be downloaded from here, using the Night Time Lights BlackMarble Data
Findings#
The below figure shows nighttime lights from the latest month available. As expected, Syria’s largest cities are the most brightly lit – including Damascus in the southwest and Aleppo in the northwest.
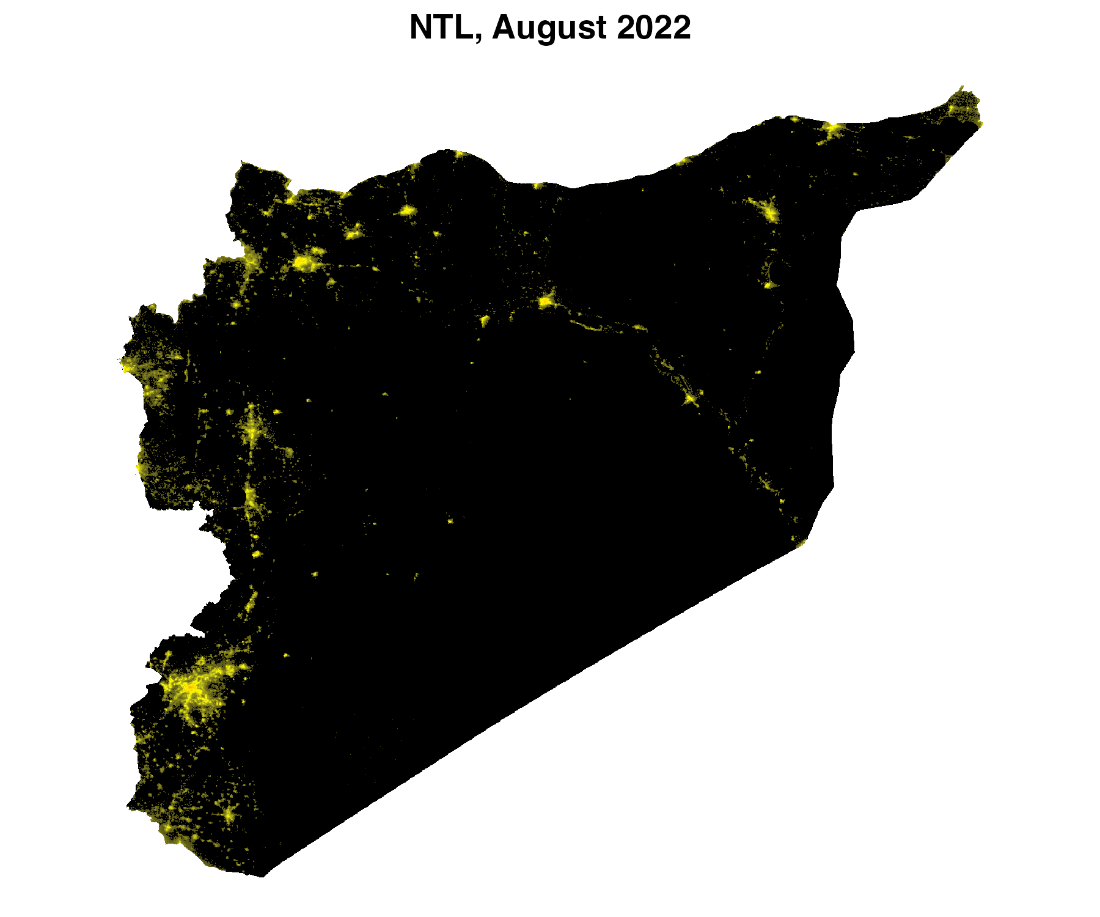
Fig. 15 Nighttime lights in August 2022#
The below figure shows changes in nighttime lights. Many 500-meter pixels see some, even negligibly small, levels and changes of nighttime lights. Consequently, we consider pixels with a luminosity value under one to be noise (in Syria, nighttime lights goes up to 18,500, with a median value of lit pixels of 10). Specifically, in the below figure, pixels with “lights lost” saw a loss of 1 or more luminosity, pixels “new lights” saw a gain of 1 or more luminosity, and pixels with “no change” had a nighttime lights value in both years. The figure shows notable reductions in nighttime lights in Syria’s western regions, with gains in nighttime lights in populated places throughout Syria’s east.
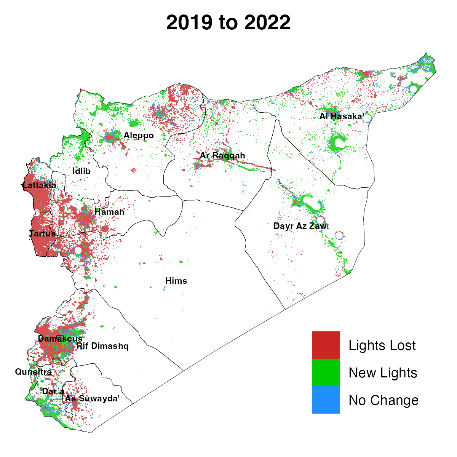
Fig. 16 Change in nighttime lights; locations with flaring removed.#
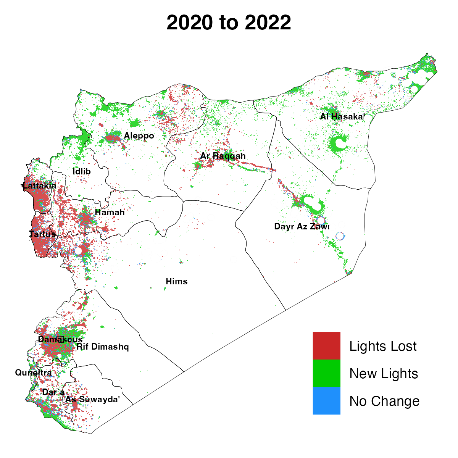
Fig. 17 Change in nighttime lights; locations with flaring removed.#
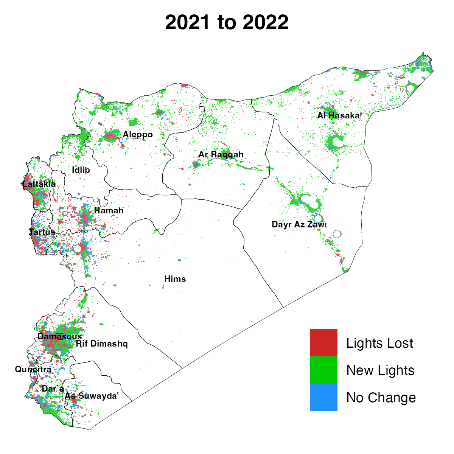
Fig. 18 Change in nighttime lights; locations with flaring removed.#
The below figure shows trends in nighttime lights across Syria’s 14 governorates. We show trends considering (1) all nighttime lights, (2) lights just in locations with gas flaring (oil extraction locations), and (3) nighttime lights with gas flaring locations removed. The figure shows notable reductions in nighttime lights across provinces from 2012 to 2014—reflecting a reduction in economic activity resulting from Syria’s civil war. Lights in gas flare locations have increased starting around 2018—suggesting an acceleration of oil extraction in recent years. For the most part, gains in nighttime lights have been concentrated in gas flaring locations. When removing gas flares, trends in nighttime lights appear relatively stable from 2014 through present.
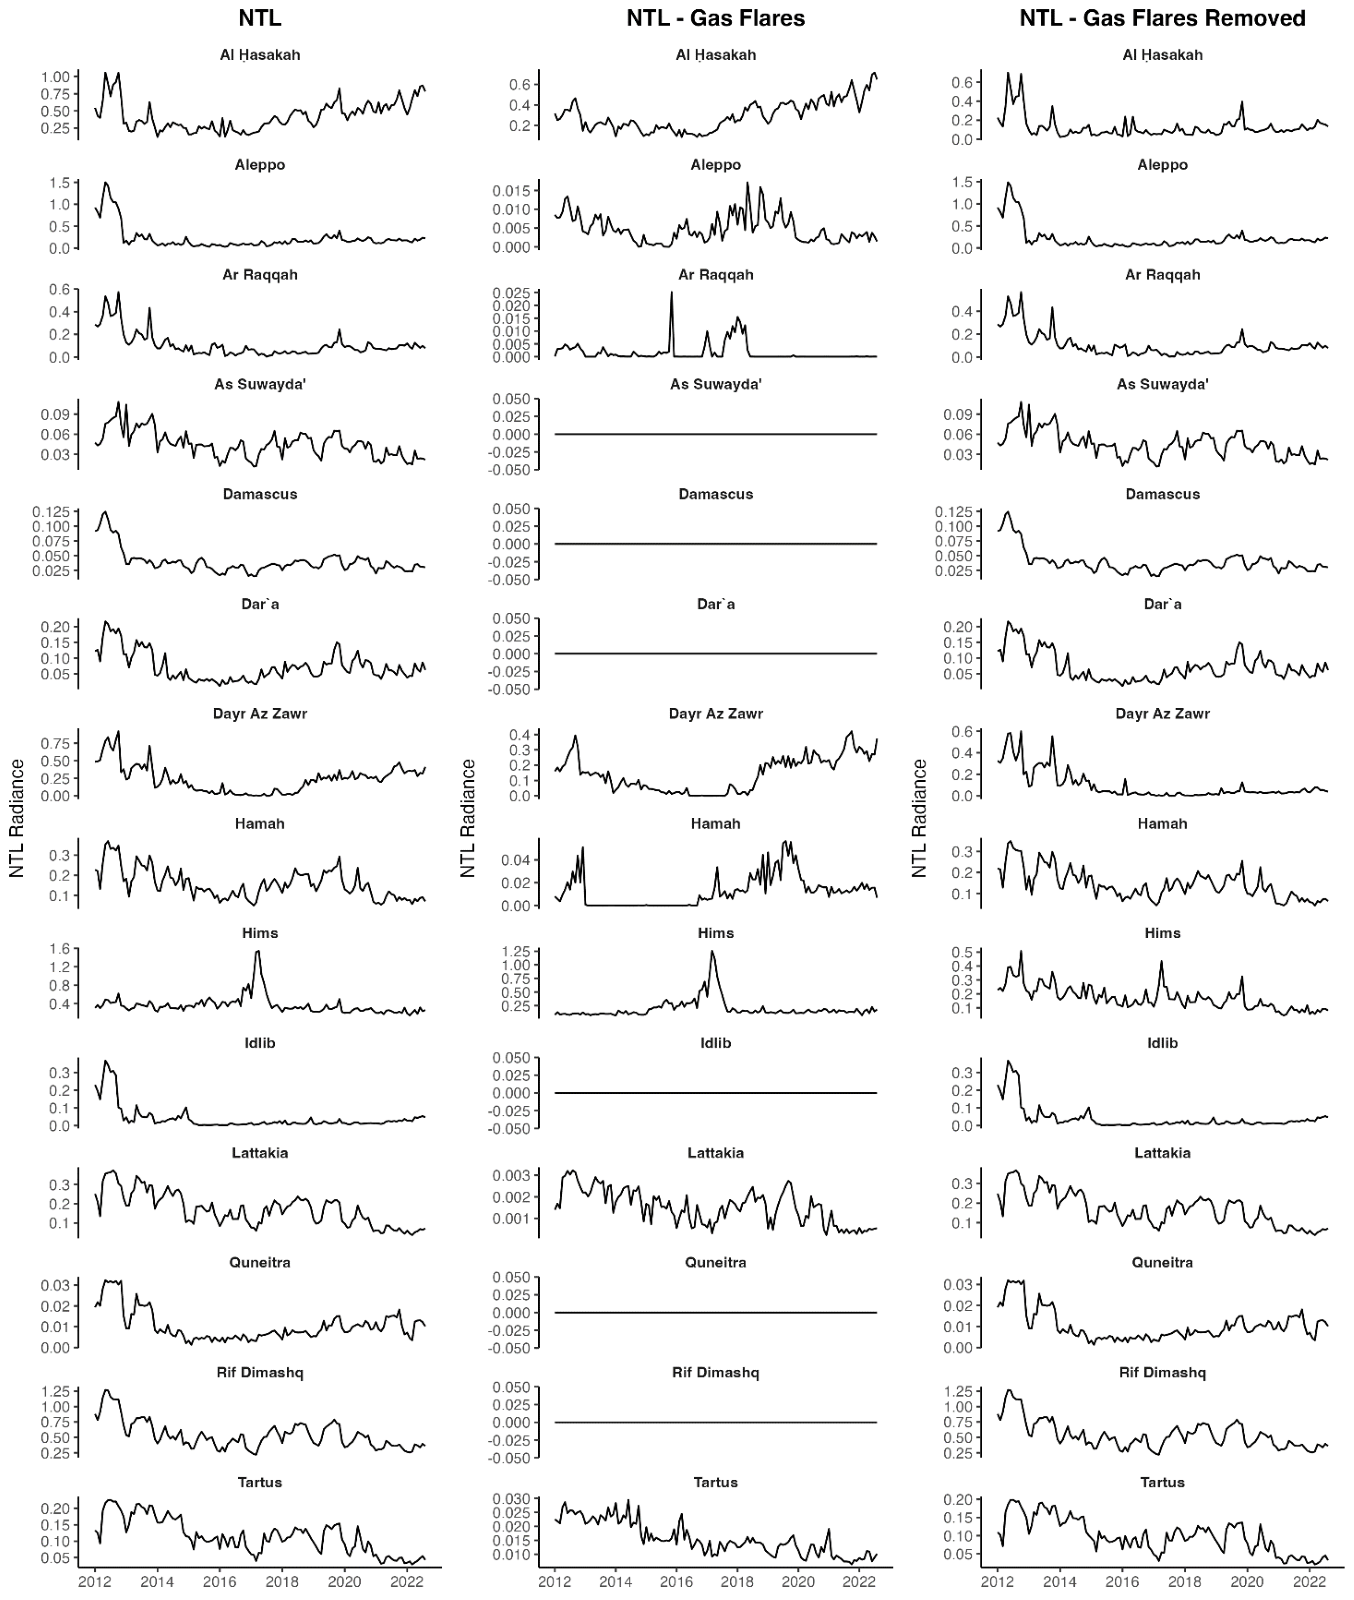
Fig. 19 Change in nighttime lights; locations with flaring removed.#
Limitations#
Nighttime lights are a common data source for measuring local economic activity. However, it is a proxy that is strongly—although imperfectly—correlated with measures of interest, such as population, local GDP, and wealth. Consequently, care must be taken in interpreting reasons for changes in lights.
Next Steps#
Next steps can focus on (1) relating nighttime lights to other data sources and (2) focusing on changes in nighttime lights in specific locations. Nighttime lights can be linked to violent events to understand how changes in violence relate to nighttime lights. In addition, lights in gas flaring locations can be linked to trends in oil extraction—to better understand the extent to which nighttime lights can be used to reliably capture trends in oil production.
The above analysis shows trends in changes at the province level. As nighttime lights are available at a 500-meter resolution, trends can be examined at more granular locations. For example, instead of examining trends in the province of Aleppo, trends in lights around the city of Aleppo can be observed.