Tracking Dam Construction using Synthetic Aperture Radar Data (SAR)#
Synthetic Aperture Radar (SAR) is a type of remote sensing technology that uses radar signals, rather than visible light, to observe the Earth’s surface from satellites. Unlike conventional optical satellites that rely on sunlight and can be blocked by clouds, rain, or darkness, SAR actively emits its own microwave signals toward the ground and records what bounces back. This makes it an all-weather, day-and-night imaging system capable of penetrating cloud cover entirely.
Data Description
When the radar signal strikes the Earth’s surface, a portion of that energy is reflected back to the satellite. The strength of this returned signal is called backscatter intensity. It essentially tells us how “reflective” a surface is to radar energy. Different surfaces return the signal with very different strengths. Smooth, flat surfaces such as calm water tend to reflect the radar signal away from the satellite, resulting in low backscatter, appearing dark in SAR imagery. Rough or structured surfaces, such as buildings, dense vegetation, or disturbed soil, scatter energy back strongly, appearing bright. This contrast allows analysts to detect and track changes on the ground, such as land clearing, flooding, or construction activity, by observing shifts in backscatter intensity over time.
We chose the VV polarization (where both the transmitted and received signal are vertically oriented) because its particularly sensitive to surface roughness, structural features, and changes in ground conditions, characteristics that are highly relevant when monitoring construction activity, ground displacement, or changes in water body extent around a dam site.
For the analysis, we made some choices in terms of band and orbit selection:
SAR is a side-looking sensor. If data from both Ascending (South to North) and Descending (North to South) orbits are mixed, the satellite views the target from opposite angles. In steep river valleys, this alternating geometry creates severe “sawtooth” noise in the time series due to changing radar layover and shadow effects. By restricting the data strictly to the Ascending pass, we locked the viewing angle, ensuring that any variation in backscatter intensity was caused by physical changes on the ground rather than changes in the sensor’s perspective.
Vertical transmit and Vertical receive (VV) polarization was selected over VH (Vertical-Horizontal) or cross-polarization. VV is generally more sensitive to surface scattering and vertical geometries, making it the optimal choice for detecting the hard, angular surfaces of dam walls, spillways, and heavy construction equipment.
Methodology
This analysis uses an STL (Seasonal-Trend decomposition using Loess) decomposition model to identify a time-series trend of change in construction activity in dams in Myanmar. The decomposition of the ‘backscatter intensity’ defined above looks like this -
Yₜ = Tₜ + Sₜ + Rₜ
Rather than analyzing individual satellite passes (which occur every 6 to 12 days), the time series was aggregated into Monthly Median Composites for two reasons:
Speckle and Transient Noise Reduction: Raw SAR images contain inherent granular noise known as “speckle.” Additionally, active construction sites feature transient high-reflectance targets (e.g., moving cranes, temporary scaffolding, or parked trucks). Taking the median value of all passes within a calendar month effectively filters out these temporary anomalies, leaving only the stable, permanent structural changes.
Computational Efficiency: Aggregating to monthly medians drastically reduced the data volume, preventing memory timeouts during cloud-based processing while preserving the macro-level timeline of the multi-year construction project.
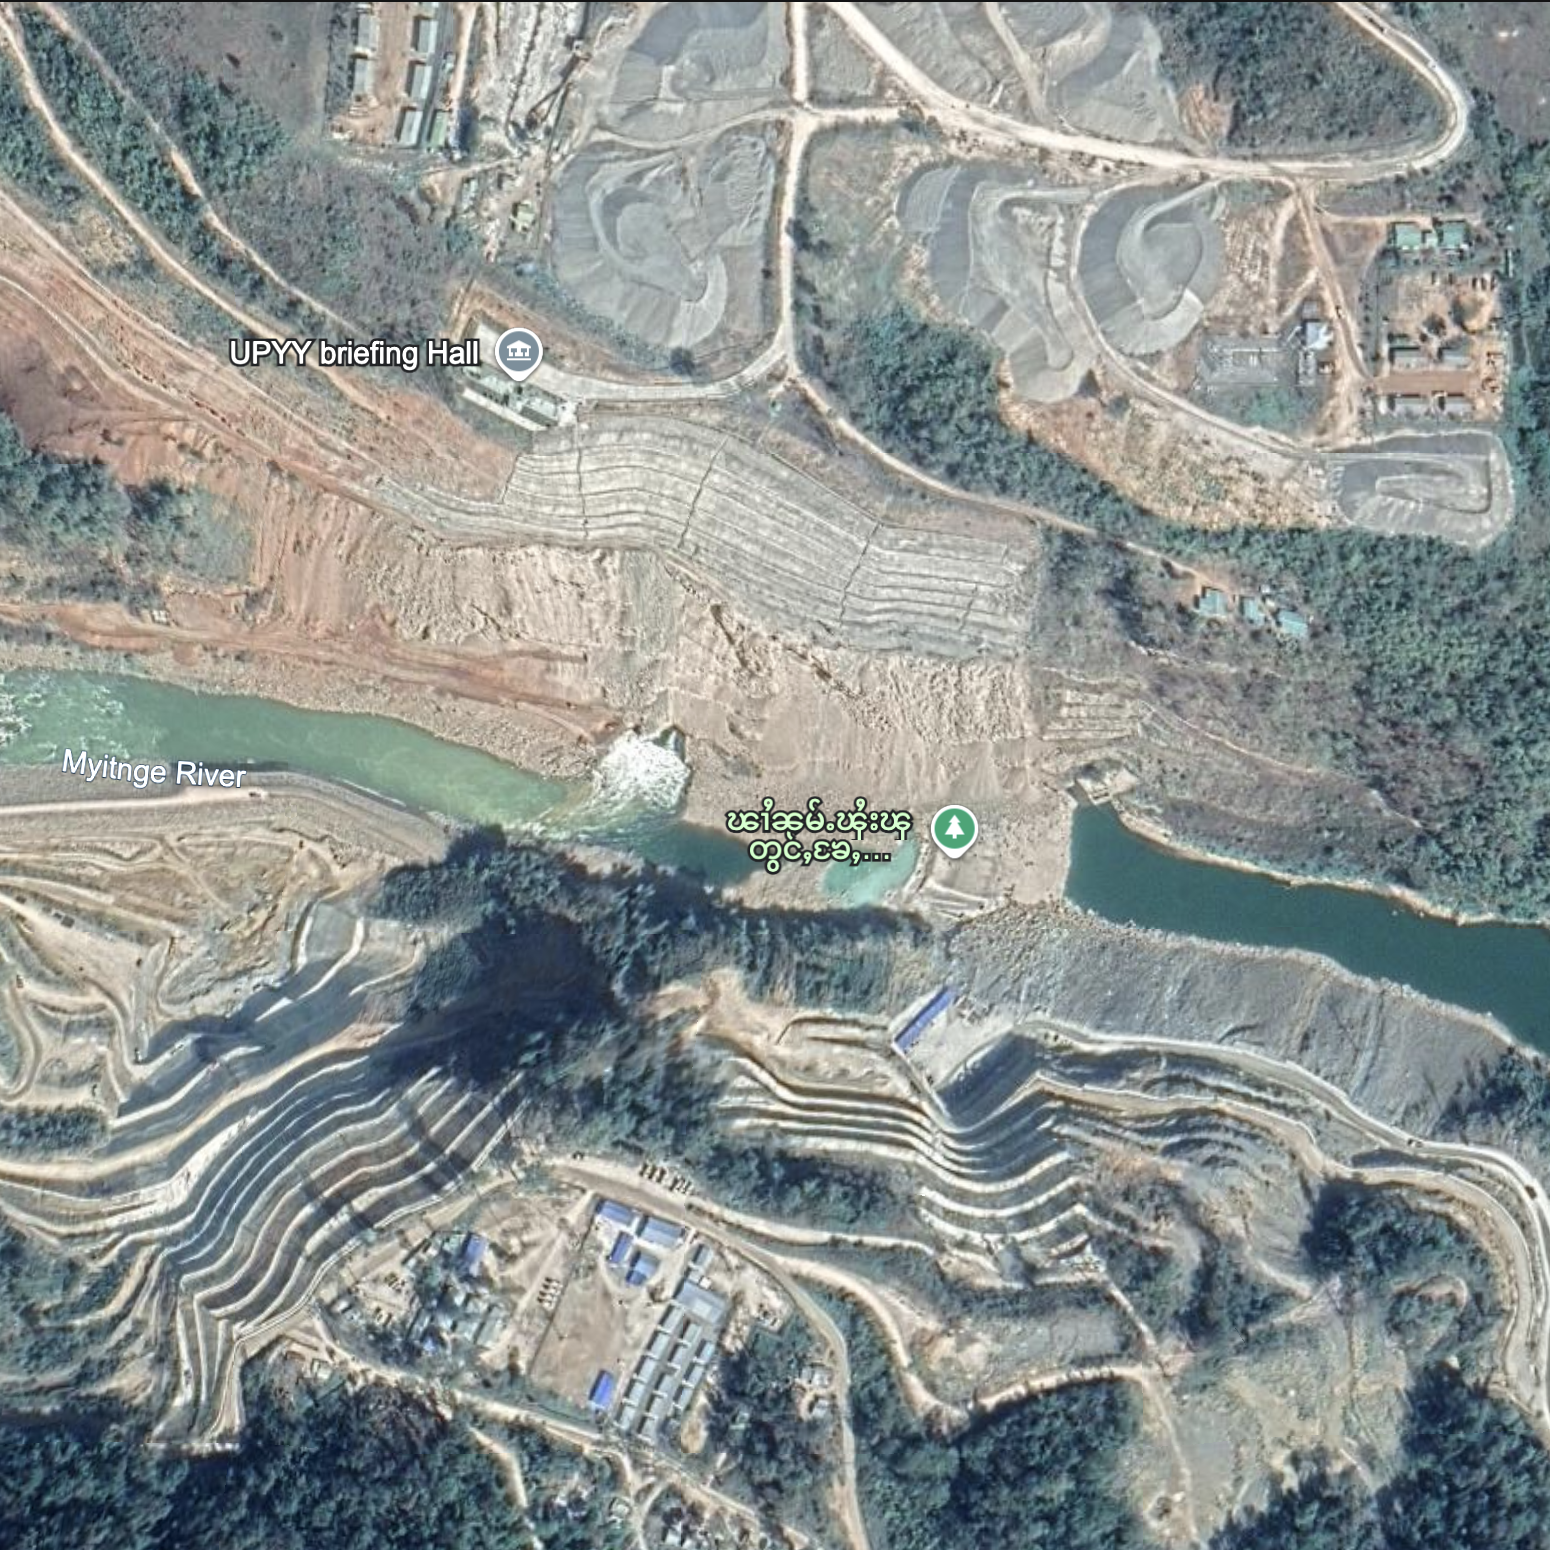
Upper Yeywa Hydropower Project#
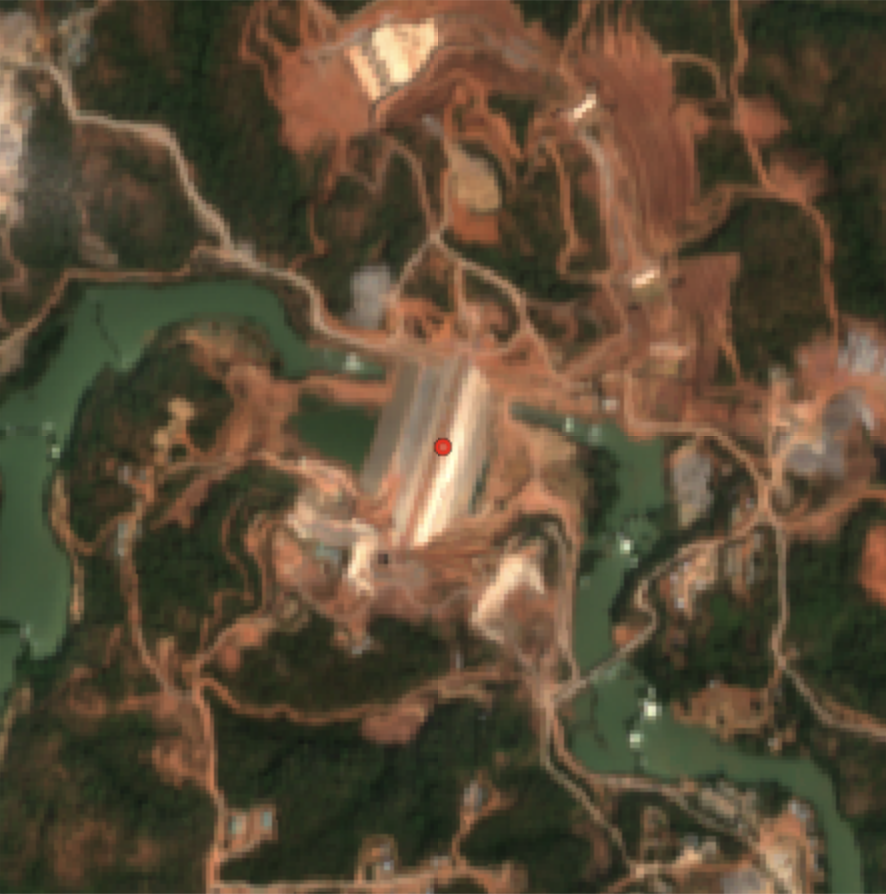
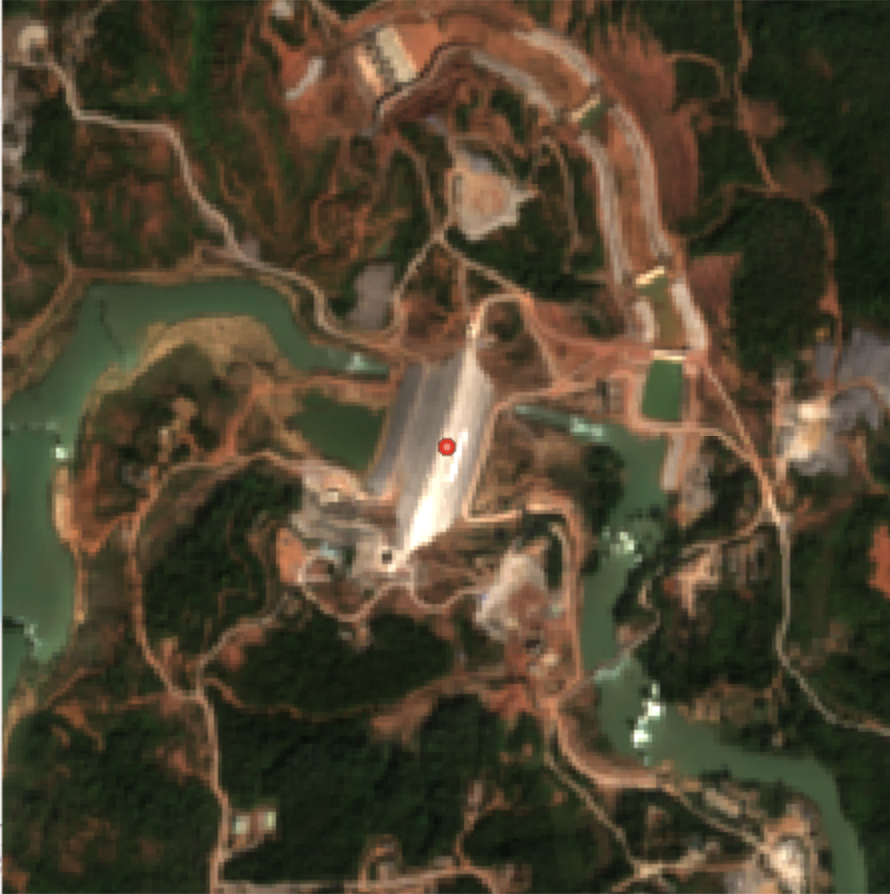
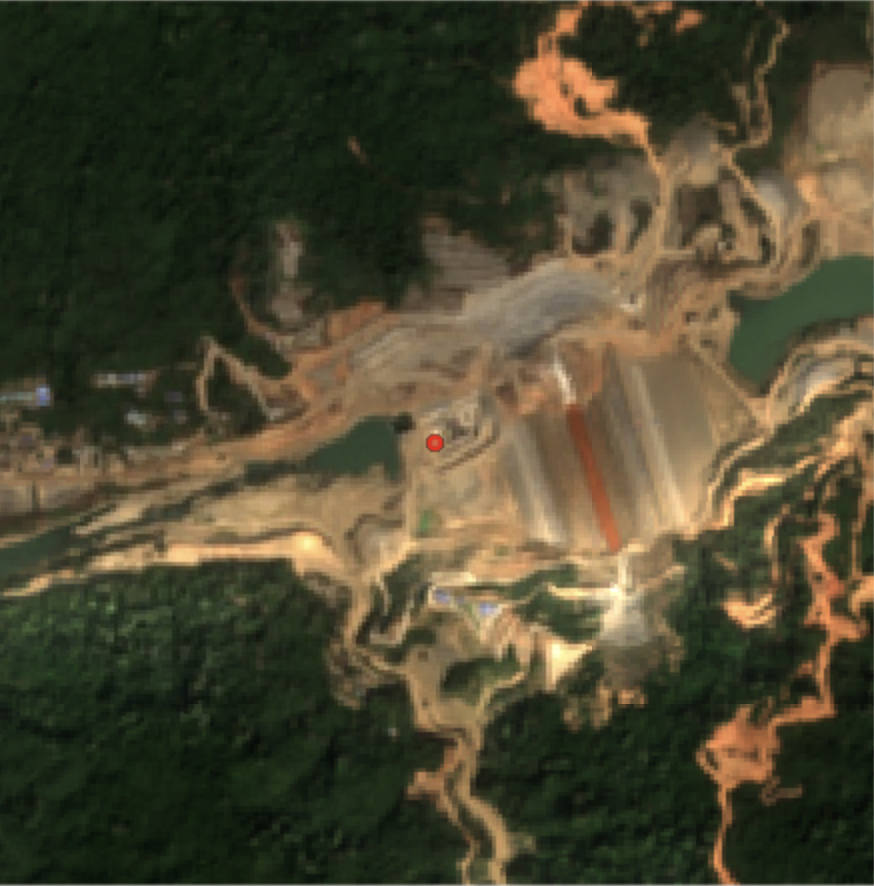
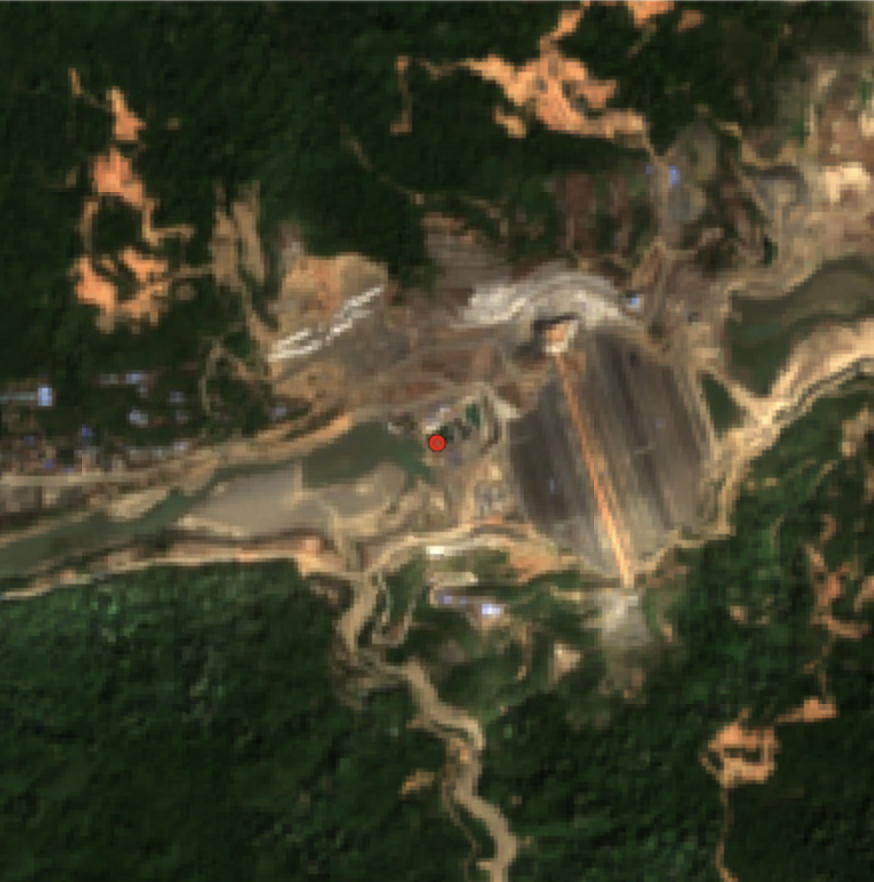
The red dot on these images indicates the location of the dam considered for the analysis. We add a 150m buffer around this point, and monitor change in backscatter intensity.
| 2019 | 2023 |
 |
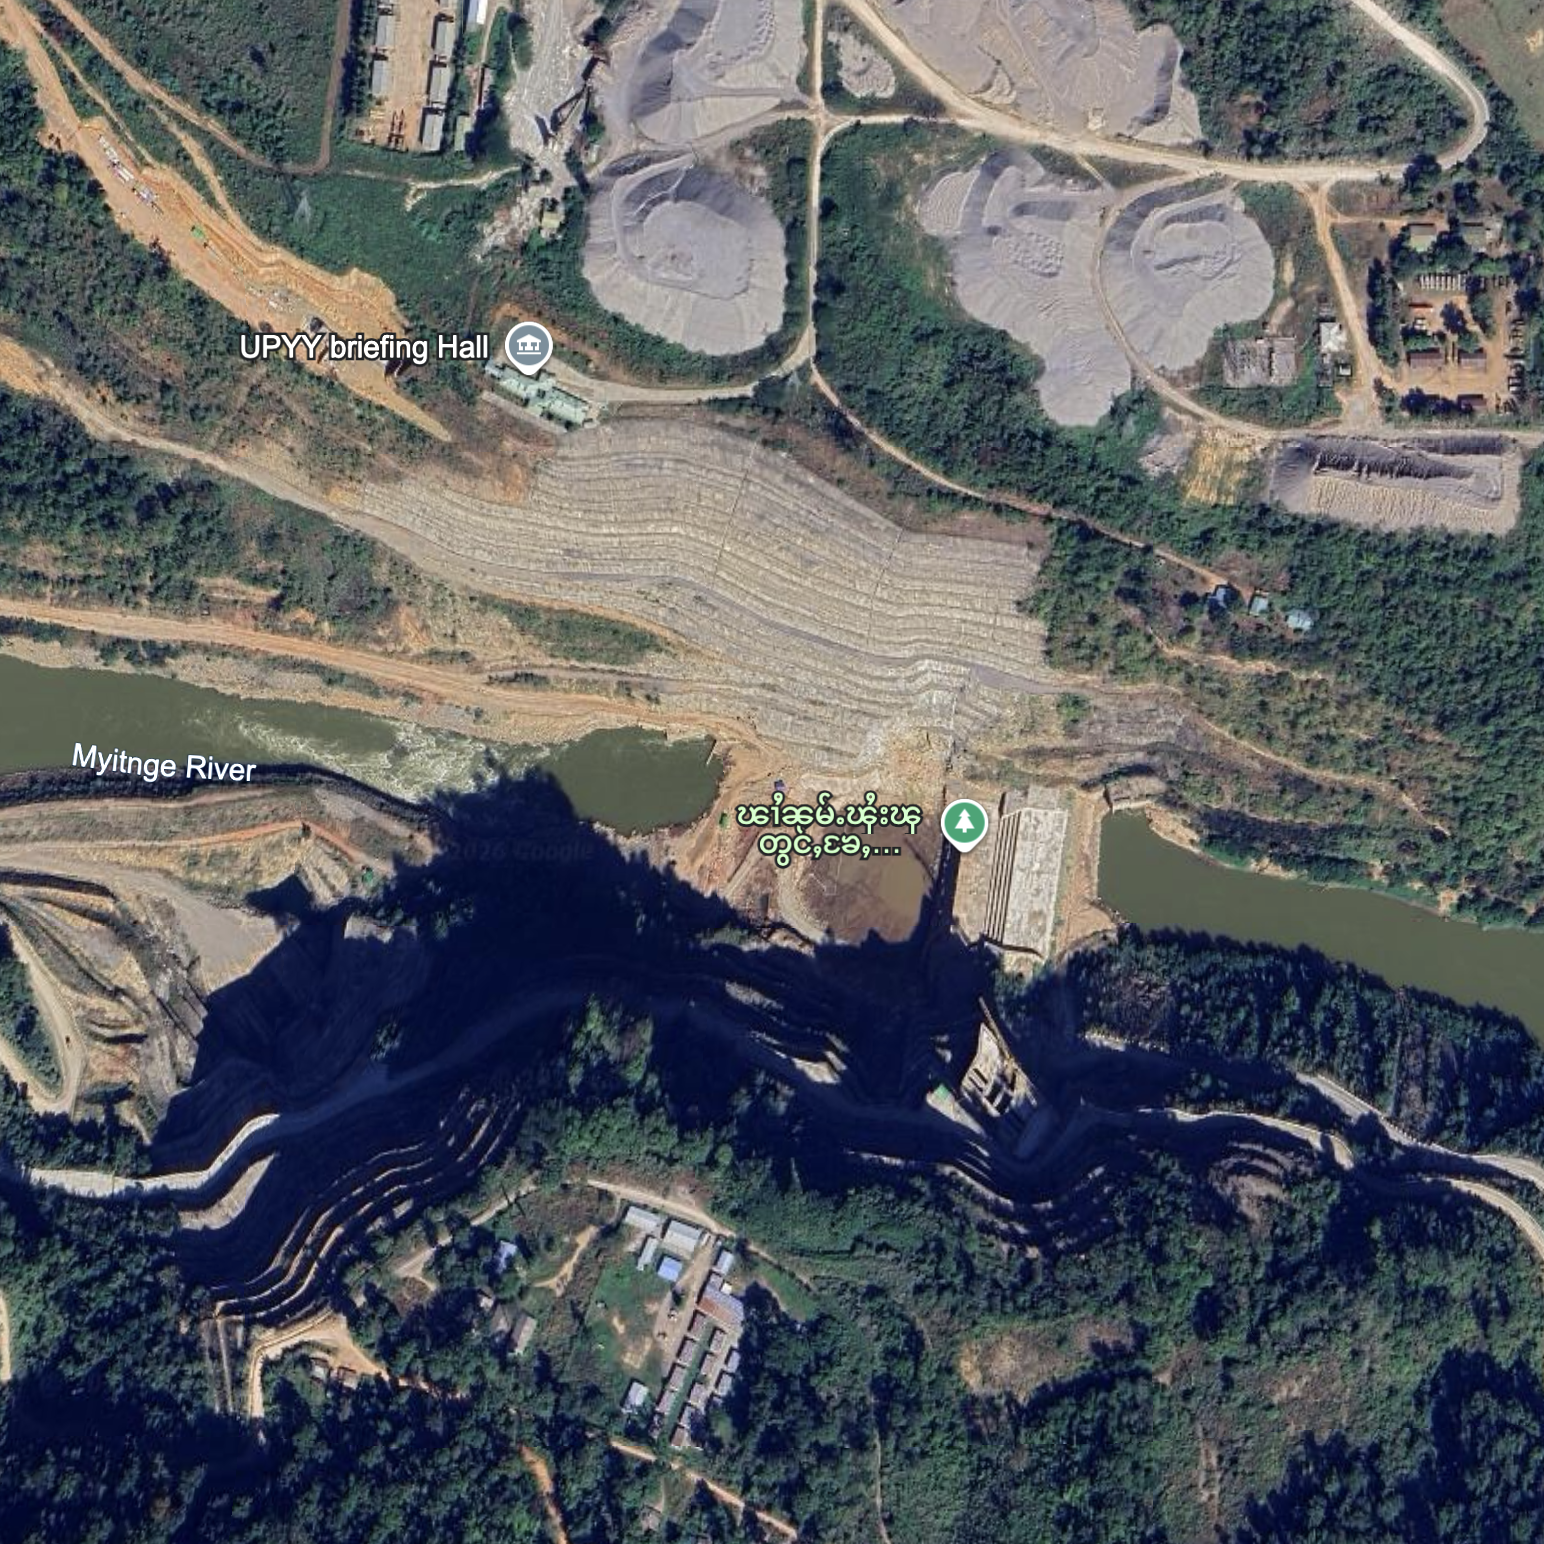 |
Source: Analysis conducted using SAR data from Sentinel-1A; reference images from LANDSAT, Google Earth and Sentinel-2 accessed using Google Earth Engine. The images are annual composites and the SAR analysis in the line chart is aggregated monthly. Data available from October 2014 to January 2026.
Most of the construction for Upper Yeywa happened between 2019 and 2023, confirmed by SAR data (lower backscatter values), and images from LANDSAT. The satellite images from Google Earth confirm the absence of a structure in 2019, and the presence of a concrete structure by 2023.
The lower backscatter intensity values after mid-2022 could be indicative of a pause in construction, or an increase in water from the reservoir.
Anomalies were detected in the radar signal in late 2020 and 2021, and in early 2025 potentially indicating non-structural changes such as movement of machinery, people. External sources suggest that there was shelling and damage done to the dam in 2025.
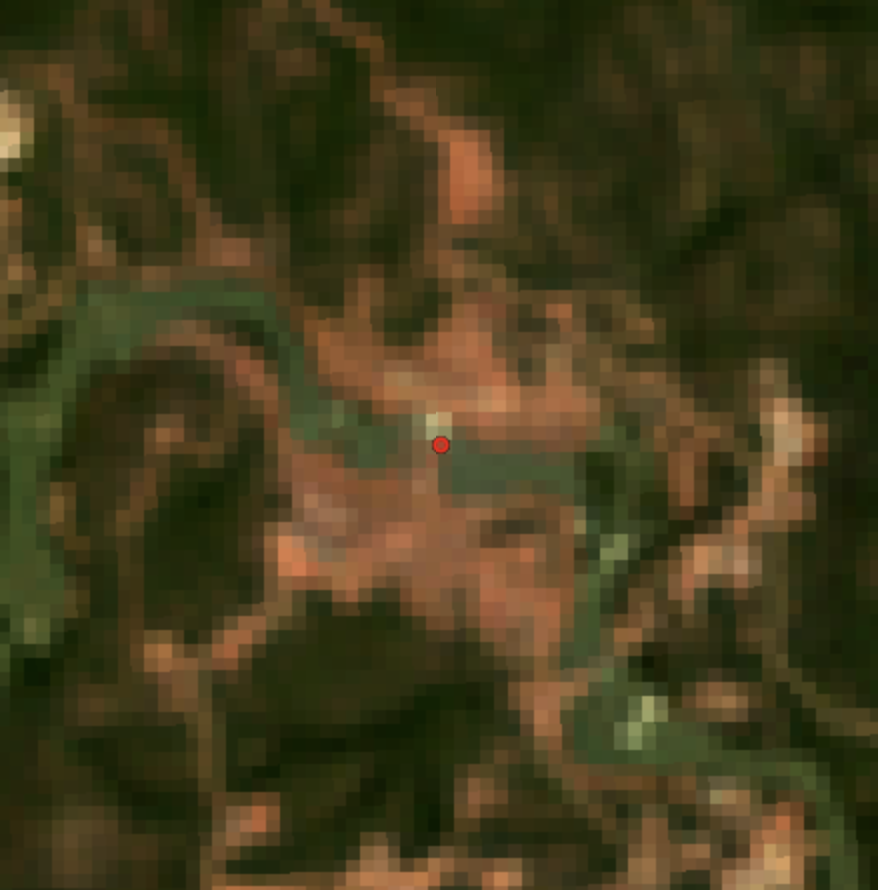
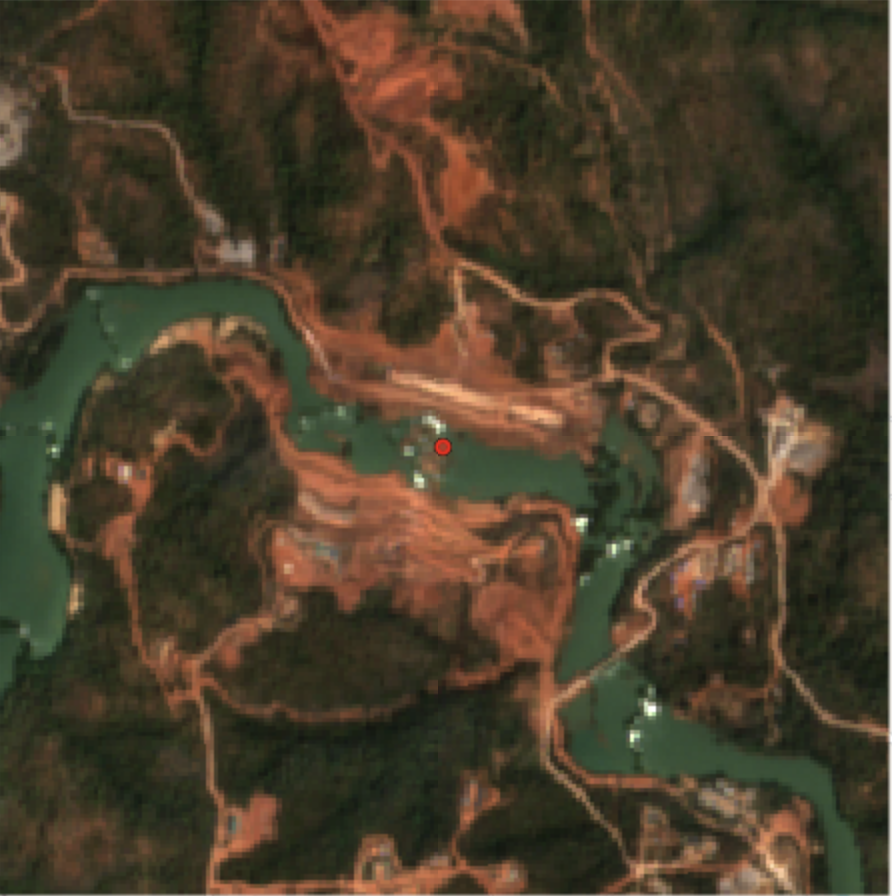
Upper Kengtawng Hydropower Project#
The red dot on these images indicates the location of the dam considered for the analysis. We add a 150m buffer around this point, and monitor change in backscatter intensity.
| 2015 | 2017 | 2021 | 2025 |
 |
 |
 |
 |
Source: Analysis conducted using SAR data from Sentinel-1A; reference images from LANDSAT, Google Earth and Sentinel-2 accessed using Google Earth Engine.The images are annual composites and the SAR analysis in the line chart is aggregated monthly. Data available from January 2014 to January 2026.
The images show that by 2017, the construction had begun and was in the initial stages i.e. ground clearing, excavation and exposed water surface, thereby driving the backscatter intensity down on the chart. From 2017 through 2021 we see an active construction phase when the main embankment was built and is visible as large, rough, terraced rock-fill structure. From 2021 onwards, the backscatter trend plateaus, indicating potential pause or near-completion of dam construction.
Anomalies were detected in the signal around June 2016, which may have been because of flooding in the state.
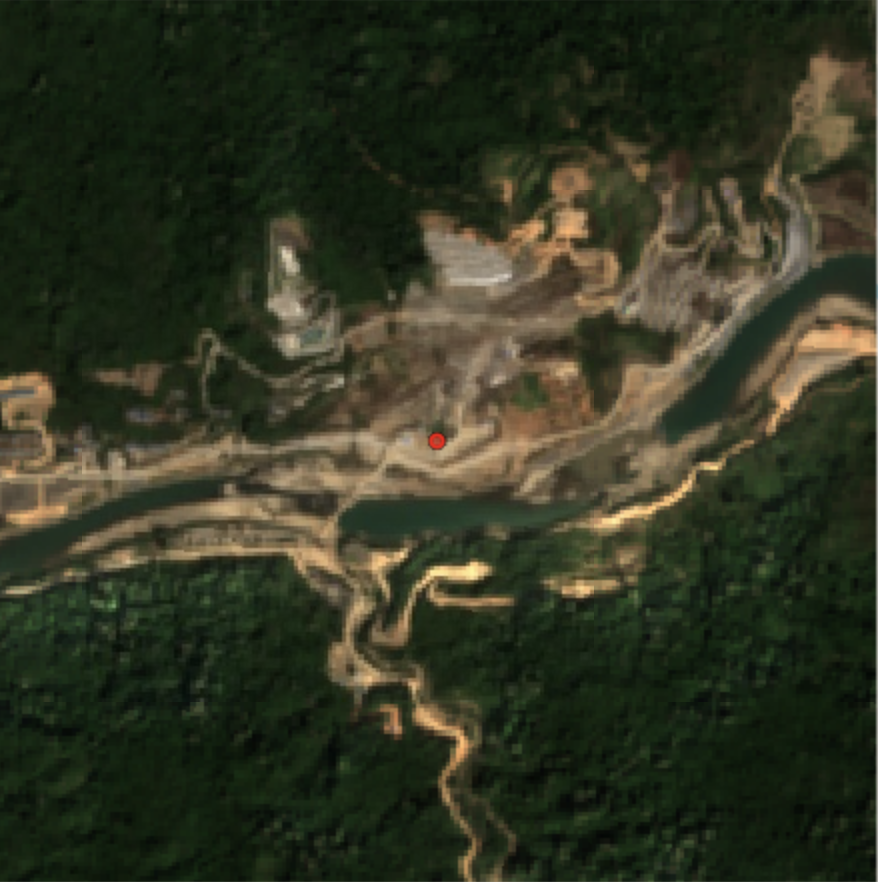
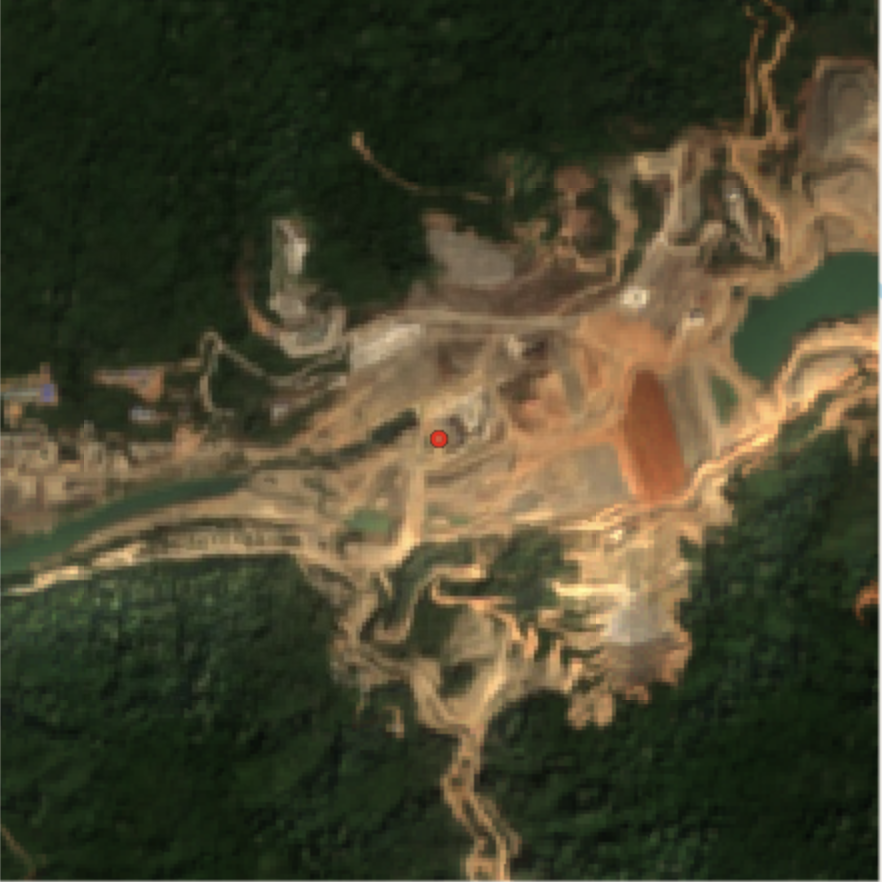
Tha Htay Hydropower Project#
The red dot on these images indicates the location of the dam considered for the analysis. We add a 150m buffer around this point, and monitor change in backscatter intensity.
| 2018 | 2021 | 2023 | 2025 |
 |
 |
 |
 |
Source: Analysis conducted using SAR data from Sentinel-1A; reference images from LANDSAT, Google Earth and Sentinel-2 accessed using Google Earth Engine. The images are annual composites and the SAR analysis in the line chart is aggregated monthly. Data available from January 2018 to January 2026.
This dam saw a steady growth in construction activity as seen in the upward trend for the backscatter intensity and in satellite images. External sources suggest that the dam construction has been shut down in 2024. According to the images, and the backscatter intensity, the rate of construction seemed to have slowed down from 2024, compared to earlier.
High anomalies were detected in late 2018 in the 150 m radius around this dam point (indicated in red in the images). The reasons for this are unknown yet, they may be because of floods or landslides.