Air Pollution in Myanmar#
This notebook analyzes air pollution in Myanmar using data from the Sentinel-5 Precursor (Sentinel-5p) satellite, specifically the TROPOMI (Tropospheric Monitoring Instrument) sensor. Sentinel-5p TROPOMI provides high-resolution, daily measurements of atmospheric trace gases, including nitrogen dioxide (NO₂), ozone (O₃), carbon monoxide (CO), methane (CH₄), and more.
For this analysis, we use the NO₂ column number density product, which quantifies the total amount of nitrogen dioxide in a vertical column of the atmosphere above each location. The data is processed to aggregate values at various administrative levels (ADM0–ADM3) and over different time periods (annual, monthly). Key features of the Sentinel-5p TROPOMI dataset:
Global coverage with a spatial resolution of up to 3.5 x 5.5 km.
Daily revisit frequency, enabling near real-time monitoring.
Open access via the Copernicus program, supporting research and policy.
The NO₂ data is joined to Myanmar administrative boundaries using spatial operations, and year-over-year (YoY) changes are computed to assess trends and anomalies. This approach enables robust, scalable analysis of air quality at national and subnational levels. For more details on the Sentinel-5p mission and TROPOMI instrument, see:
Air Pollution is typically measured by calculating the density of different pollutants in the atmosphere. Some of the commonly measured pollutants are NO2, O3 and particulate matter. Studies found NO2 levels as a useful proxy for economic activity (Deb, et.al., 2020). One of the reasons is because it is measured during the day when businesses are open and people are at work. It also stays close to the source of emissions —such as engines, vehicles or chimneys — and has a short atmospheric life (Ezran, et.al., 2023). Yailymova et.al., 2023 also posited that air quality and, in particular, levels of fine particulate matter (e.g., PM2.5 and PM 10 ) over cities can be a proxy for assessment of economic activity and density of city populations. NO2 along with other NOx reacts with other chemicals in the air to form both particulate matter and ozone. A 2020 study of cities in Sub-Saharan Africa finds that NO2 provides a useful, albeit “noisy”, real-time proxy measure of how COVID-19 has affected economic activity.
In this analysis, we observe the trends in monthly NO2 levels for Ethiopia from 2019 to 2024. The methodology to link economic activity to NO2 is still ongoing. This analysis is one step of it.
Common sources of NO2#
One of the chemical processes that generates NO2 is burning of fossil fuels (coal, gas and oil). Gives cars use this process, road traffic is the principal outdoor source of nitrogen dioxide (Jarvis et. al., 2010).
Diesel powered non-road equipment
Industrial processes such as oil and gas production
Coal fired power plants
While the principal emissions of an aircraft are CO2 and H2O, other major emissions include nitric oxide and nitrogen dioxide (Miake-Lye & Hauglustaine, 2022).
Any construction activity involving diesel fuel non-road mobile machinery will result in NOx emissions.
# Create 10km buffer around each industrial zone point
# First convert to a projected CRS for accurate distance calculations (UTM Zone 46N for Myanmar)
ind_projected = ind.to_crs("EPSG:32646")

# Create 10km buffer (10000 meters)
ind_buffered = ind_projected.copy()
ind_buffered["geometry"] = ind_projected.geometry.buffer(5000)

# Convert back to geographic CRS for consistency with other datasets
ind_buffered = ind_buffered.to_crs("EPSG:4326")
ind_buffered.to_file
<Axes: >
mmr_no2_ind = unique_points[["geometry", "latitude", "longitude"]].sjoin(
    ind_buffered[["geometry", "Name"]], how="inner", predicate="intersects"
)

mmr_no2_ind = mmr_no2_ind.groupby(level=0, group_keys=False).apply(pick_deepest_polygon)
mmr_no2_ind = mmr_no2.merge(
    mmr_no2_ind[["latitude", "longitude", "Name"]],
    on=["latitude", "longitude"],
    how="right",
)
mmr_no2_adm3[
    [
        "ADM3_EN",
        "ADM3_MY",
        "ADM3_PCODE",
        "ADM2_EN",
        "ADM2_MY",
        "ADM2_PCODE",
        "ADM1_EN",
        "ADM1_MY",
        "ADM1_ALTPC",
        "ADM1_PCODE",
        "year",
        "start_date",
        "NO2_column_number_density",
    ]
].to_csv(NO2_FOLDER / "myanmar_no2_adm3.csv", index=False)
mmr_no2_ind.to_csv(NO2_FOLDER / "myanmar_no2_industrial_zones.csv", index=False)
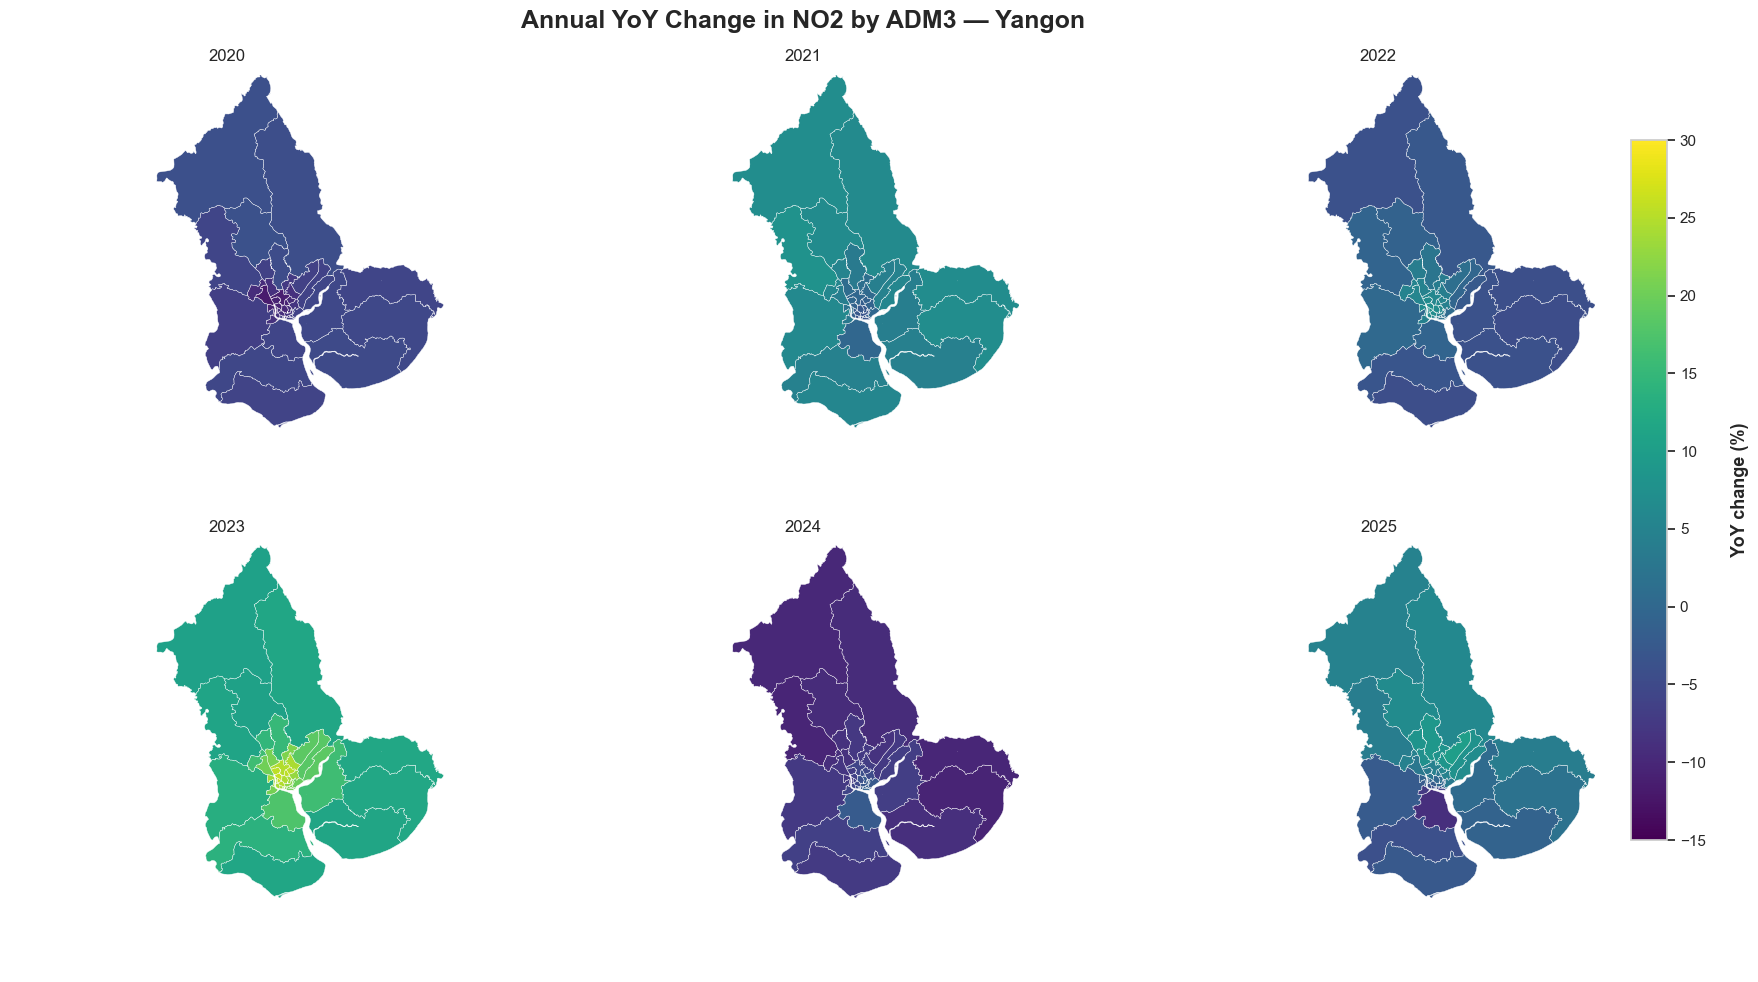
Trends in Yangon#