Nighttime Lights 2023 Analysis#
Nighttime lights have become a commonly used resource to estimate changes in local economic activity. This section shows changes in nighttime lights in Turkiye from before and after the earthquake.
Data#
We use nighttime lights data from the VIIRS Black Marble dataset. Raw nighttime lights data requires correction due to cloud cover and stray light, such as lunar light. The Black Marble dataset applies advanced algorithms to correct raw nighttime light values and calibrate data so that trends in lights over time can be meaningfully analyzed. We use daily and monthly data from VIIRS Black Marble.
The data for the analysis can be accessed from:
Black Marble Nighttime Lights: There are two options to access the data:
The code here downloads raw data from the NASA archive and processes the data for Turkiye—mosaicing raster tiles together to cover Turkiye. Running the code requires a NASA bearer token; the documentation here describes how to obtain a token.
Pre-processed data can be downloaded from here, using the Night Time Lights BlackMarble Data
Methodology#
We extract average nighttime lights within each administrative unit in Mynamar. We distinguish lights between lights observed in gas flaring locations and lights in other locations. Oil extraction and production involves gas flaring, which produces significant volumes of light. Separately examining lights in gas flaring and other locations allows distinguishing between lights generated due to oil production versus other sources of human activity. We use data on the locations of gas flaring sites from the Global Gas Flaring Reduction Partnership; we remove lights within 5km of gas flaring sites.
Implementation#
Code to replicate the analysis can be found here.
The code largely relies on an R package (blackmarbler) that is currently being created to facilitate downloading and processing Black Marble nighttime lights data. The package documentation provides some generic examples for how to download data, make a map of nighttime lights, and show trends in nighttime lights. The below code leverages the package to produce analytics for a country.
The main script (_main.R) loads all packages and runs all scripts for the analysis. Below we document scripts for (1) creating analysis-ready datasets and (2) producing analytics (eg, figures) of nighttime lights data.
Create Analysis-Ready Nighttime Lights Datasets#
The below code downloads and processes nighttime lights data.
01_clean_gas_flaring_data.R: Produces a clean dataset of the locations of gas flaring locations. This dataset is needed because we summarize nighttime lights for (1) all lights, (2) lights excluding gas flaring loations, and (3) lights only in gas flaring locations.
02_download_black_marble.R: Downloads Black Marble nighttime lights data for annual, monthly, and daily nighttime lights data. The script exports a geotiff file of nighttime lights for each time period (eg, for each year for annual data). If the script is run at a later date, only data that has not already been downloaded will be downloaded.
03_aggregate.R: Aggregates nighttime lights to administrative levels 0, 1 and 2. Calculates average nighttime lights within each administrative unit. The script produces a separate file for each time period. For example, for daily data, a single dataset is saved for aggregated nighttime lights for January 1, 2023, at the ADM2 level. The next script appends files across time periods (eg, days) into a single dataset. Separate files are saved in order to facilitate aggregating new data, as aggregating data can take some time. The script skips aggregating data that has already been processed.
04_append.R: Appends aggregated data for each time period. Creates a separate datasets for annual, monthly, and daily nighttime lights data.
Nighttime Lights Analytics#
The below code analyzes the nighttime lights data, producing figures and tables.
05_adm_trends.R: Produce figures of trends in nighttime lights
05_pc_2019_maps.R: Produce maps showing percent change in nighttime lights relative to 2019
05_map_ntl_annual_separate.R: Produce maps of nighttime lights for each year, separately
05_map_ntl_annual_together.R: Produce a figure showing maps of nighttime lights for each year available
Findings#
Maps of Nighttime Lights#
The below figures show maps of nighttime lights. The first figure shows nighttime lights in the latest year currently available (2022), and the second figure shows nighttime lights in each year.
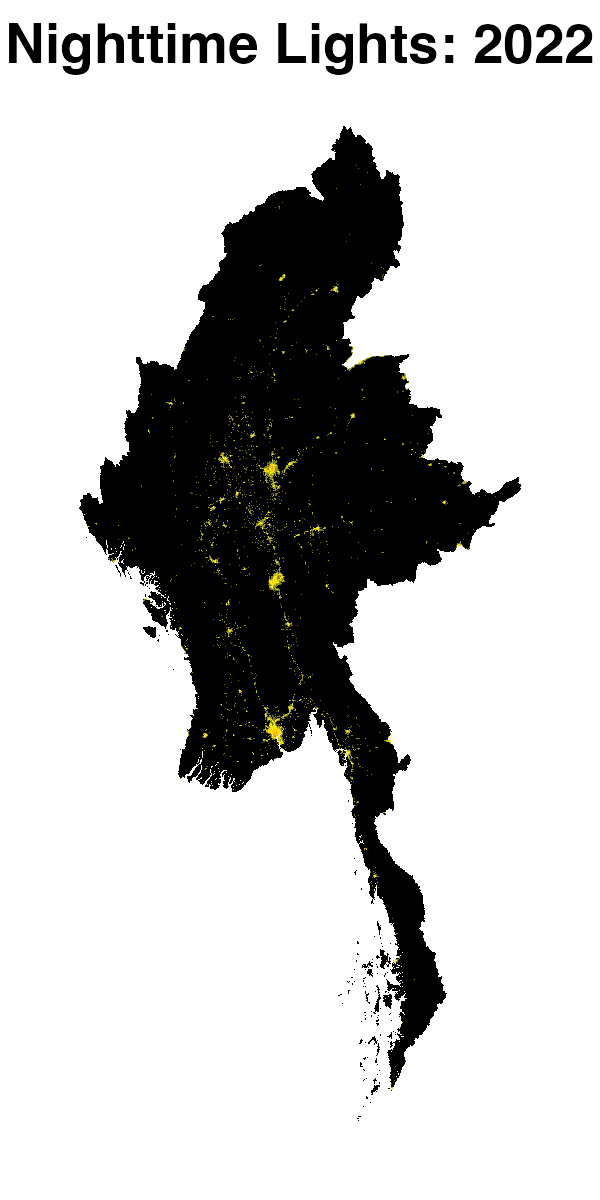
Fig. 1 Nighttime lights in 2022#
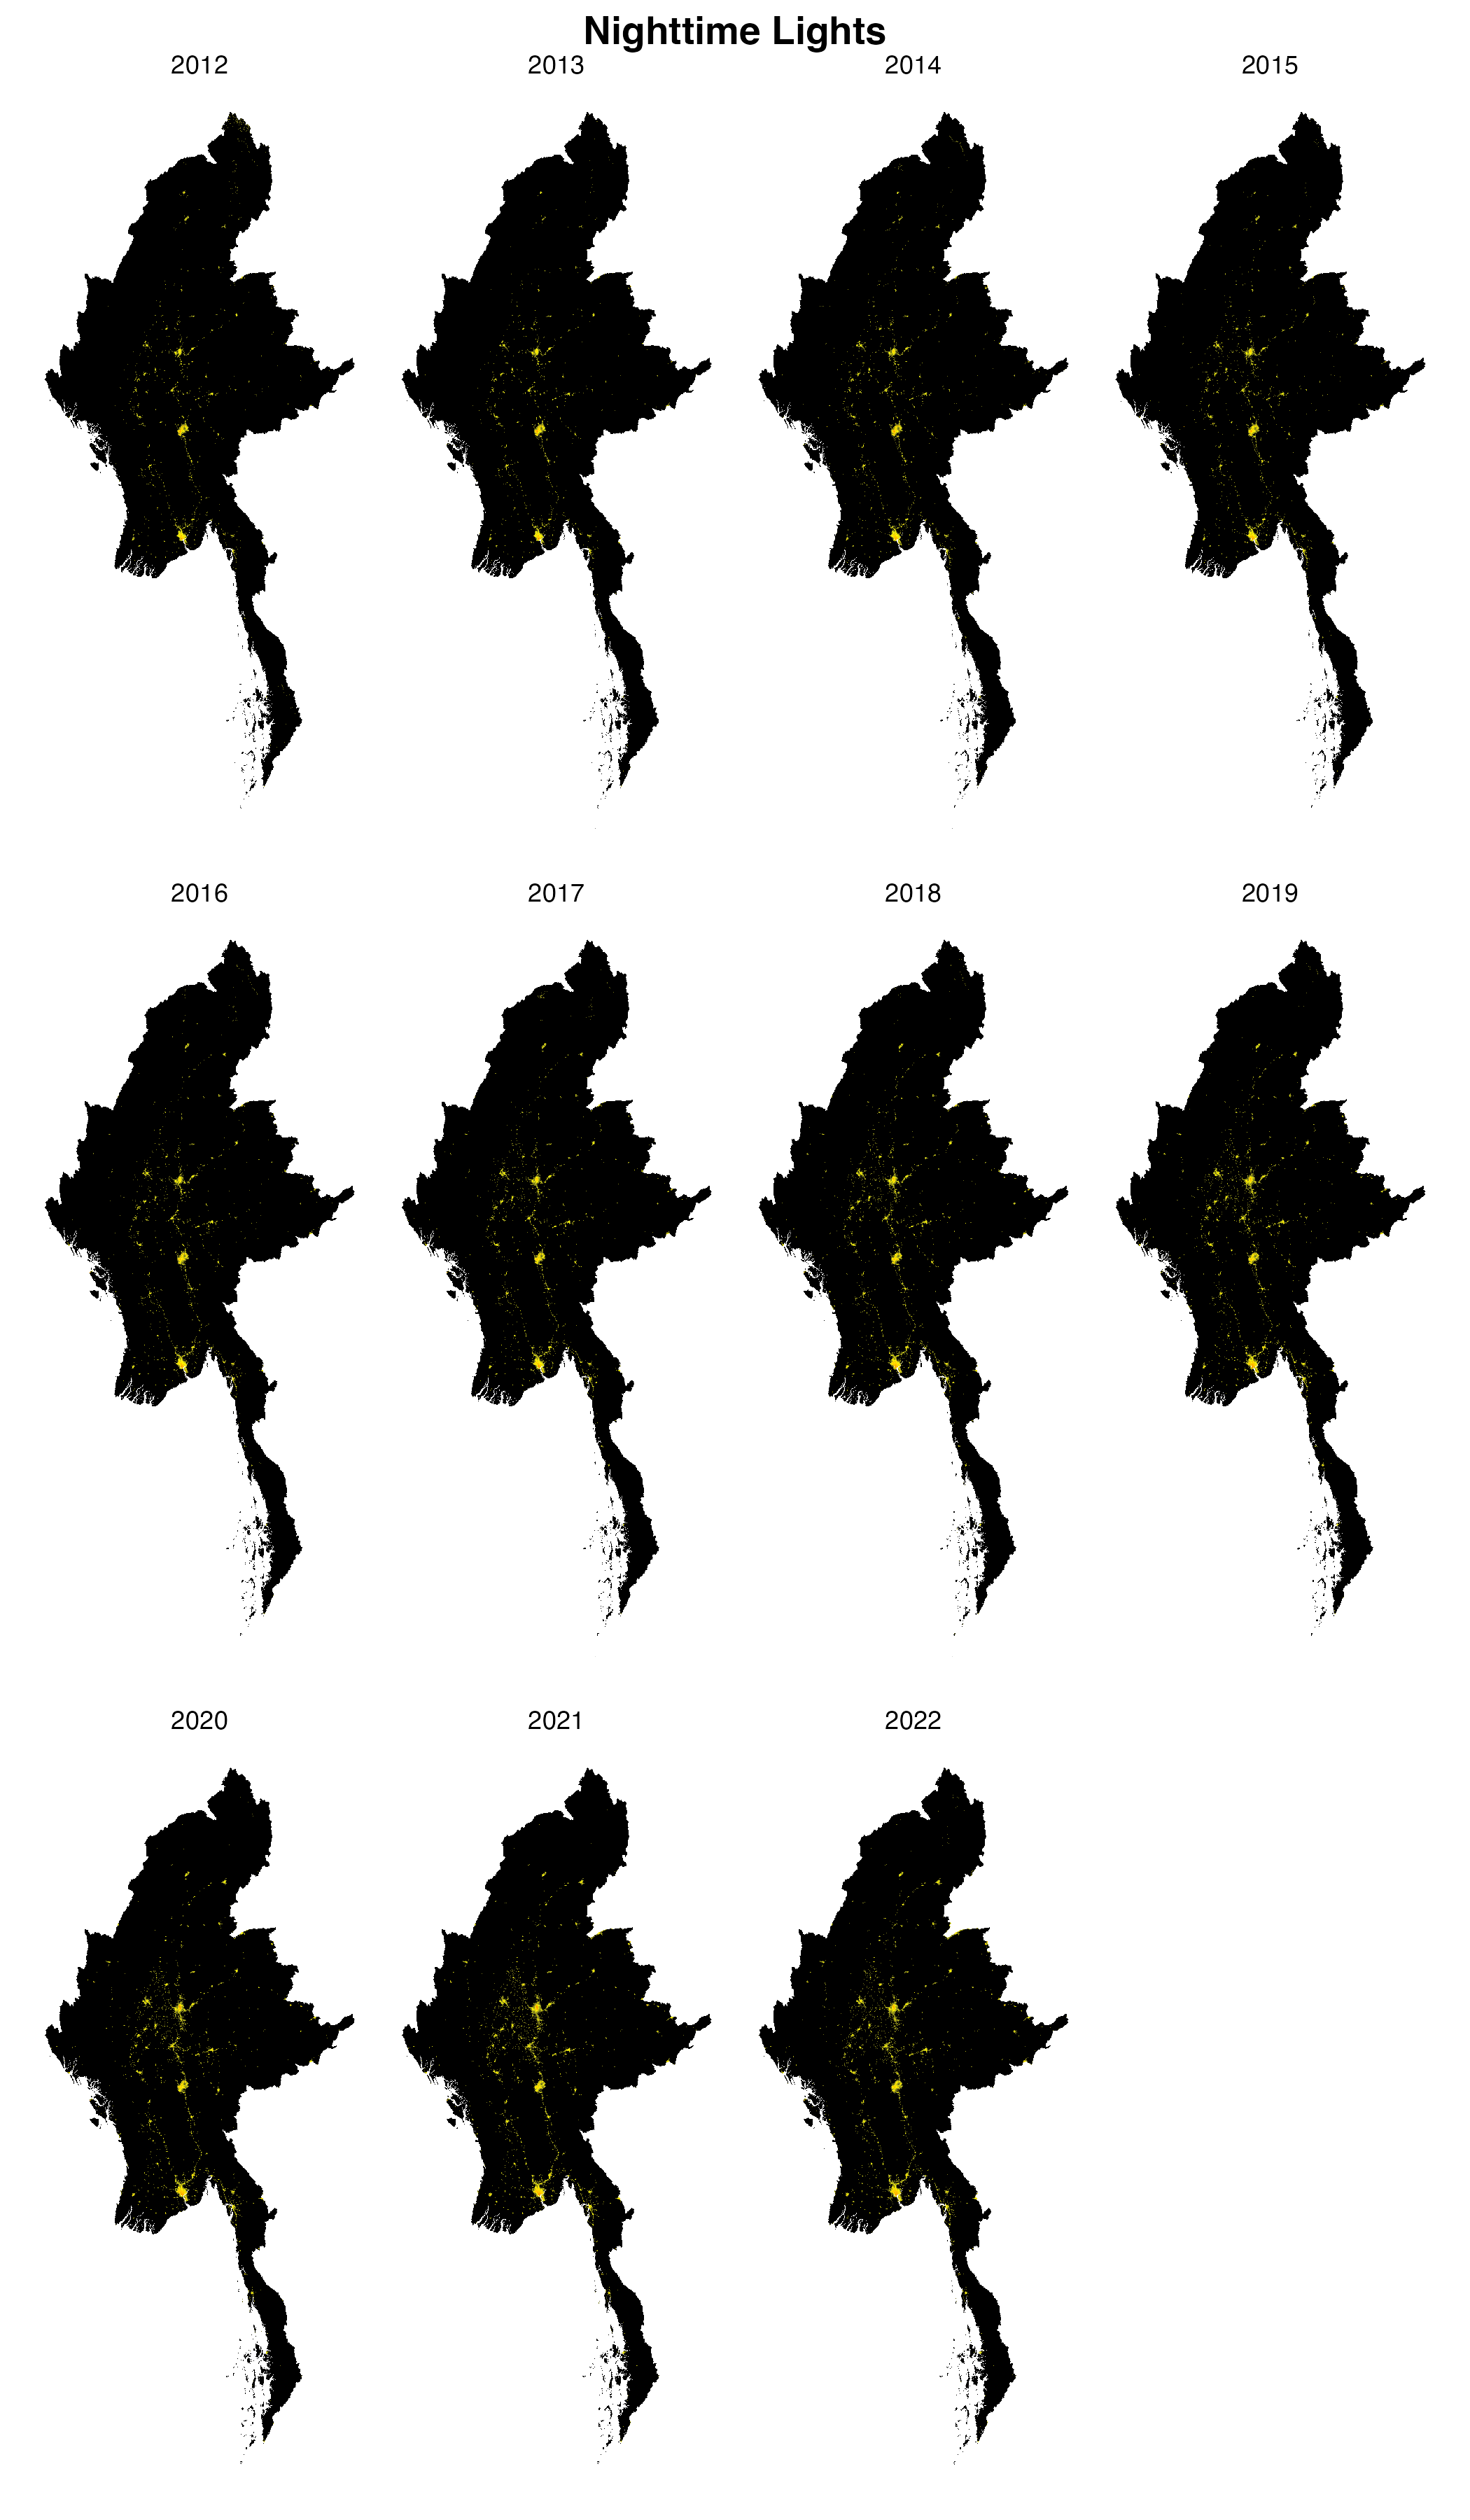
Fig. 2 Nighttime lights#
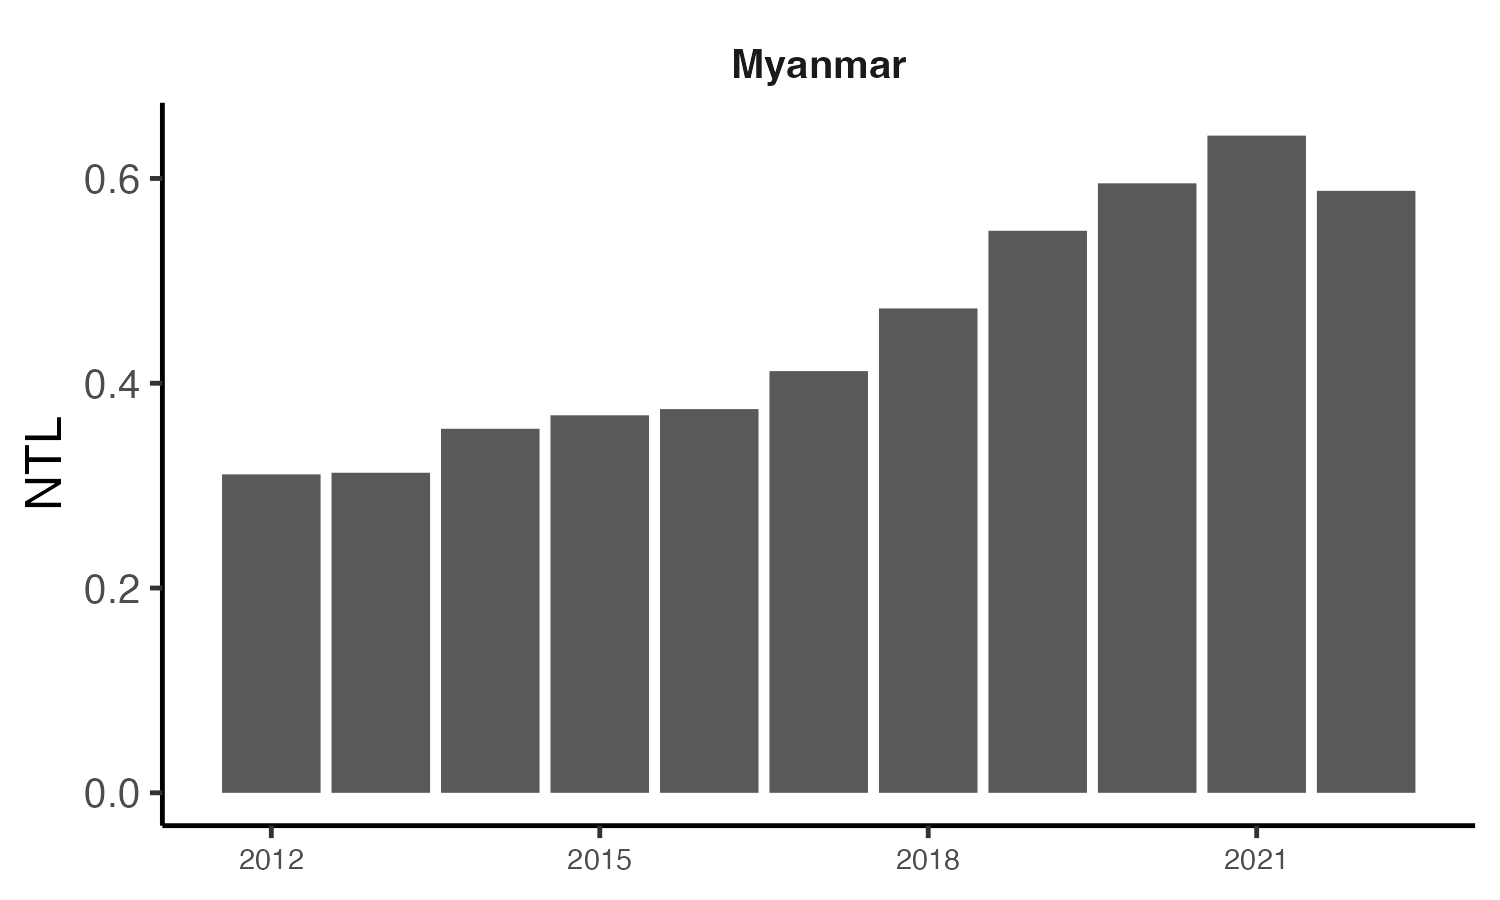
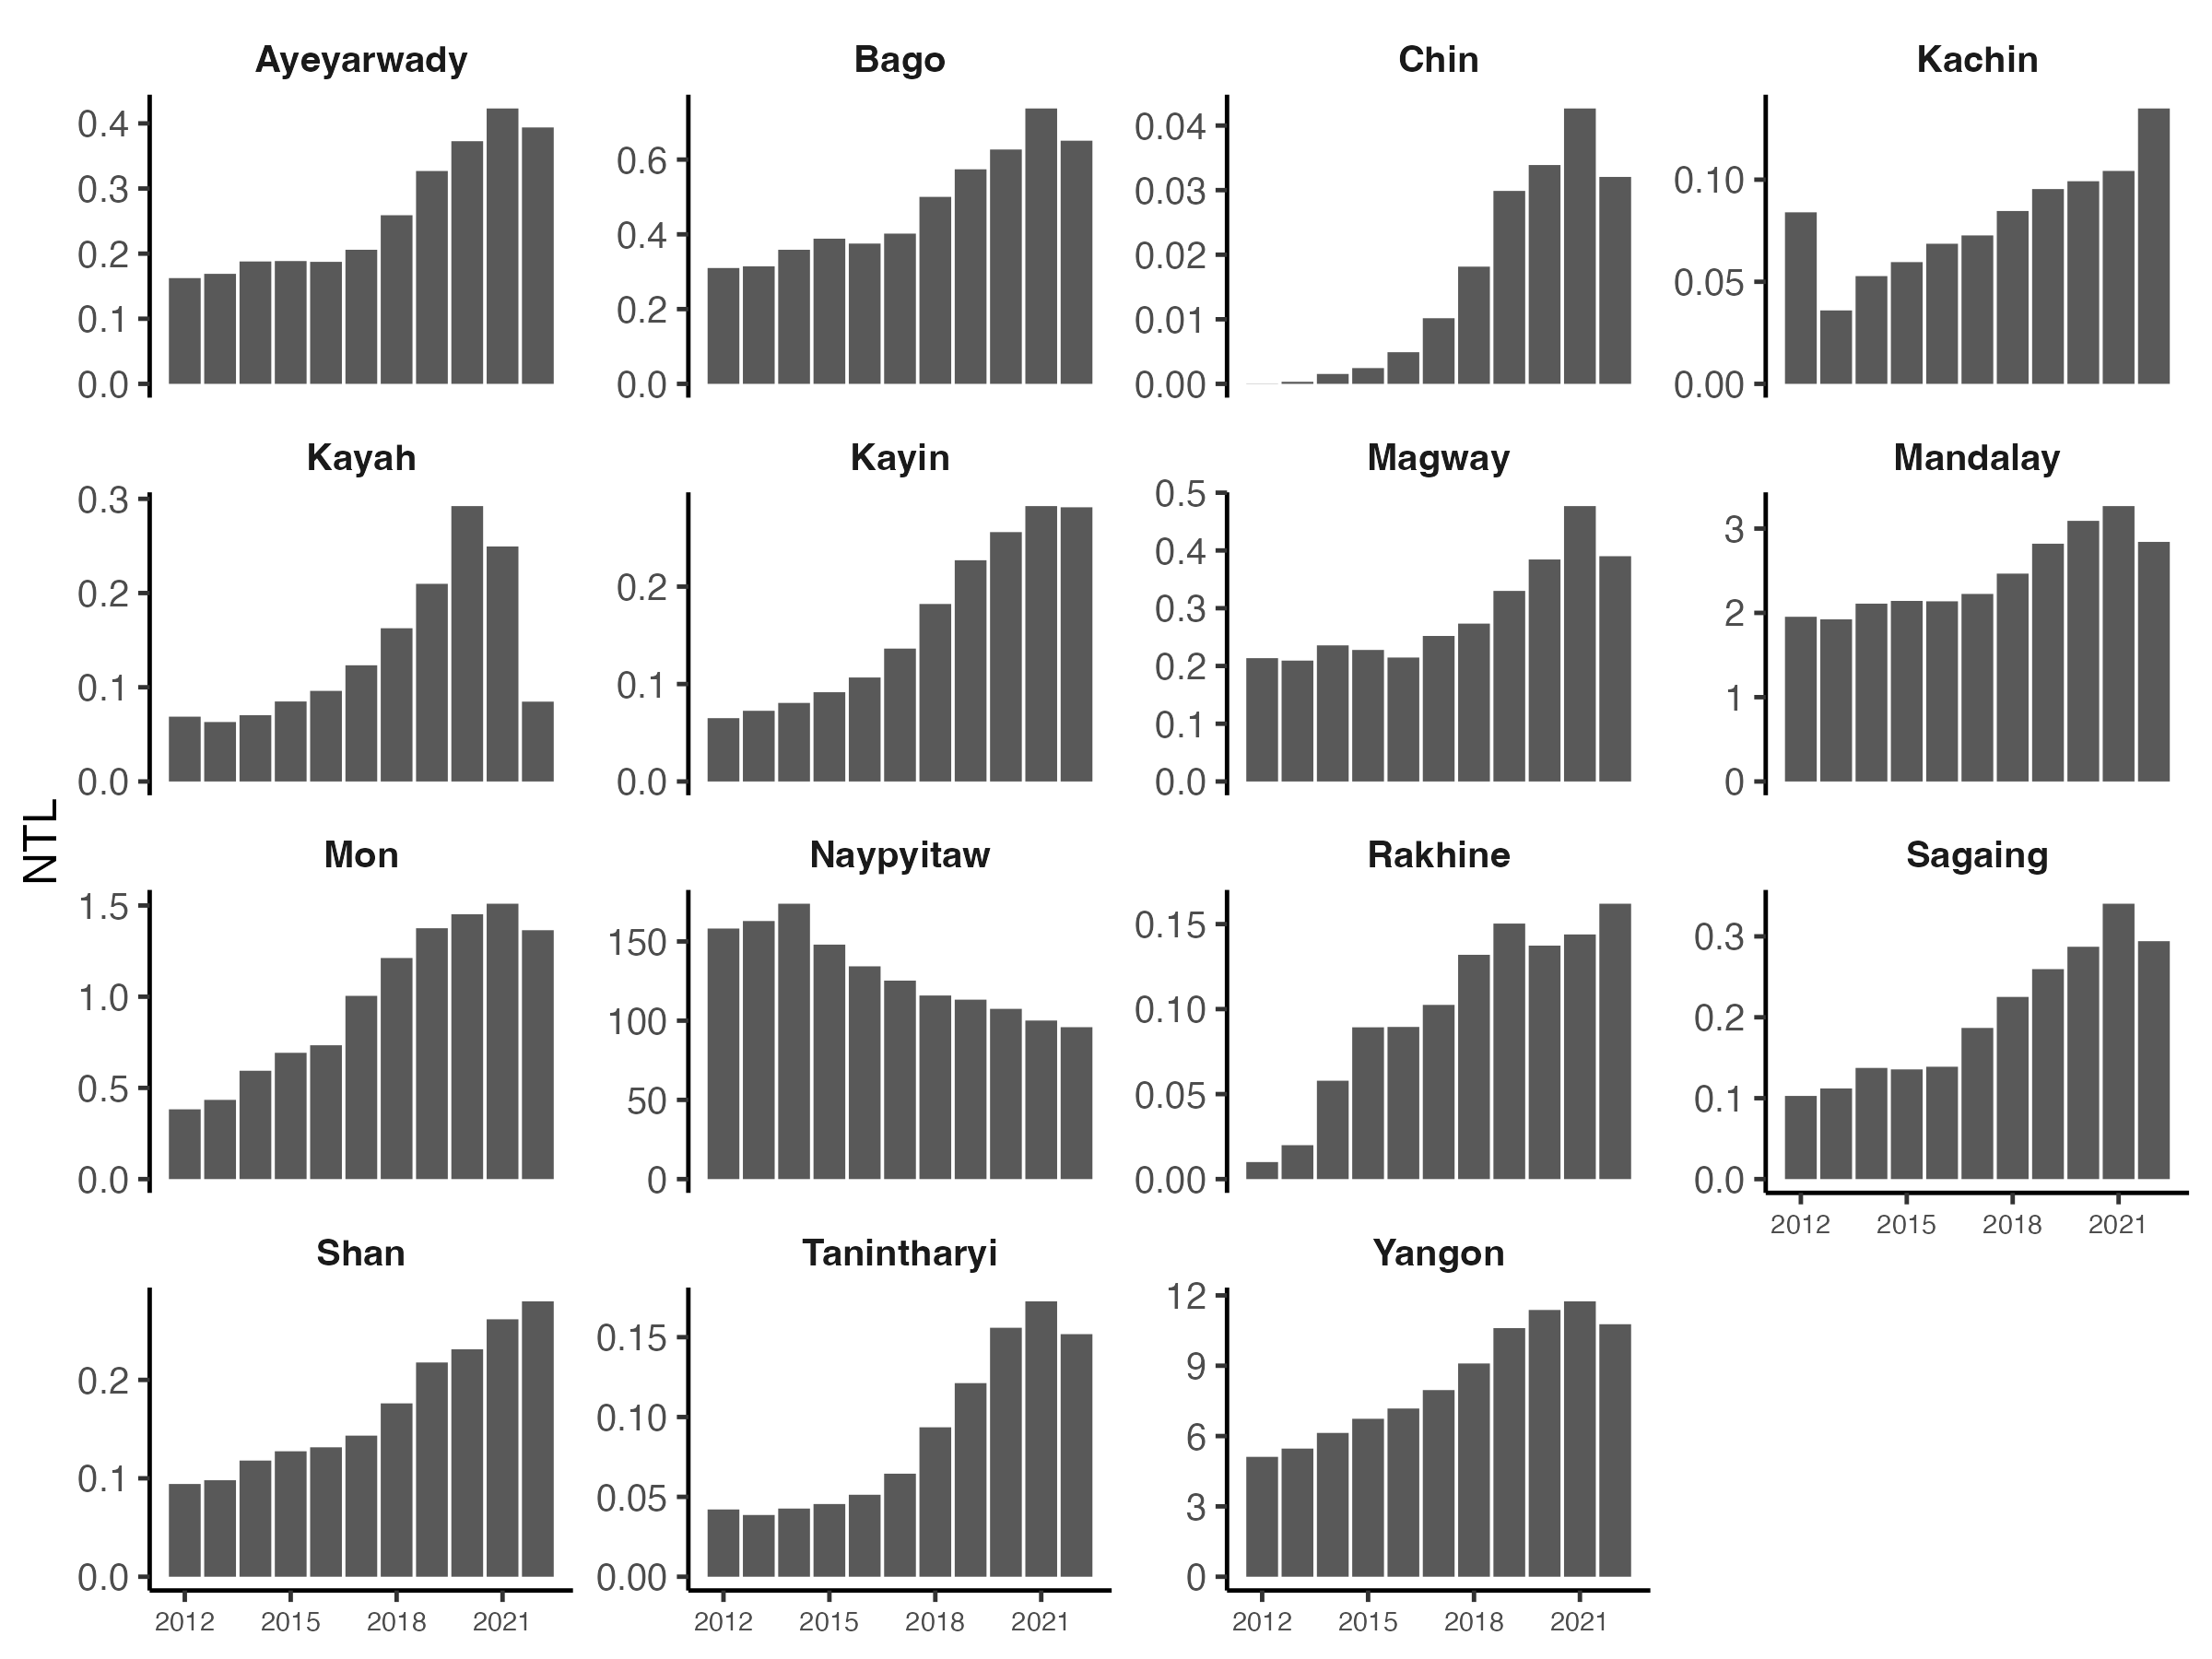
Trends in Nighttime Lights#
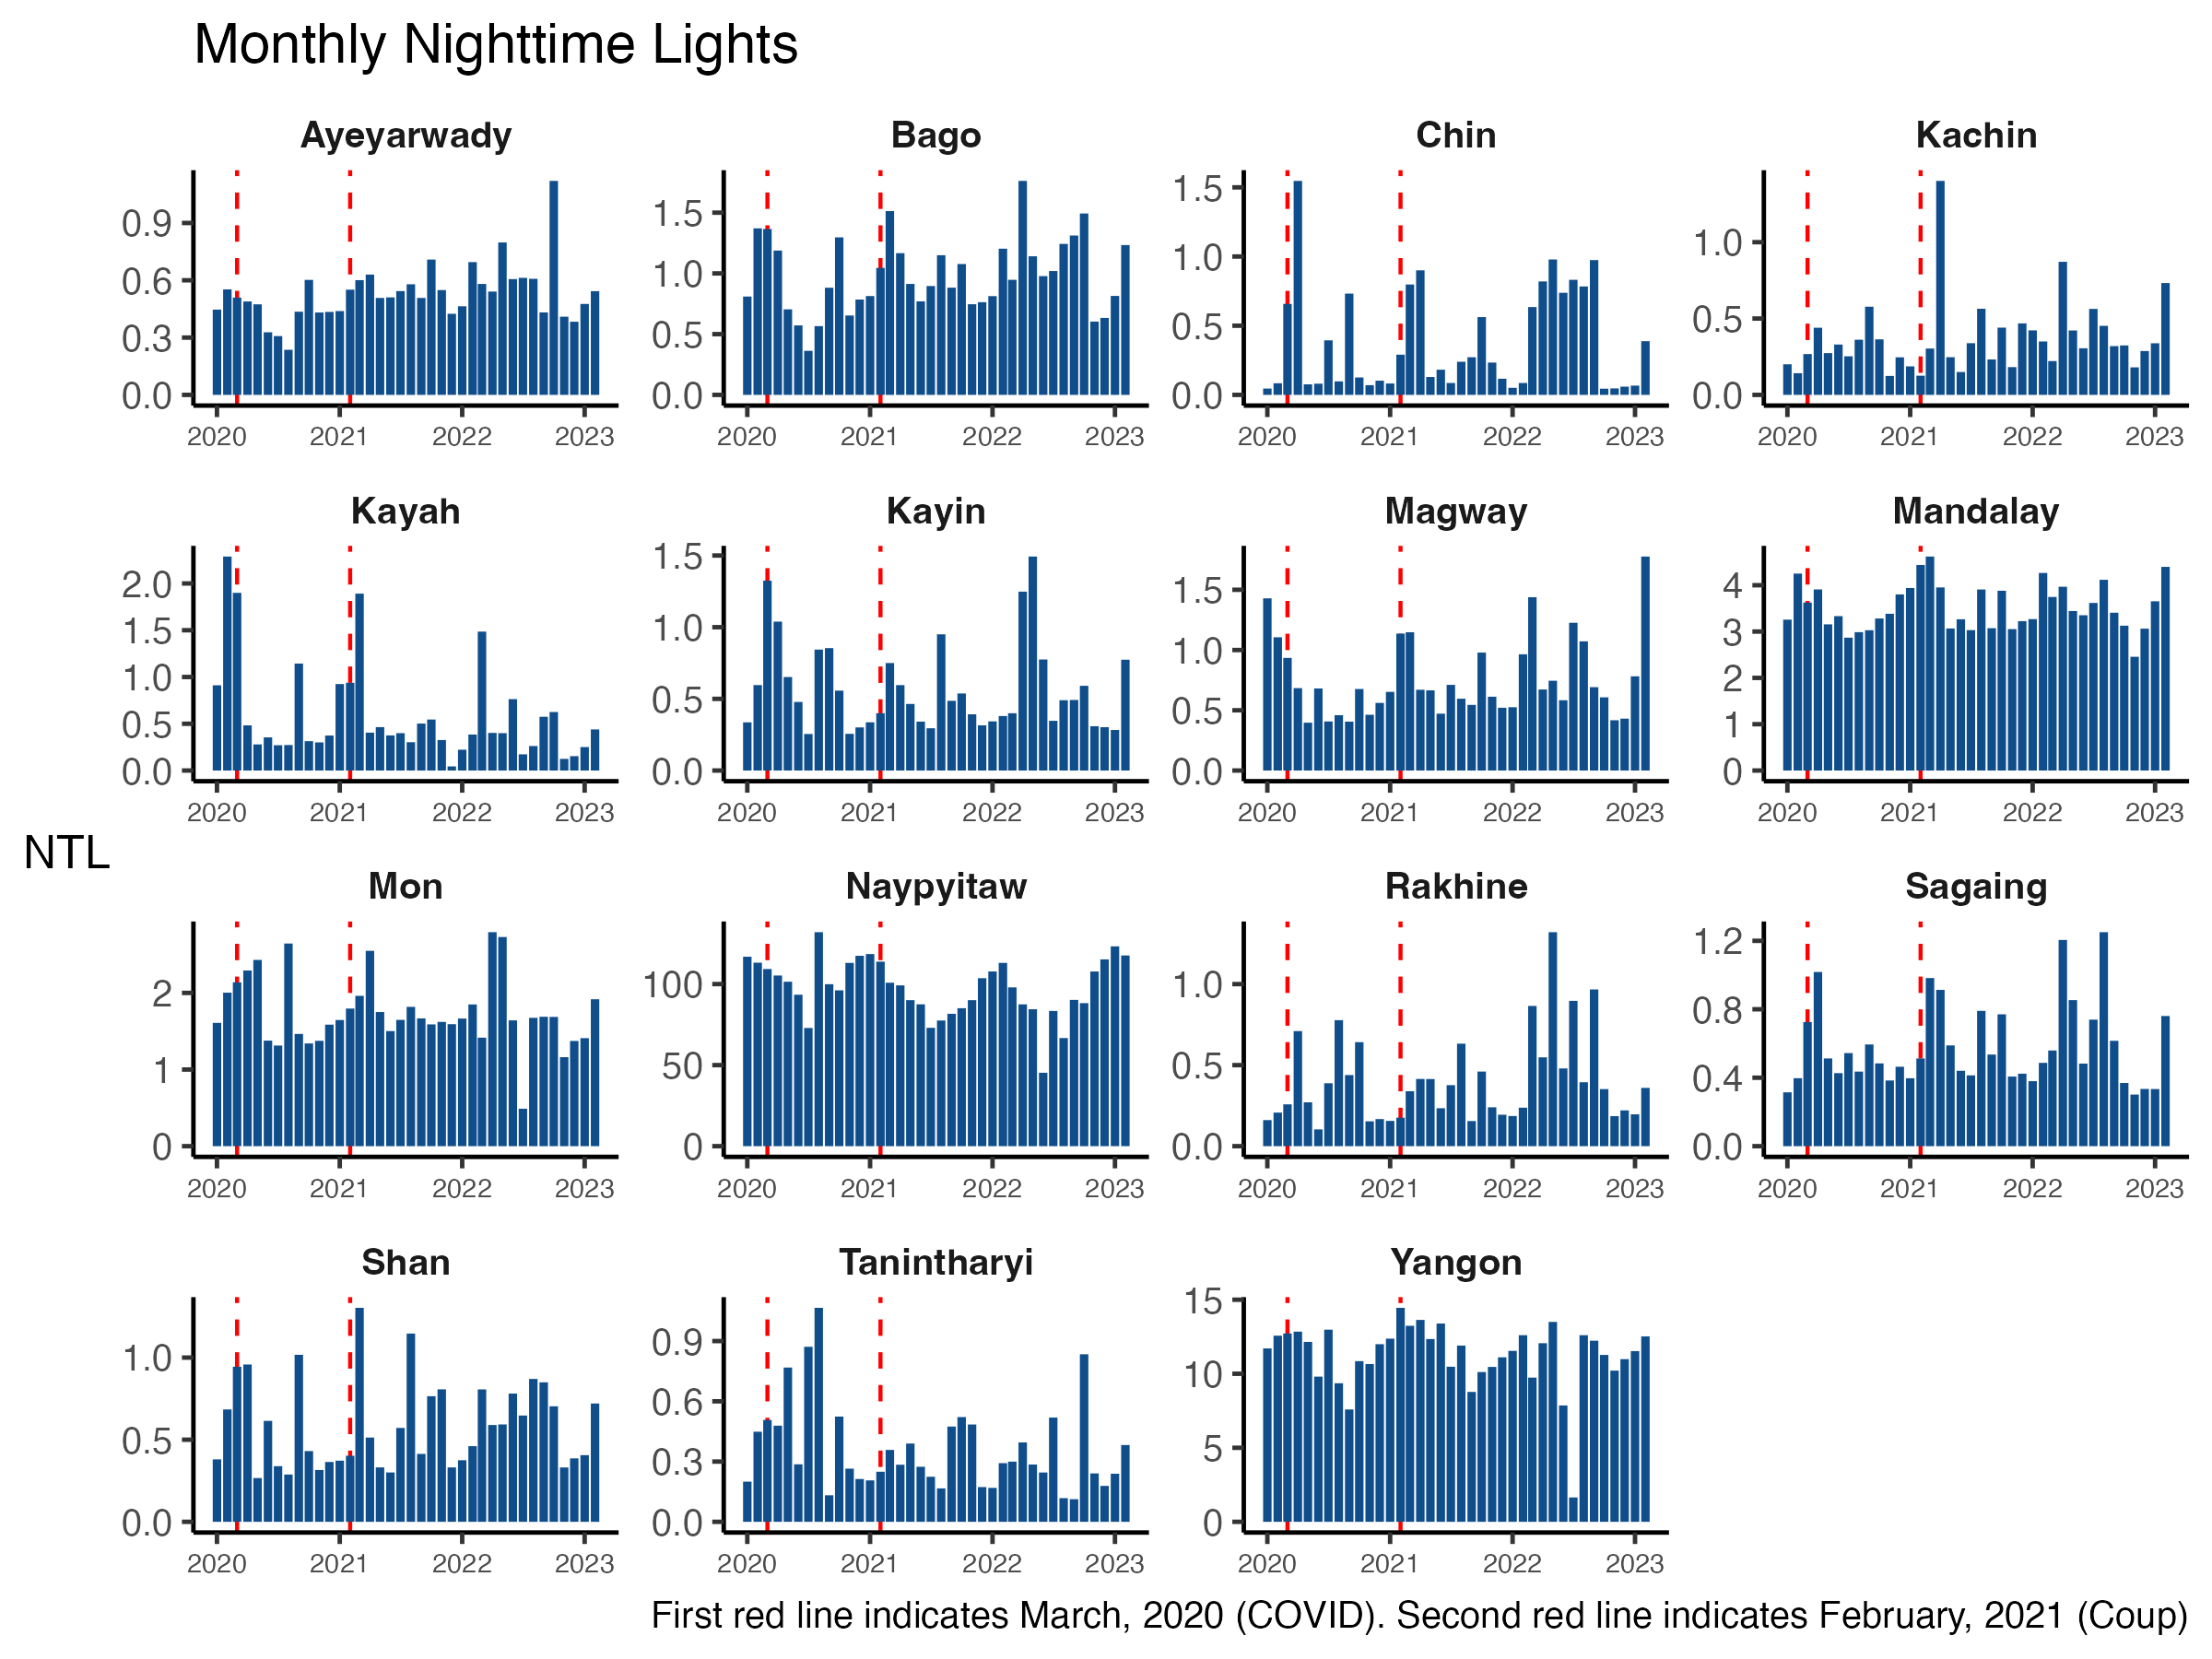
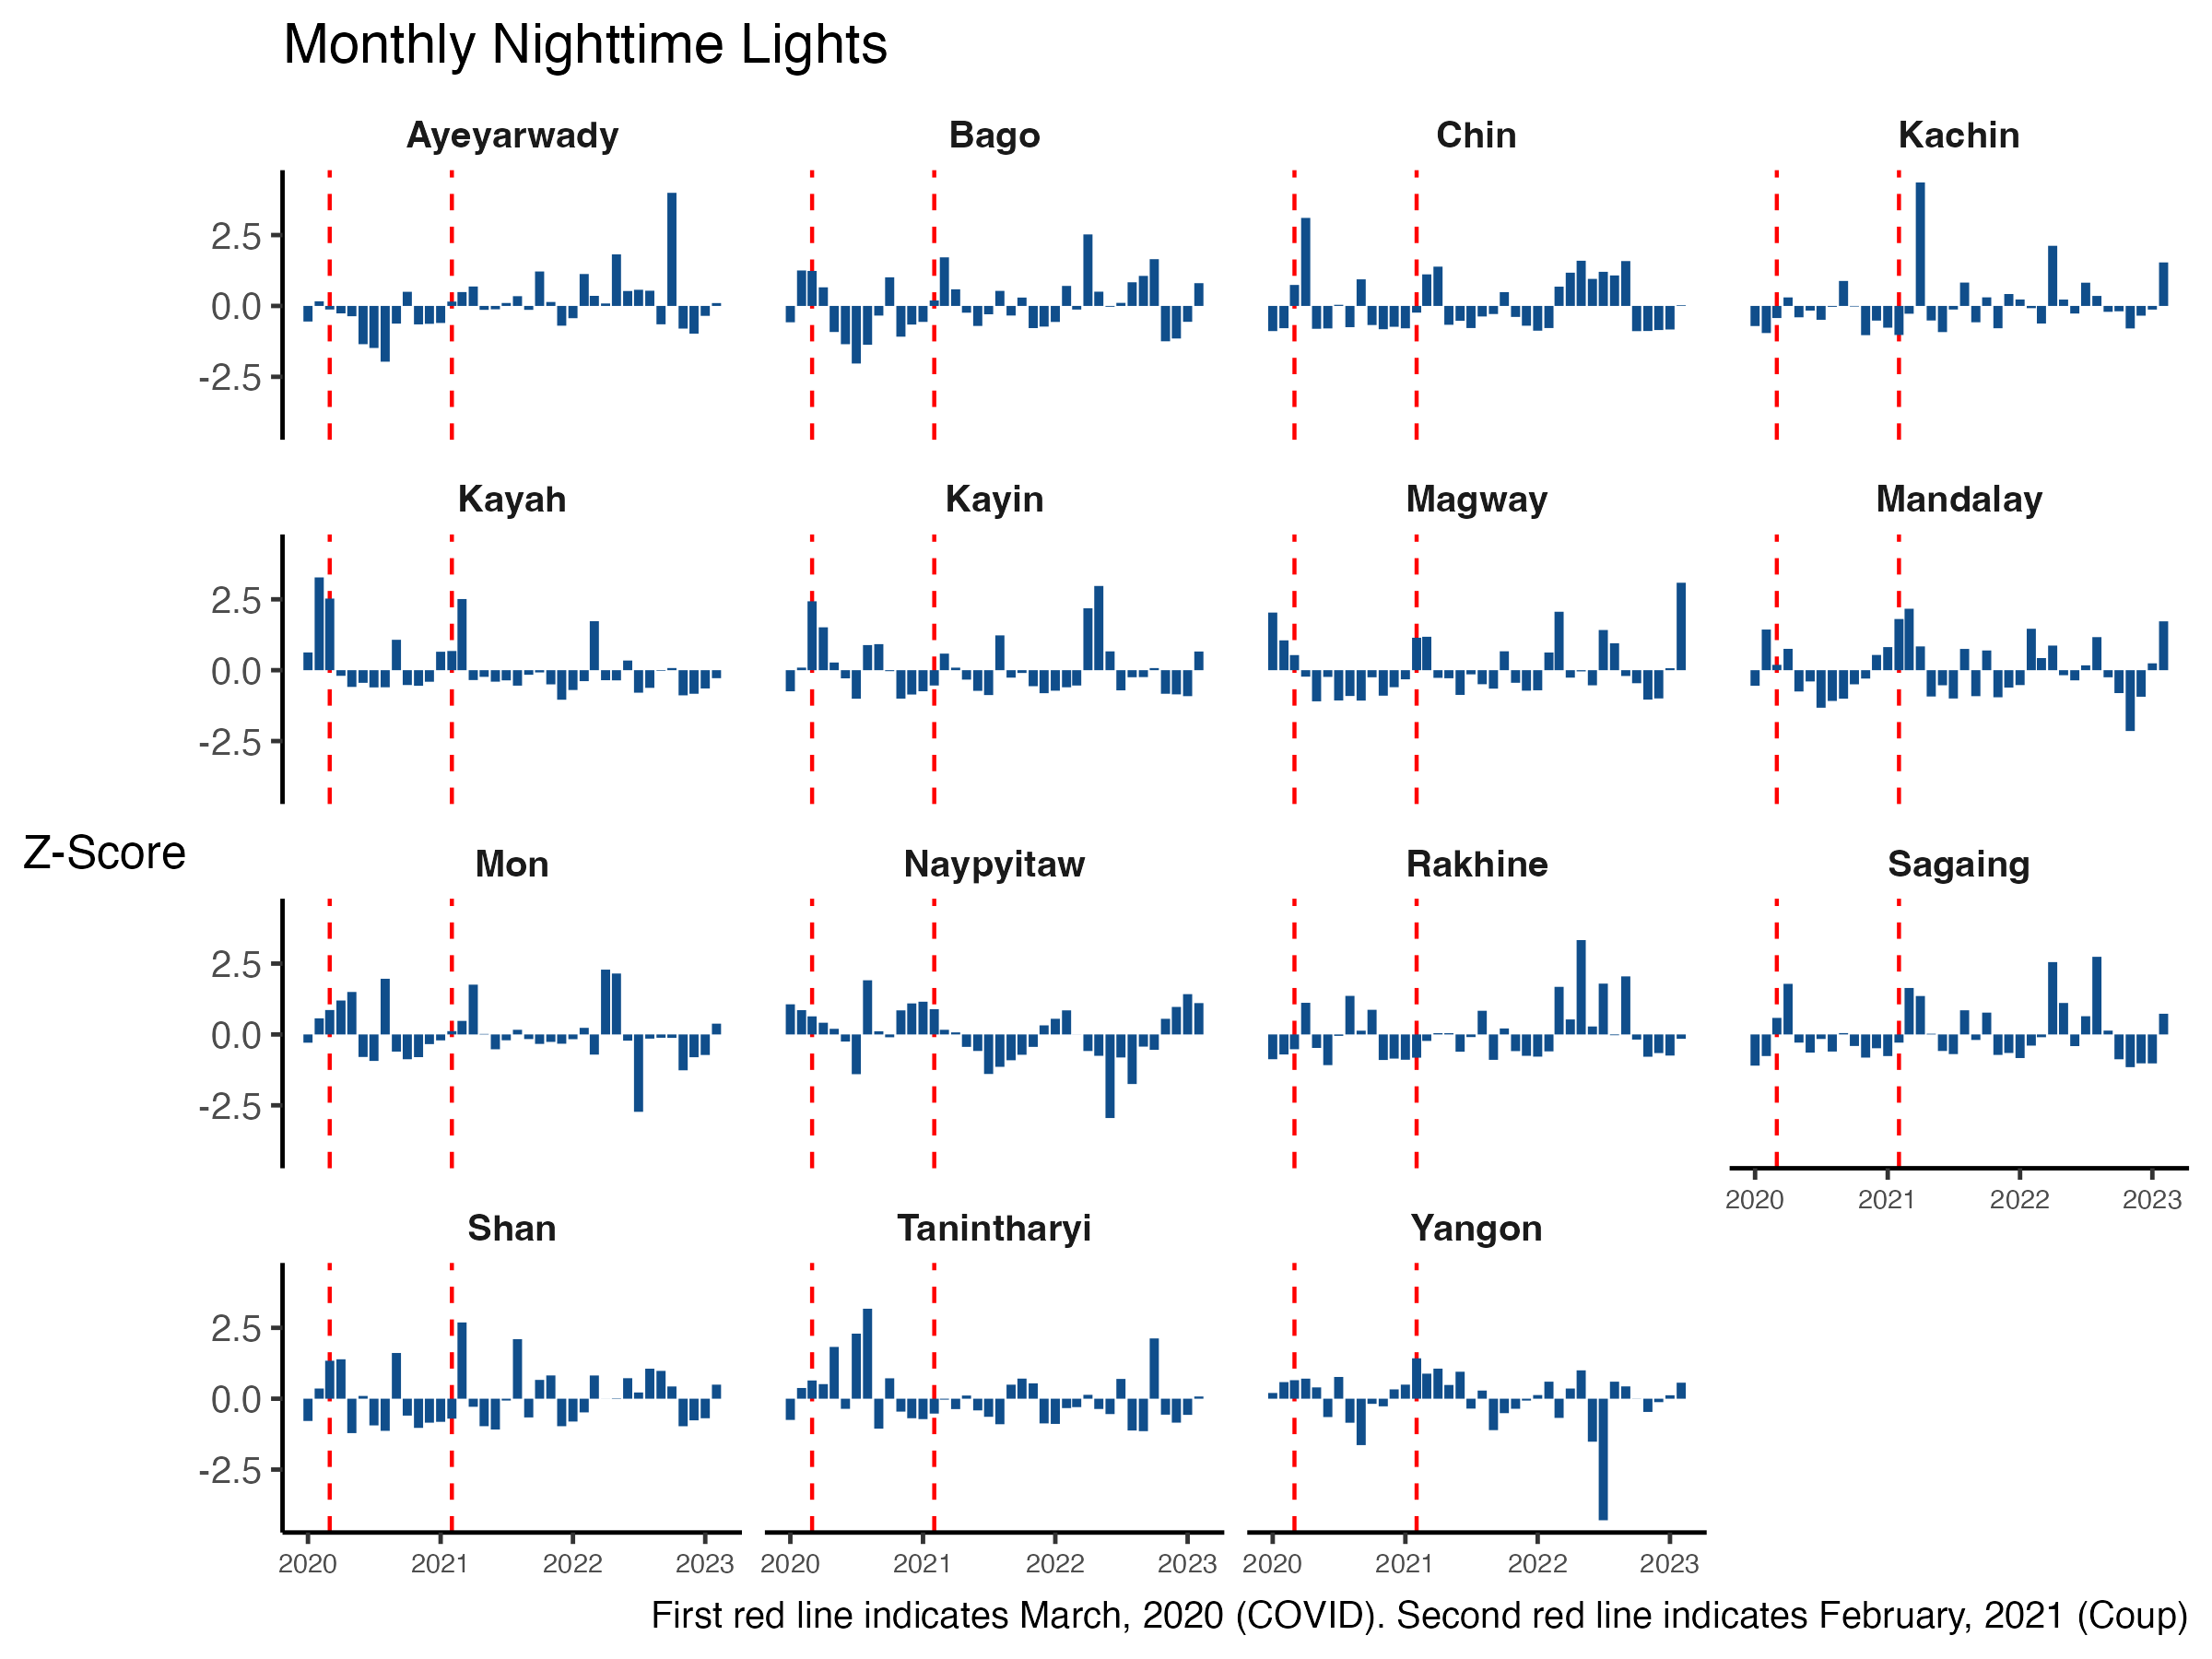
Maps of Changes in Nighttime Lights#
The below maps show the percent change in nighttime lights relative to 2019.
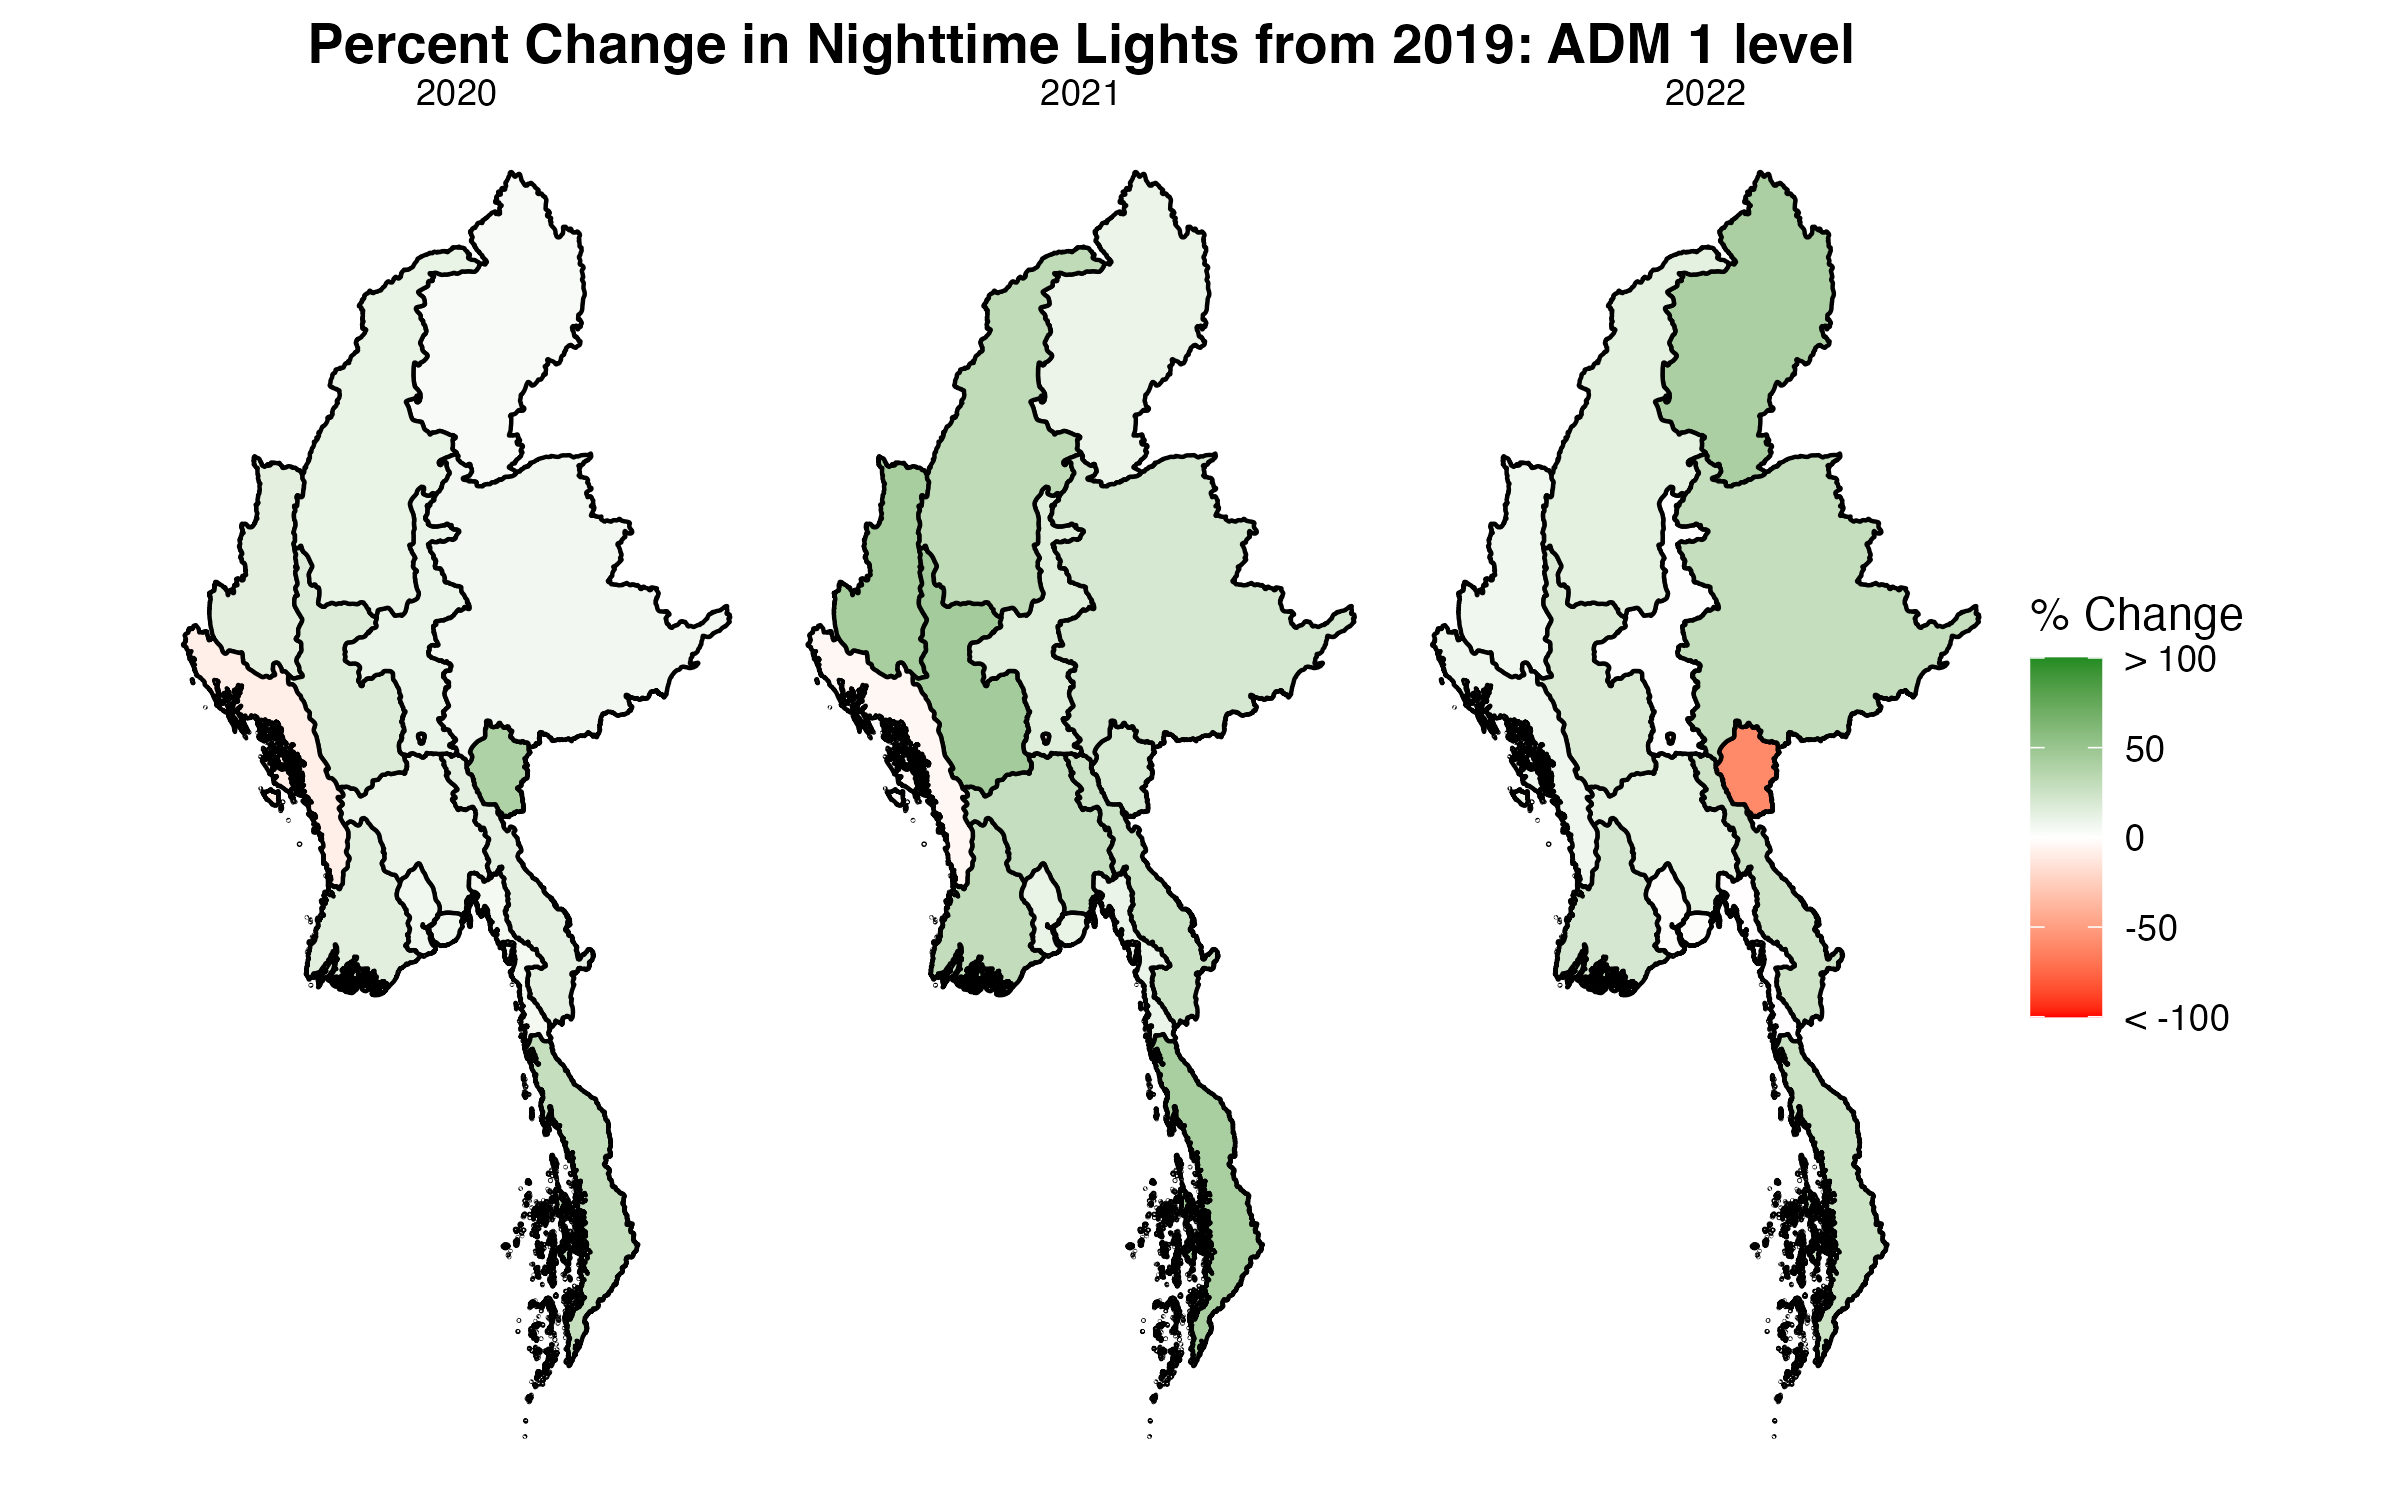
Fig. 7 Percent Change in Nighttime Lights: AMD 1 Level#
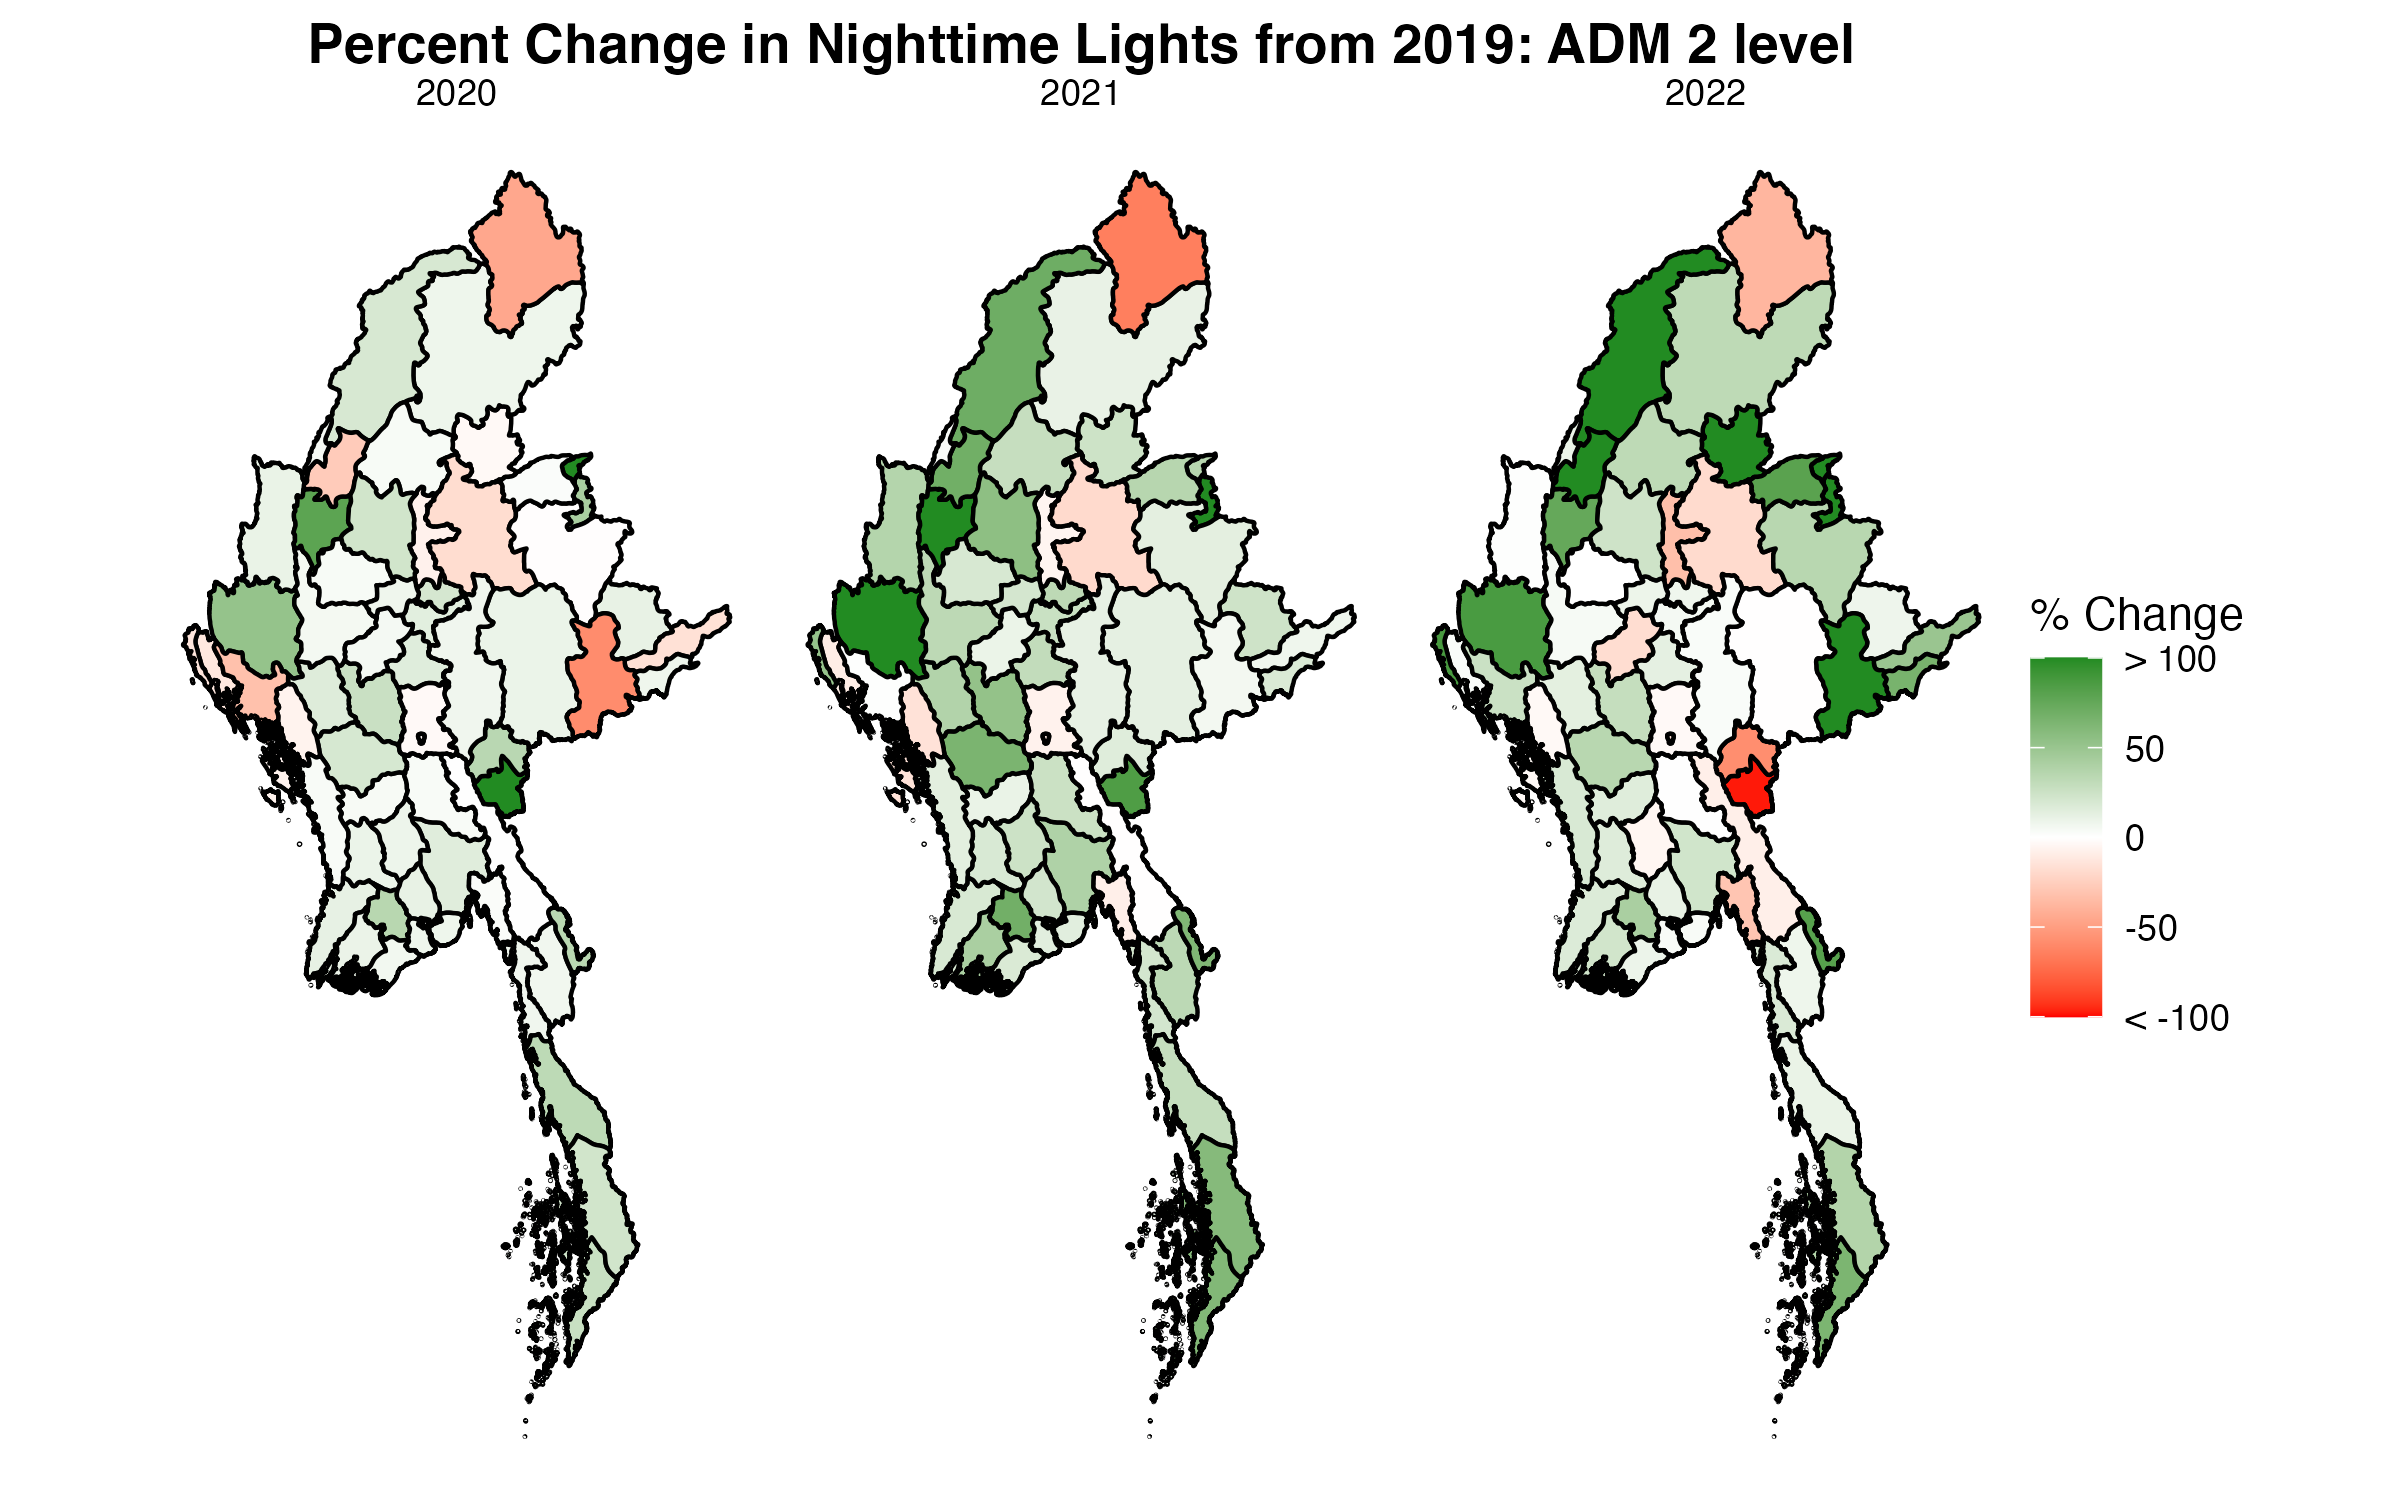
Fig. 8 Percent Change in Nighttime Lights: AMD 2 Level#
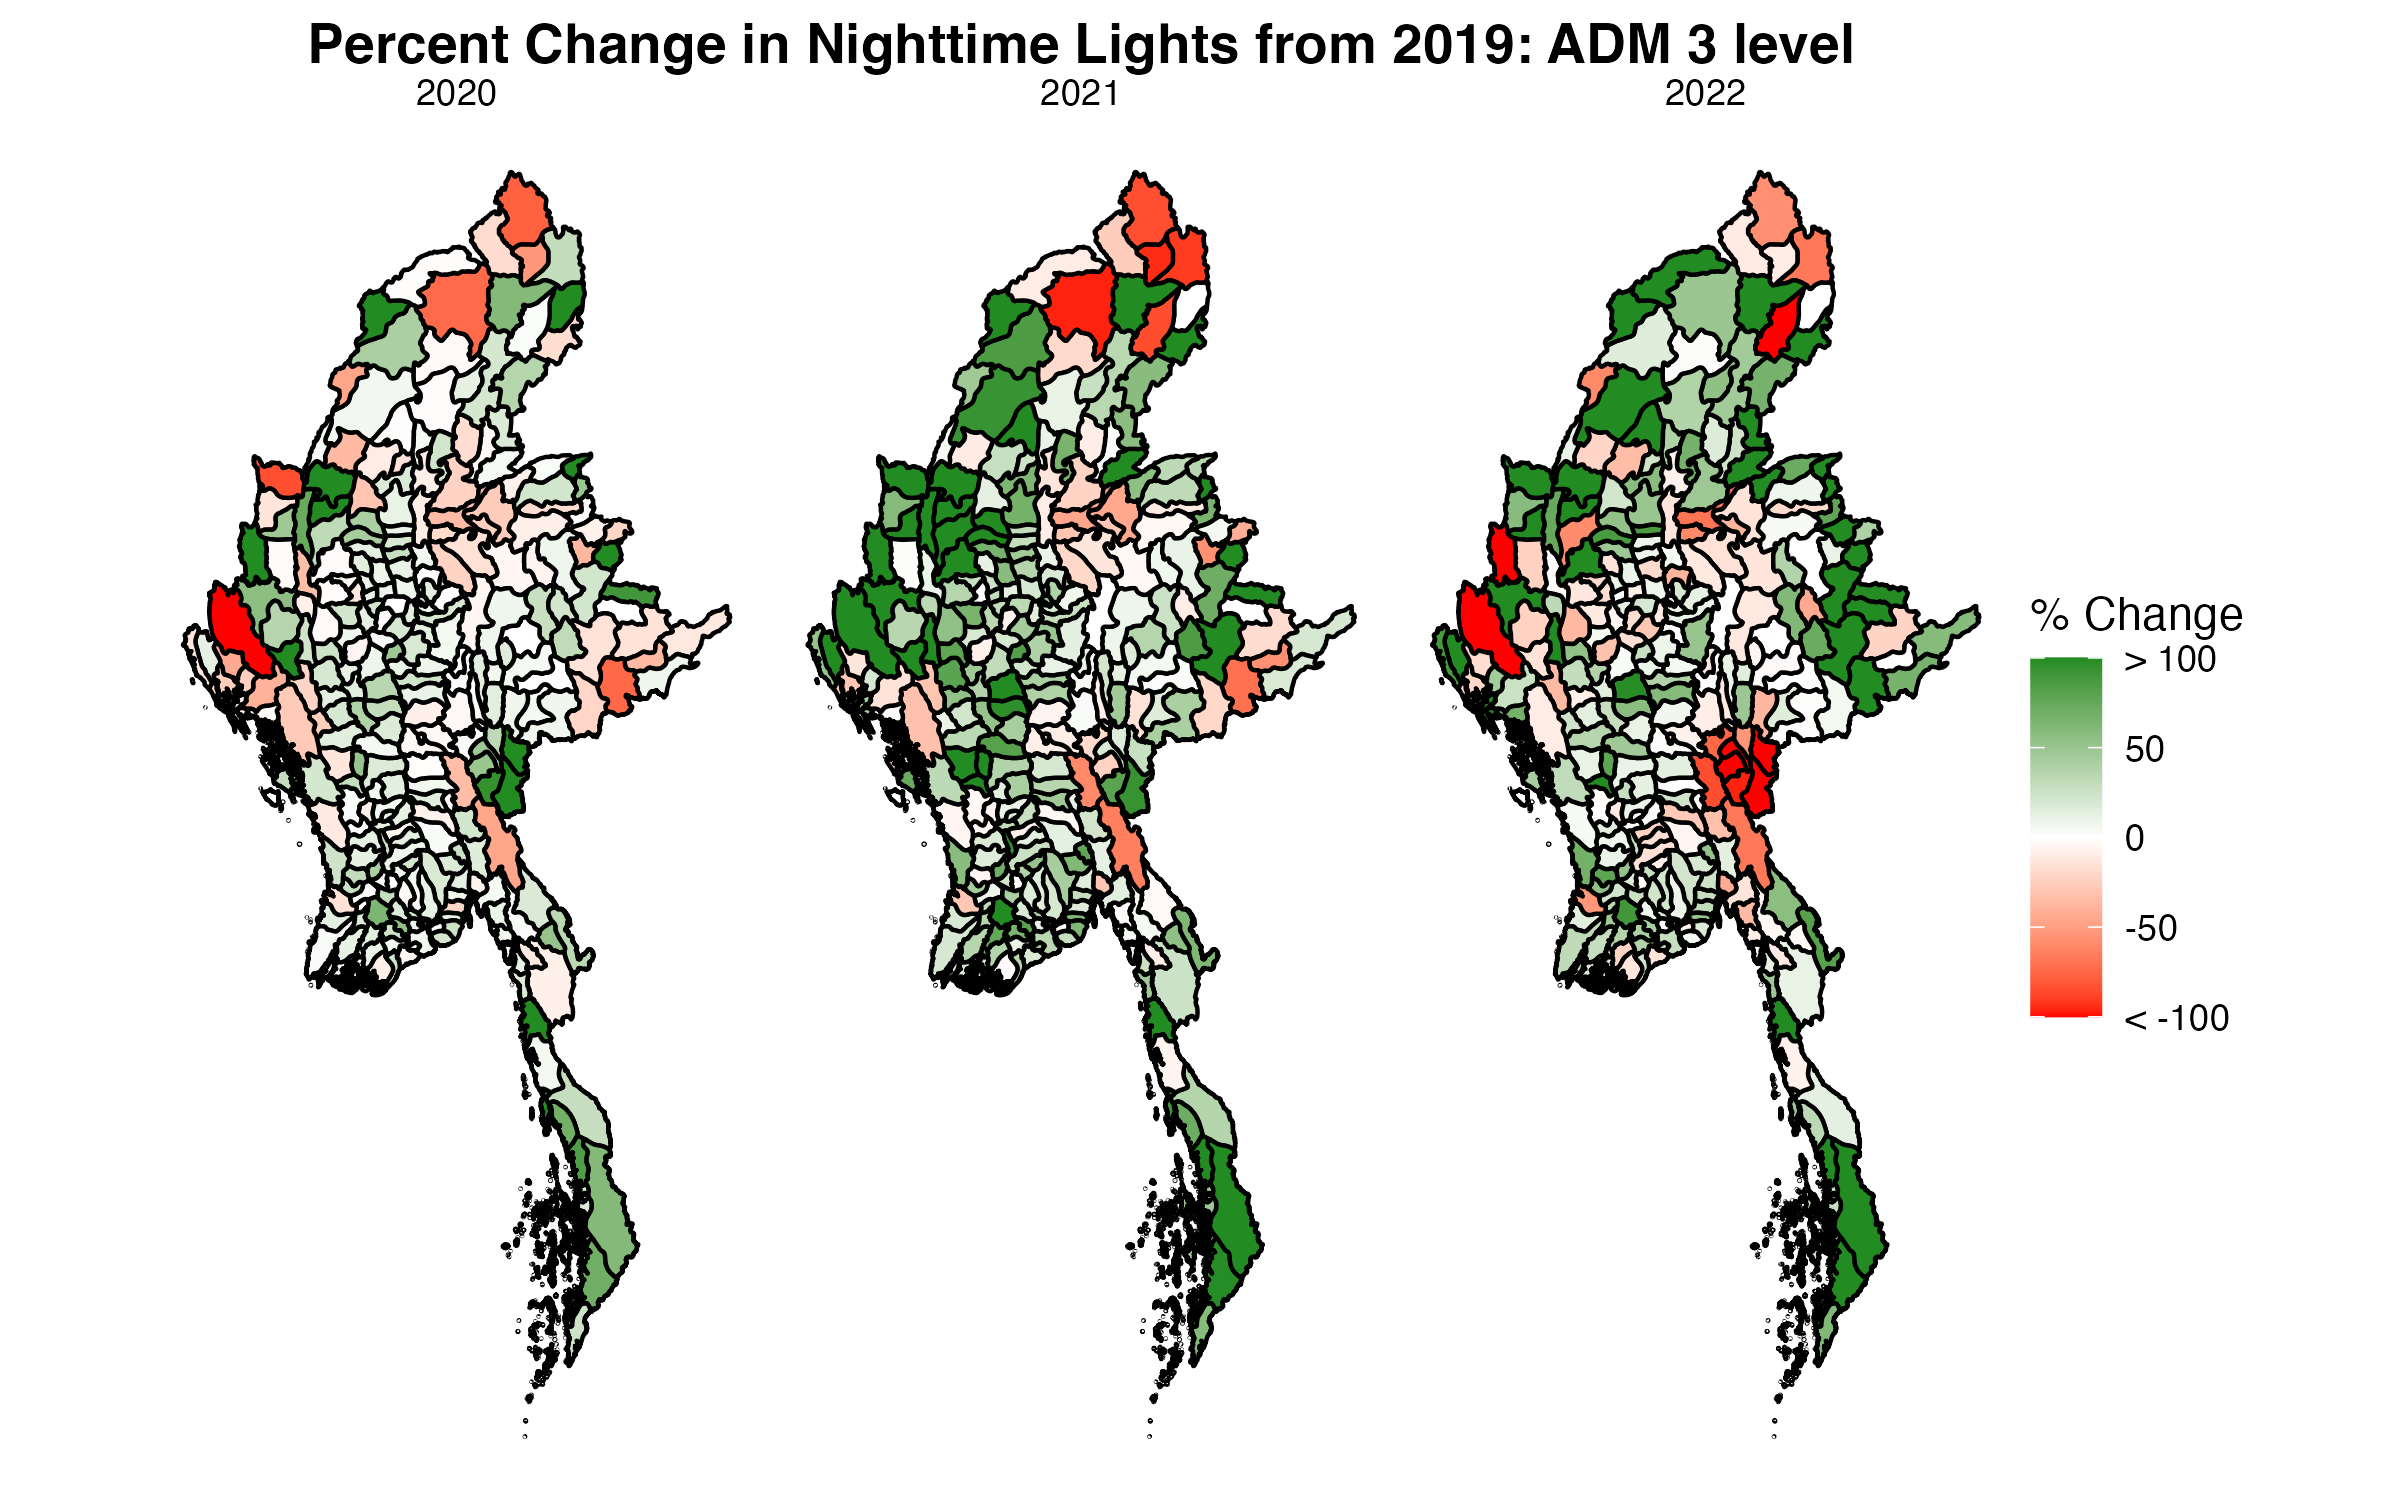
Fig. 9 Percent Change in Nighttime Lights: AMD 3 Level#
Gas Flaring Nighttime Lights#
The below figure shows the location of inland gas flaring locations, which are concentrated within one location in Myanmar.
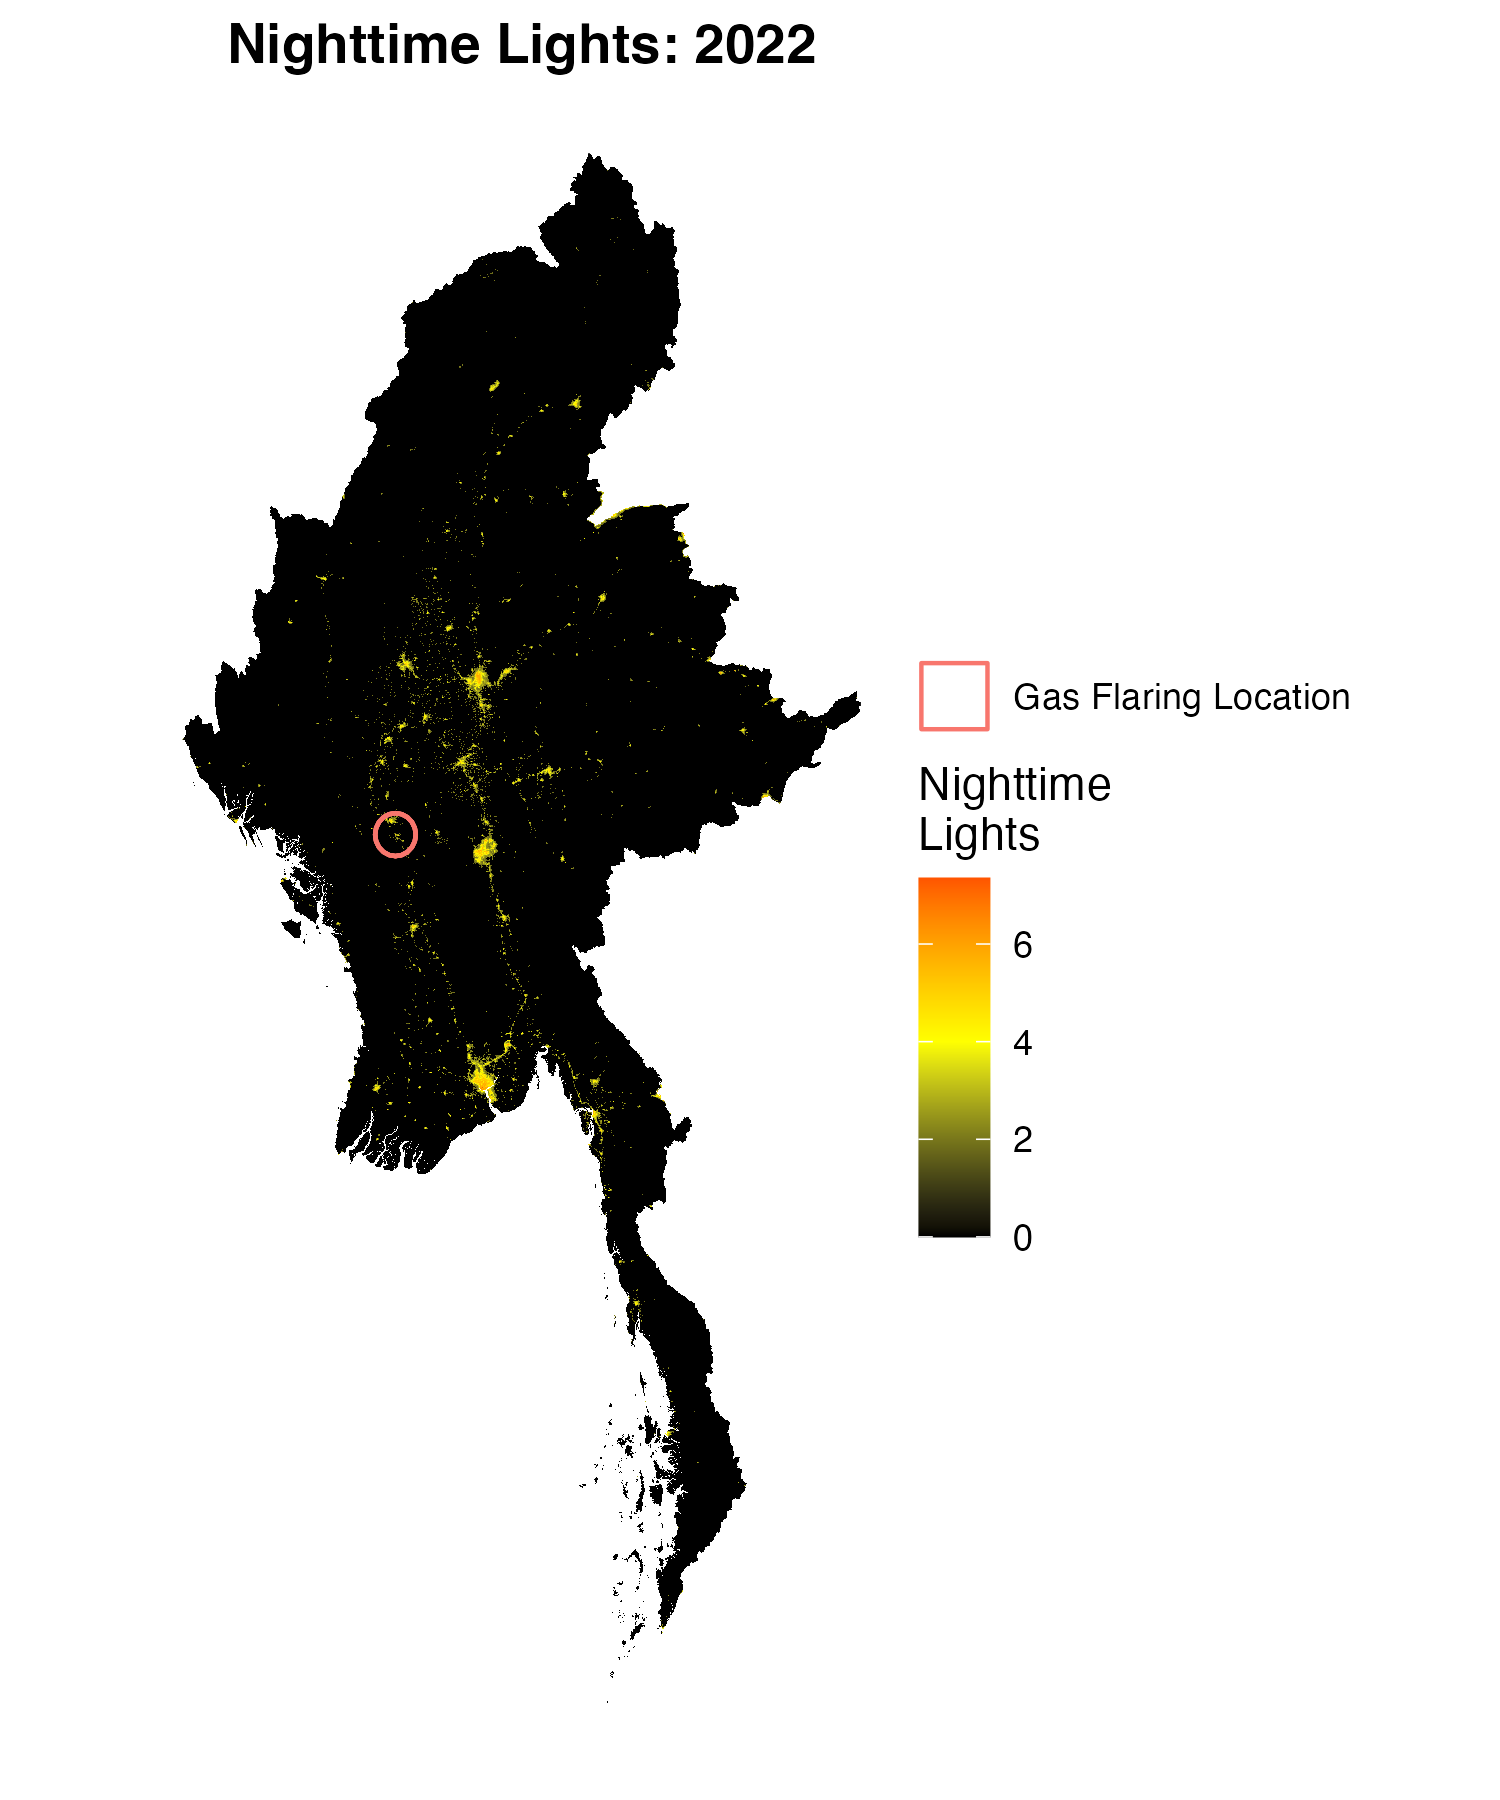
Fig. 10 Gas Flaring Map#
The below figure shows trends in nighttime lights in gas flaring locations.
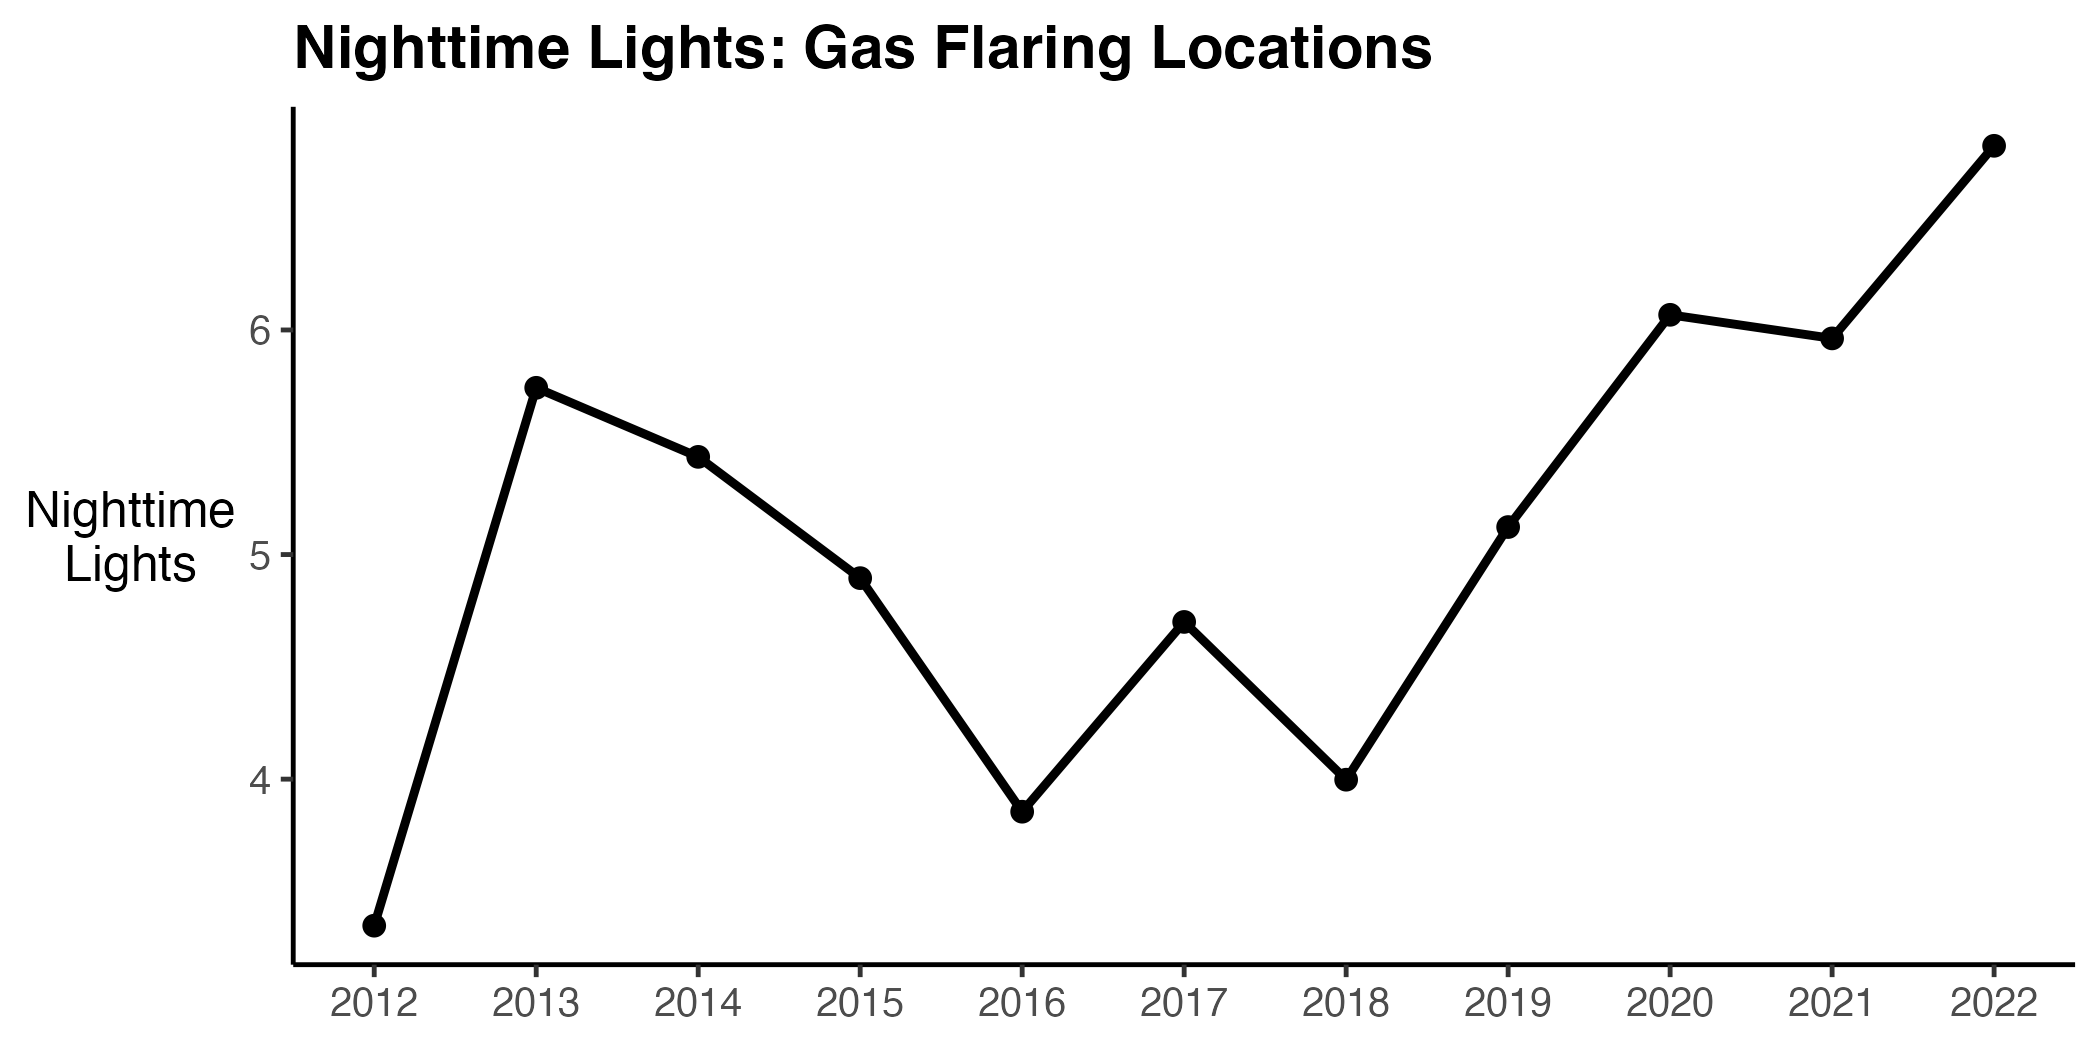
Fig. 11 Trends in nighttime lights in gas flaring locations#
Special Economic Zones#
The below figure shows trends in nighttime lights within special economic zones, averaged across special economic zones.
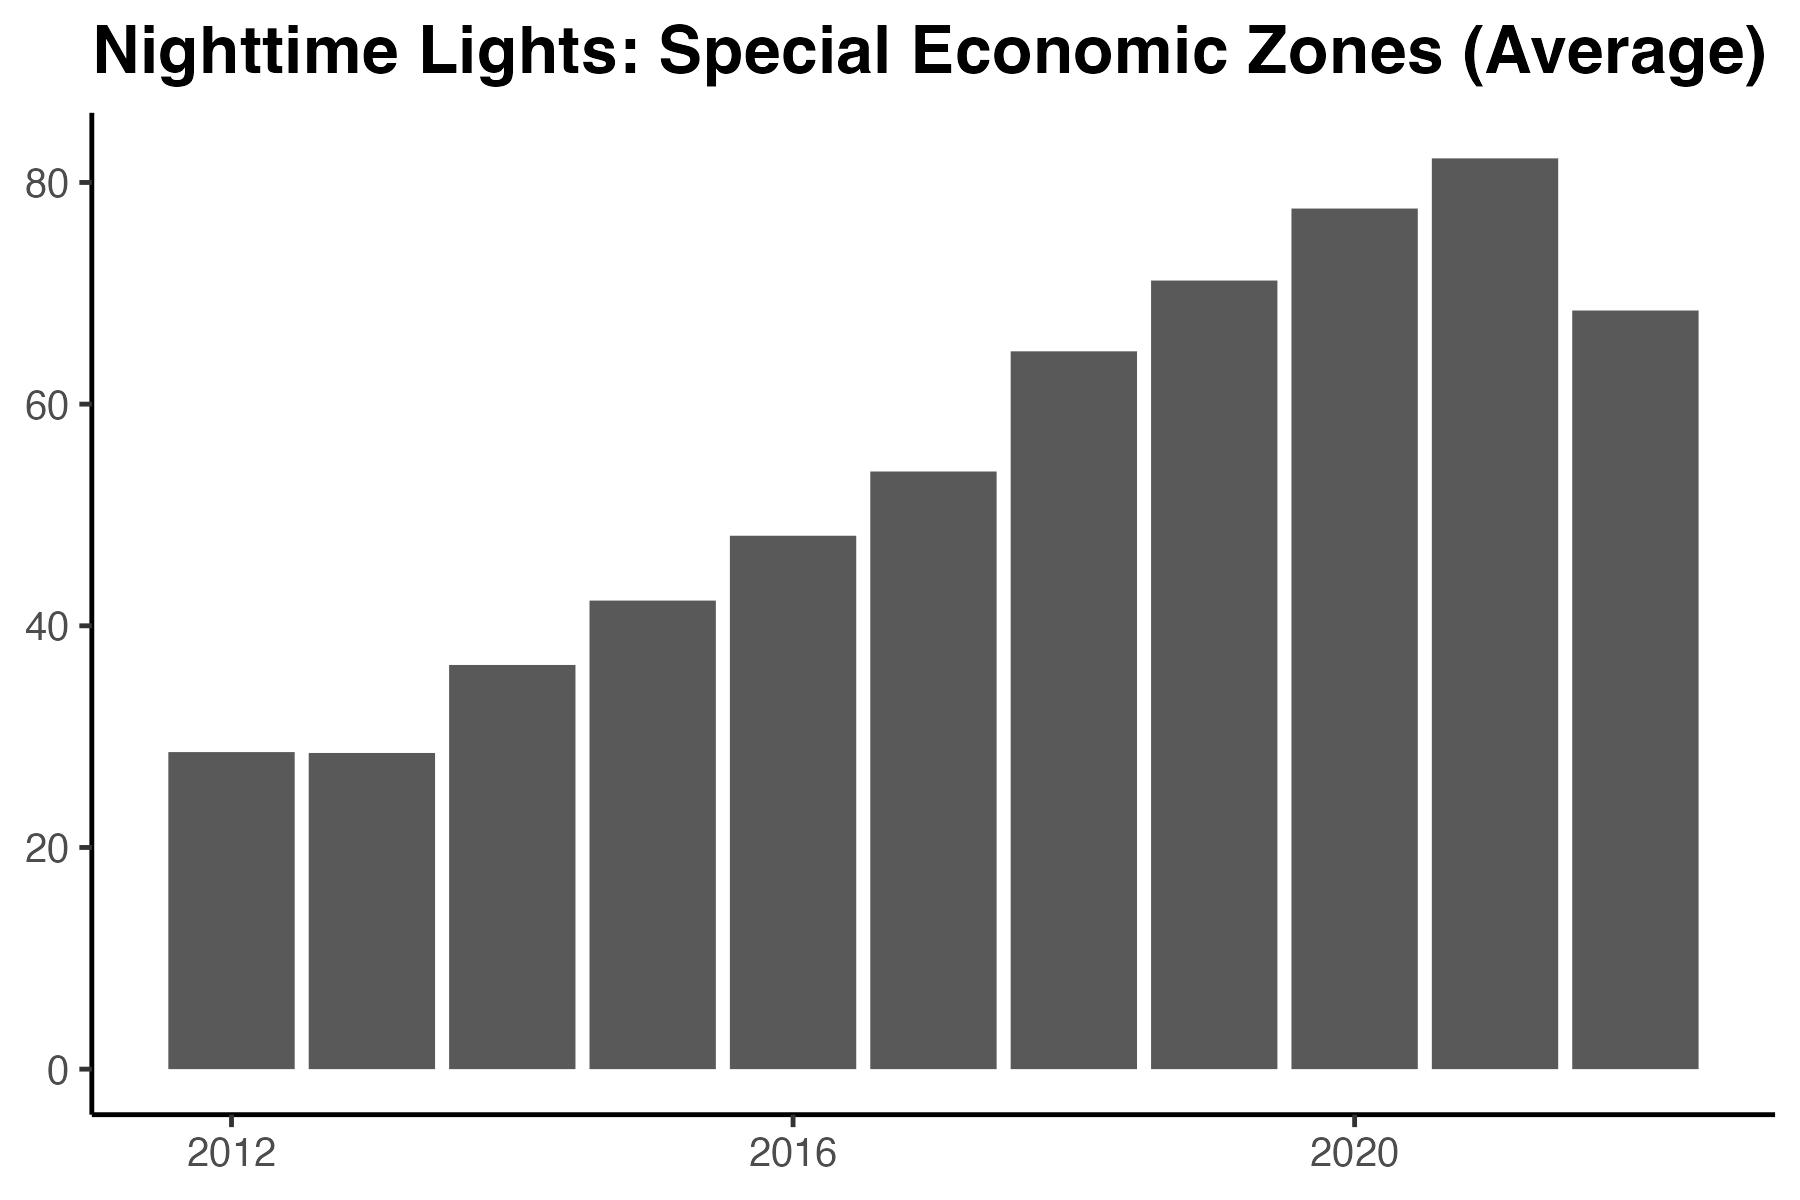
Fig. 12 Change in nighttime lights from 2012 to 2022 in Special Economic Zones, averaged across zones#
The below figure shows trends in nighttime lights within special economic zones.
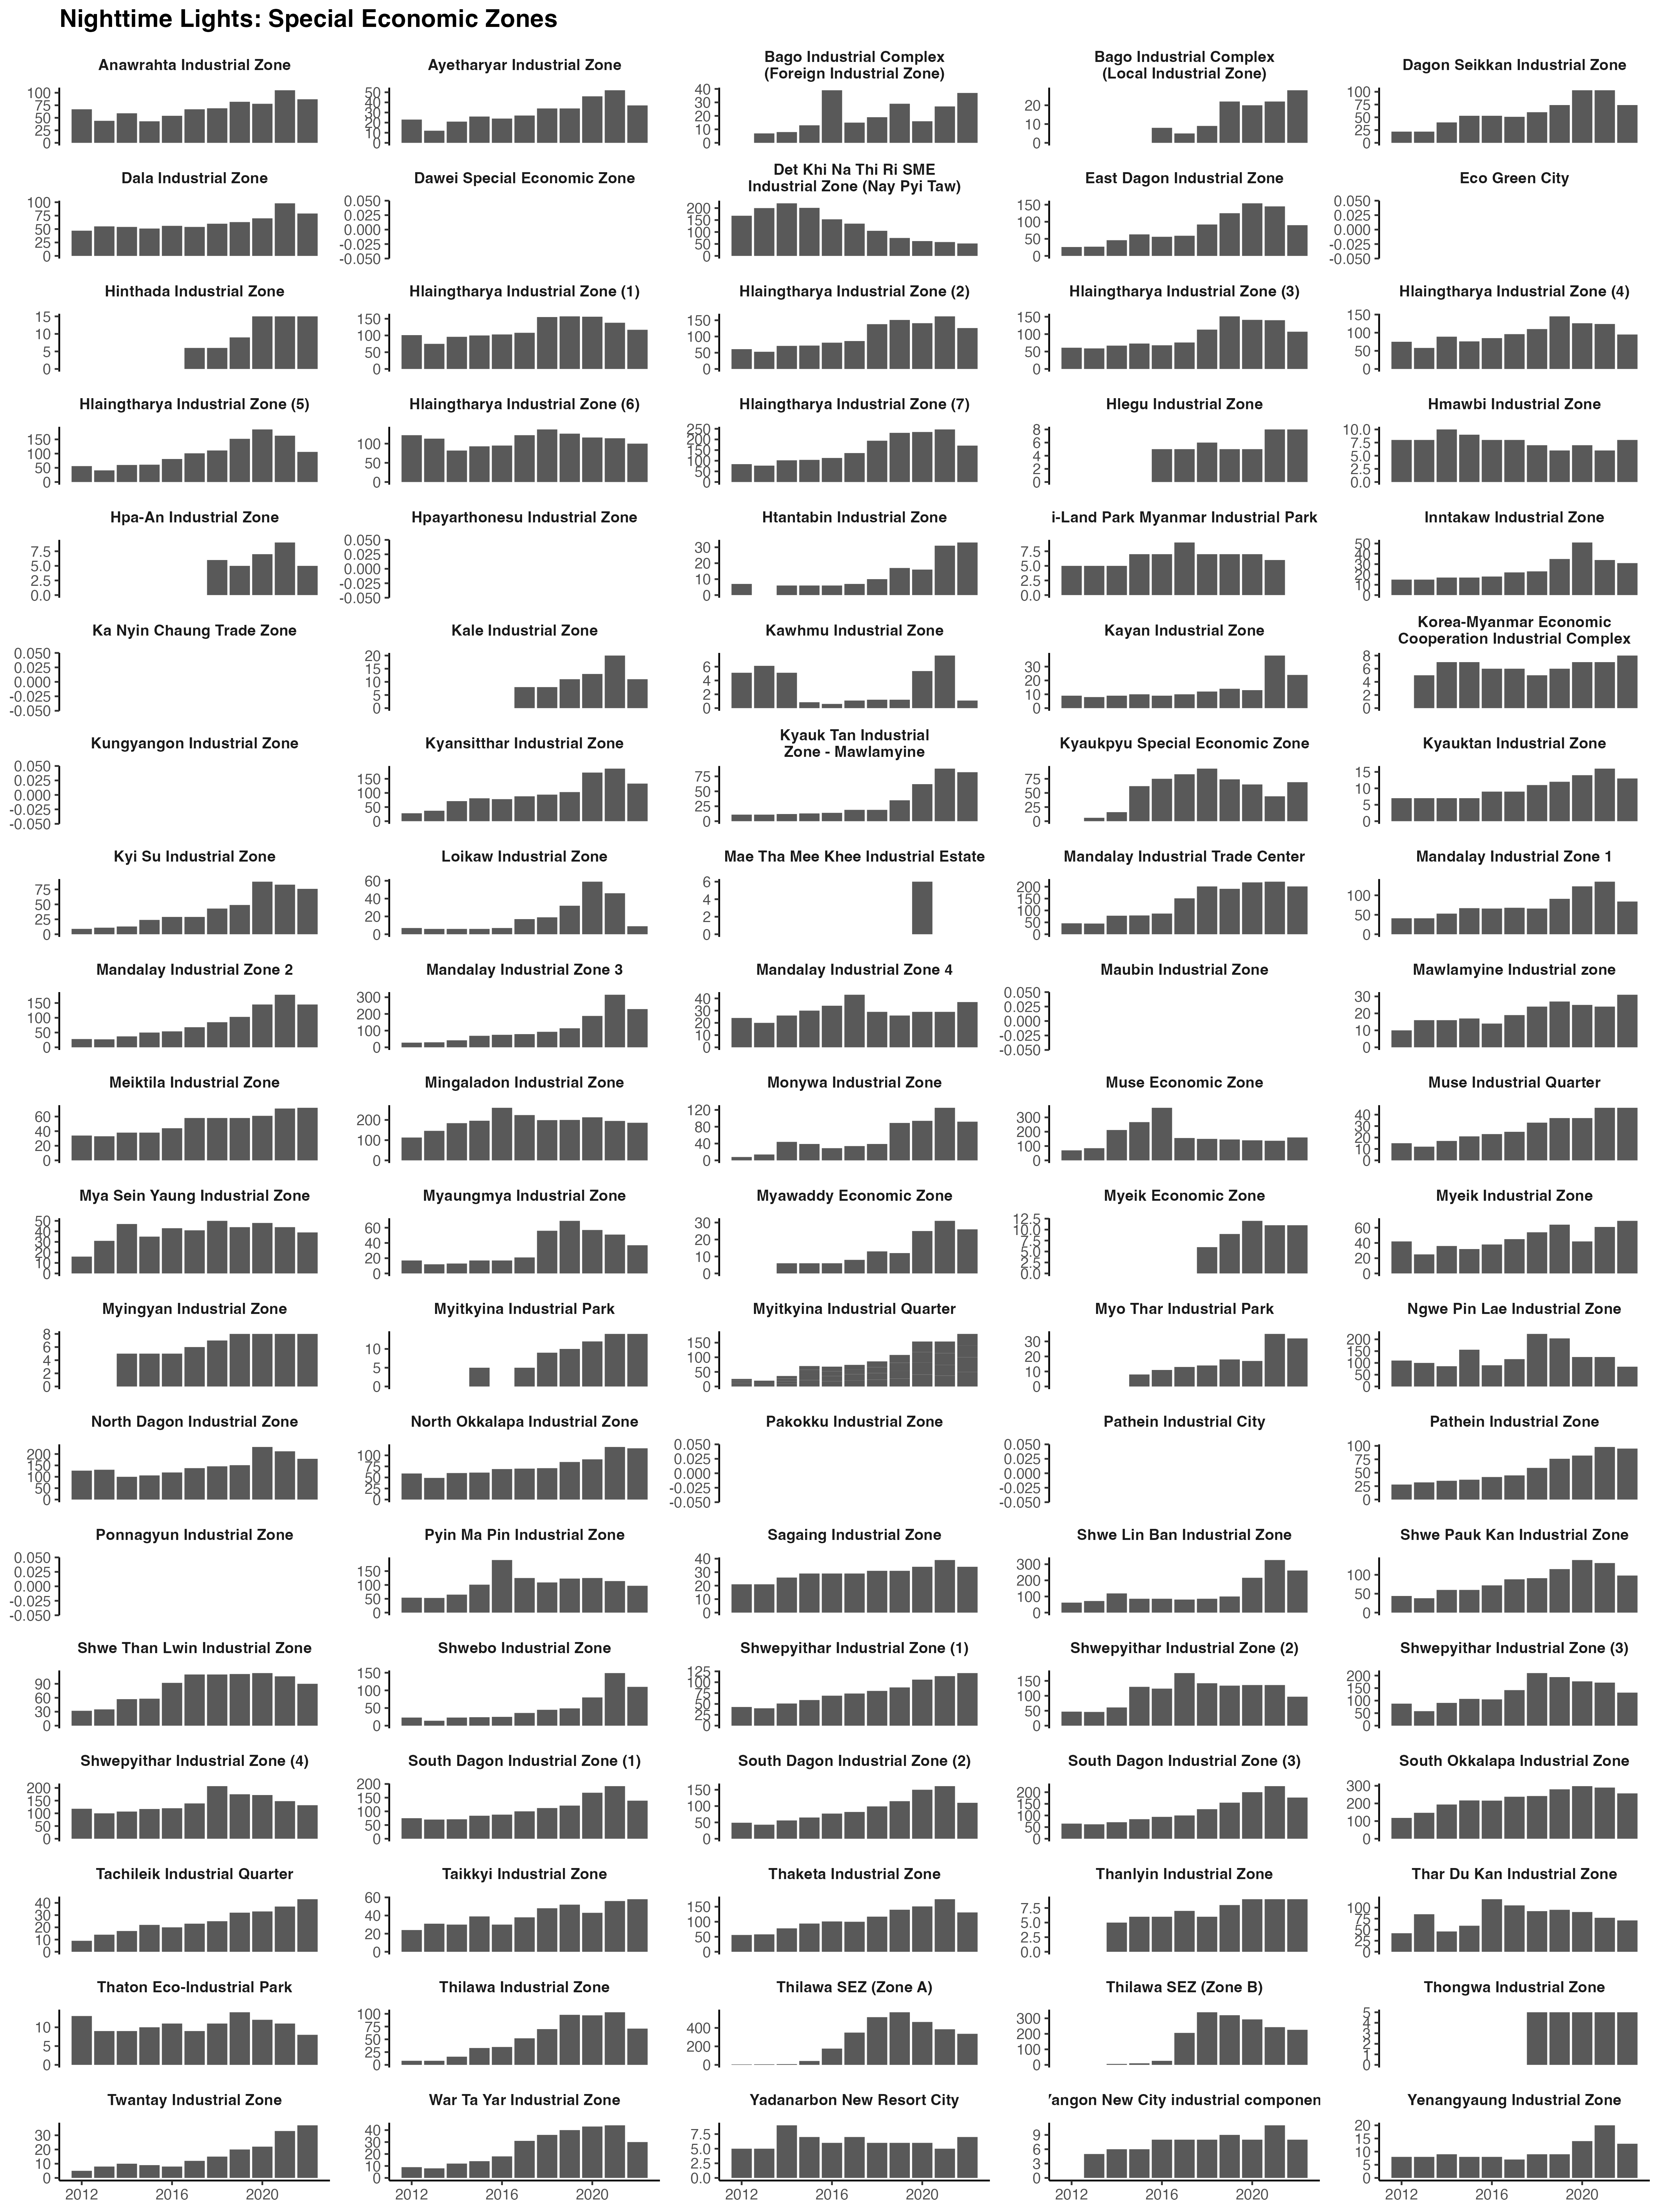
Fig. 13 Change in nighttime lights from 2012 to 2022 in Special Economic Zones#
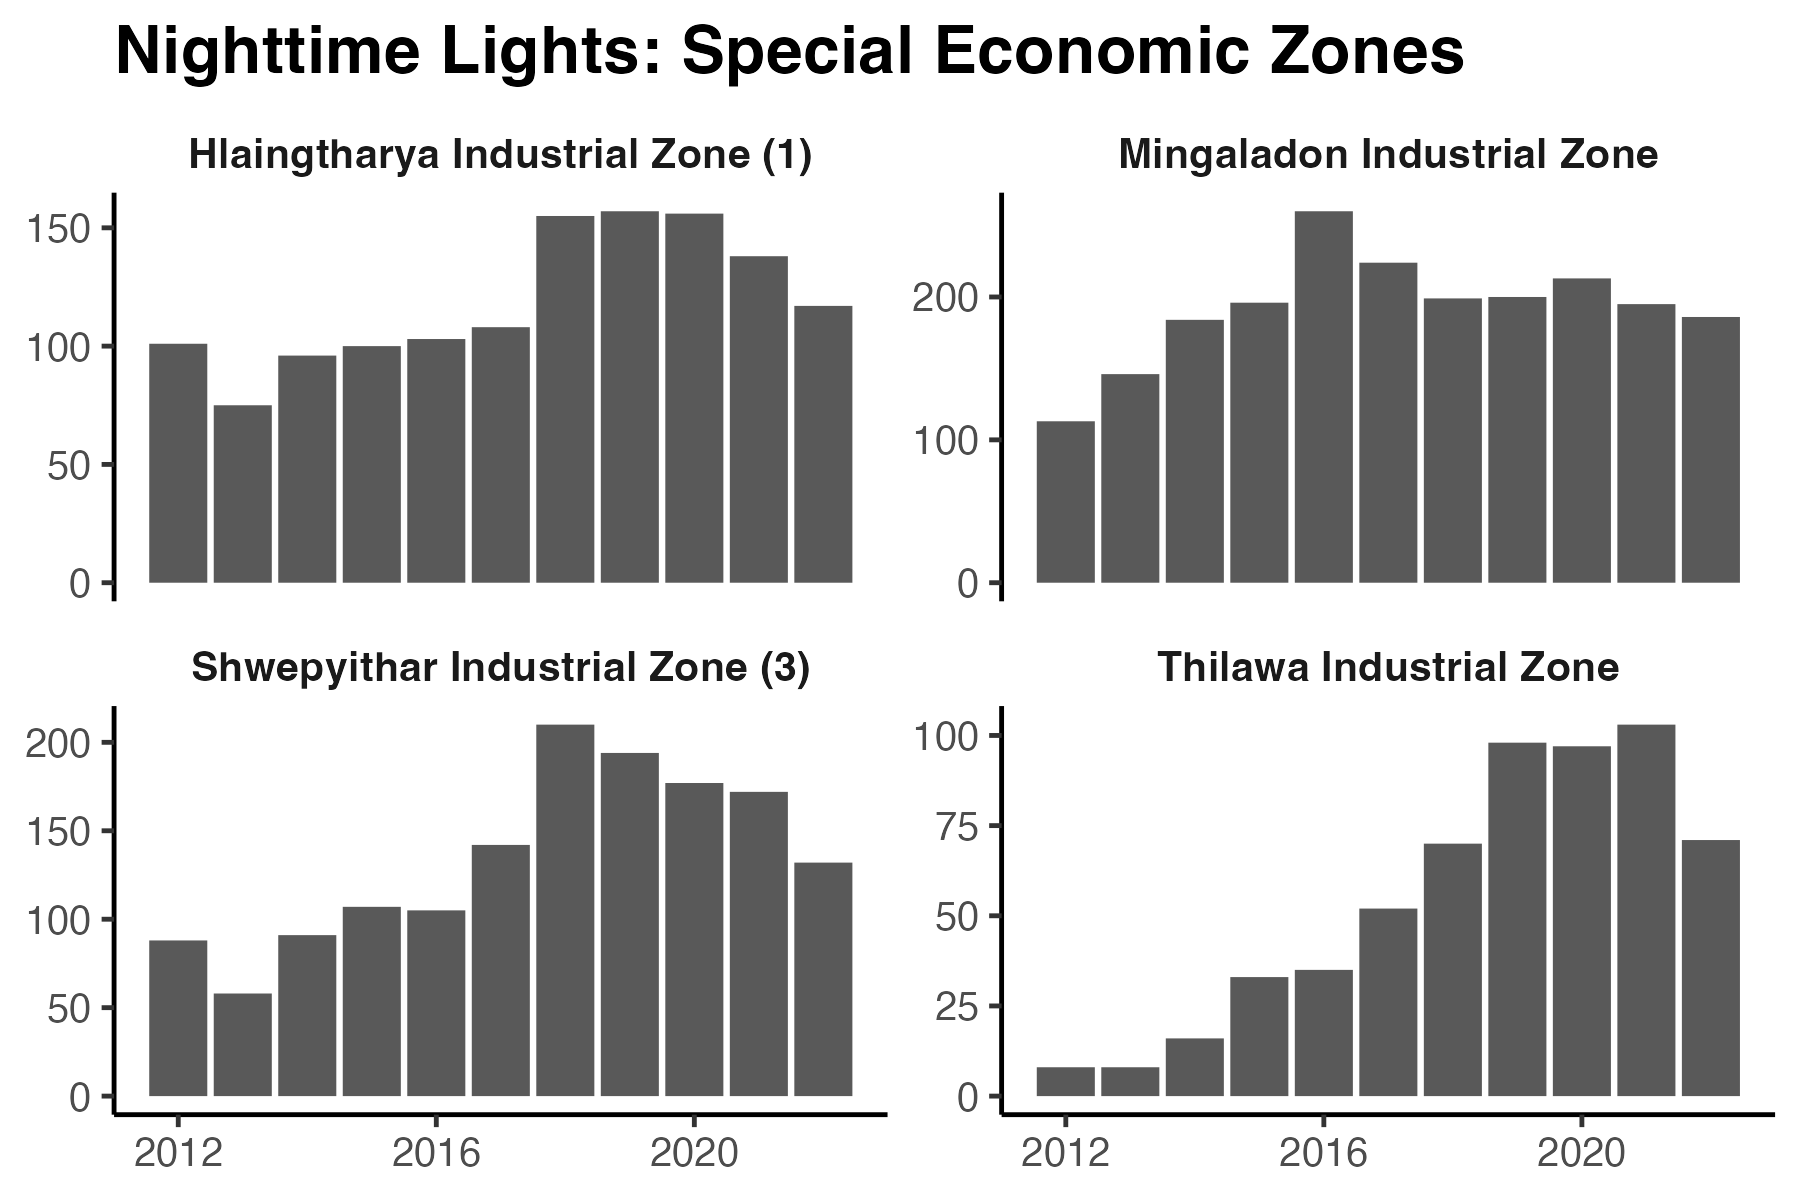
Fig. 14 Change in nighttime lights from 2012 to 2022 in Select Special Economic Zones#
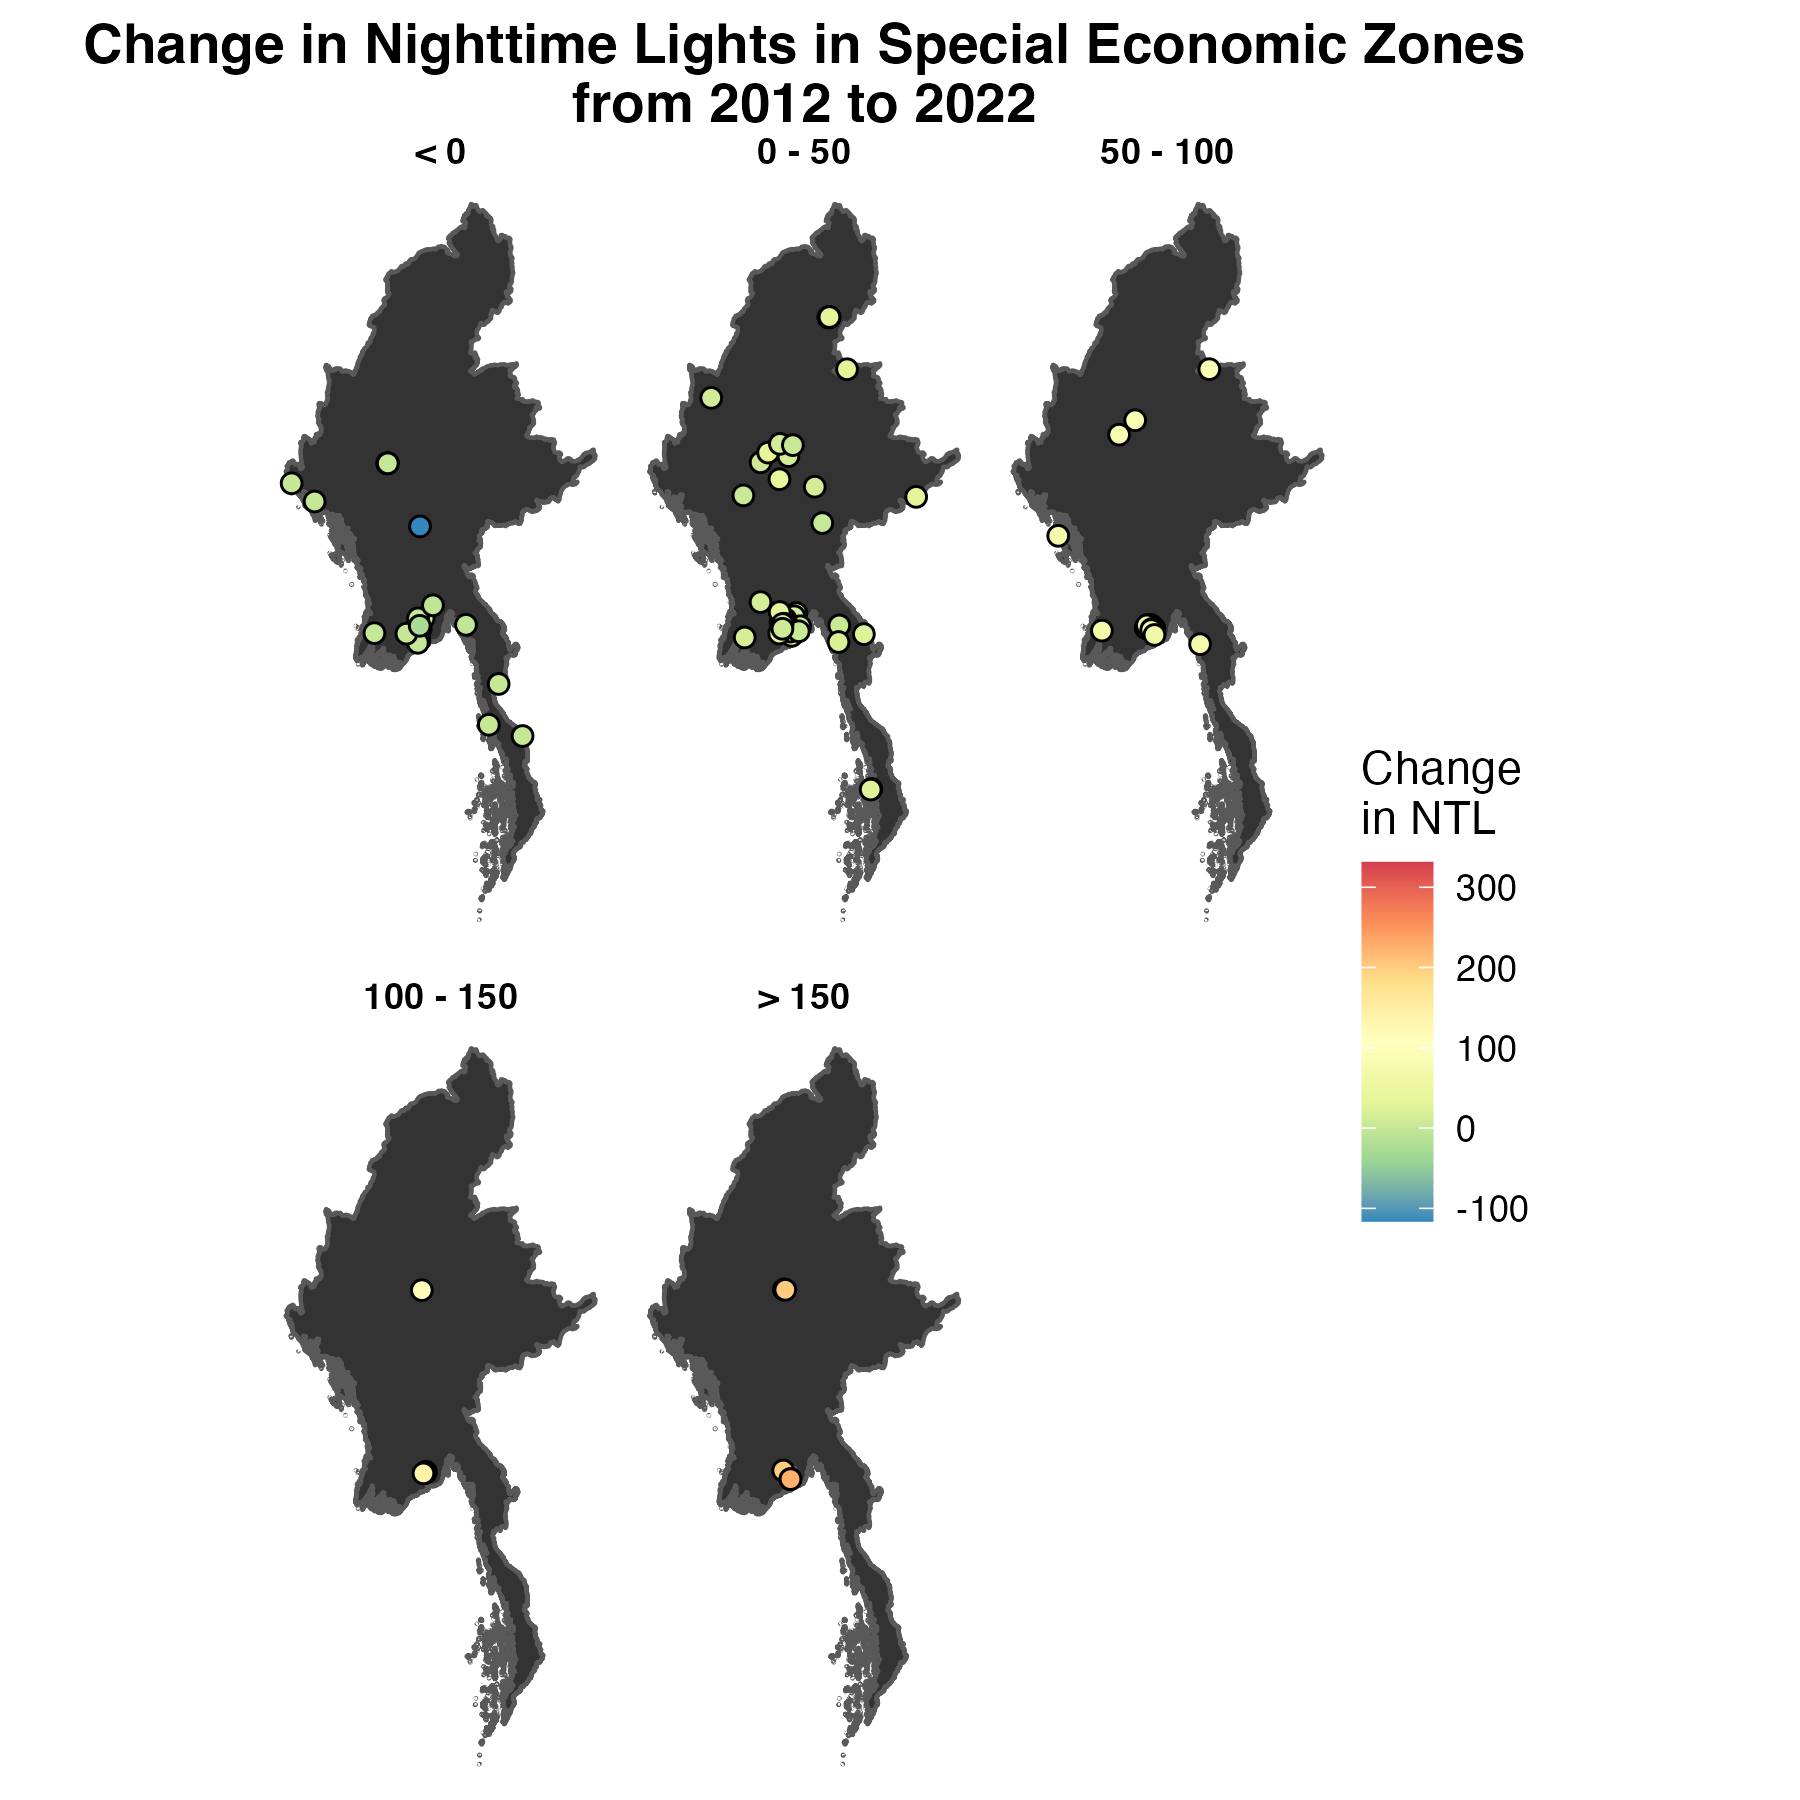
Fig. 15 Change in nighttime lights from 2012 to 2022 in Special Economic Zones#
GDP vs Nighttime Lights: Annual#
This section explores the association between GDP and nighttime lights using annual data. We use data since 2012, the start of the nighttime lights data.
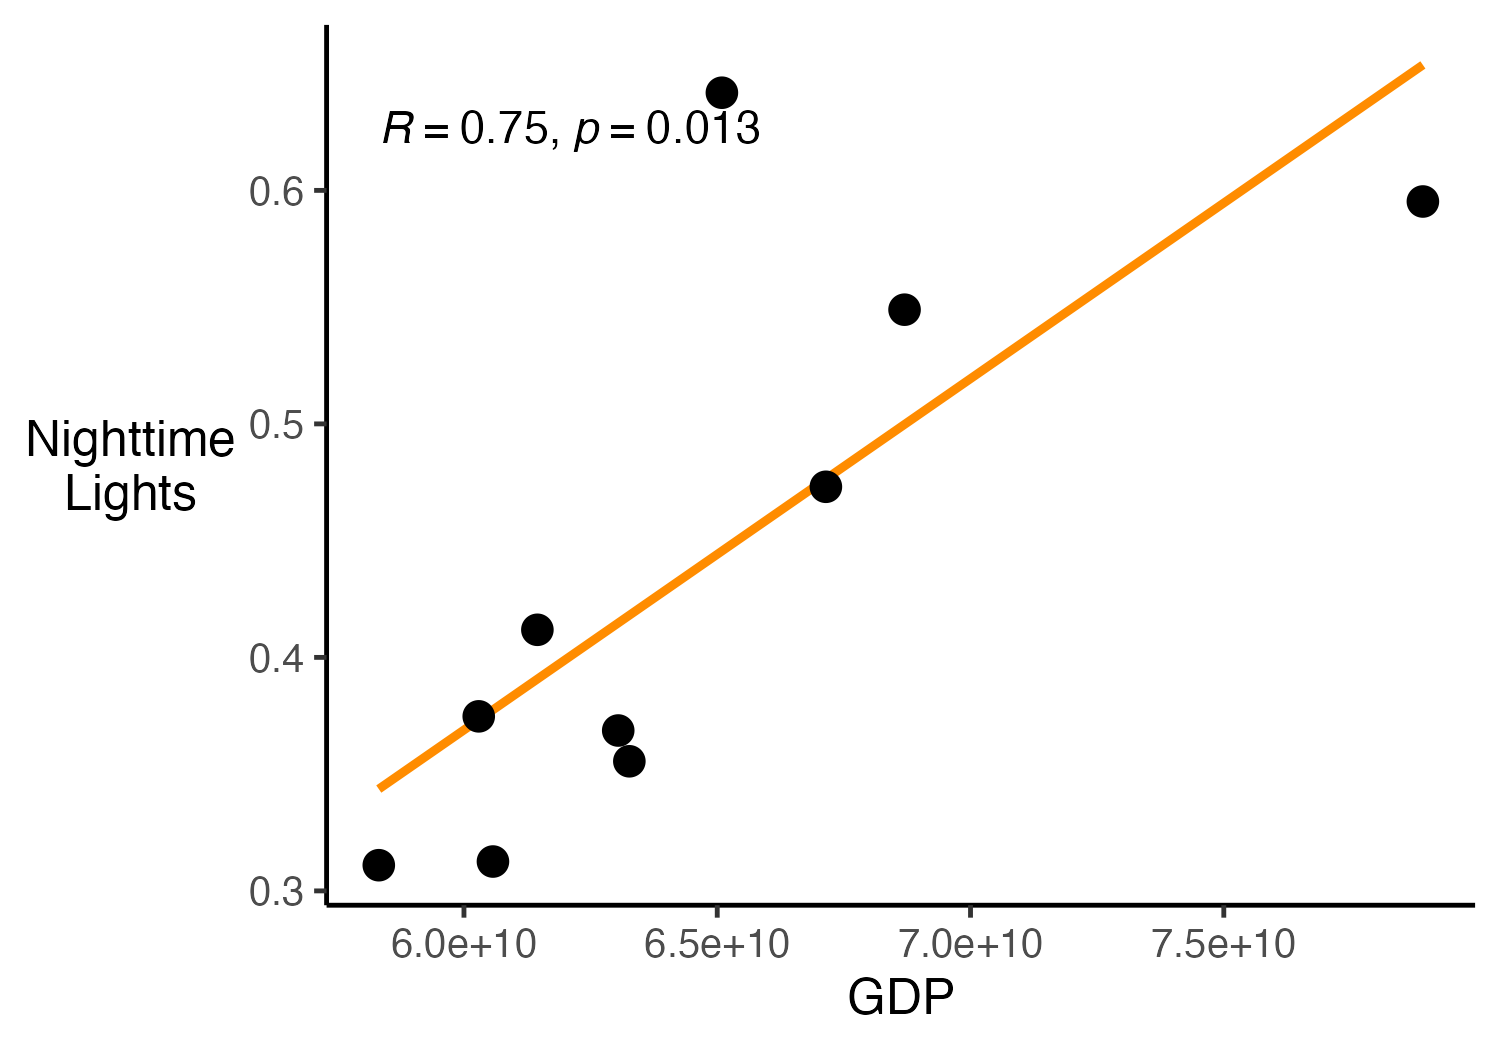
Fig. 16 Association between Nighttime Lights and GDP#
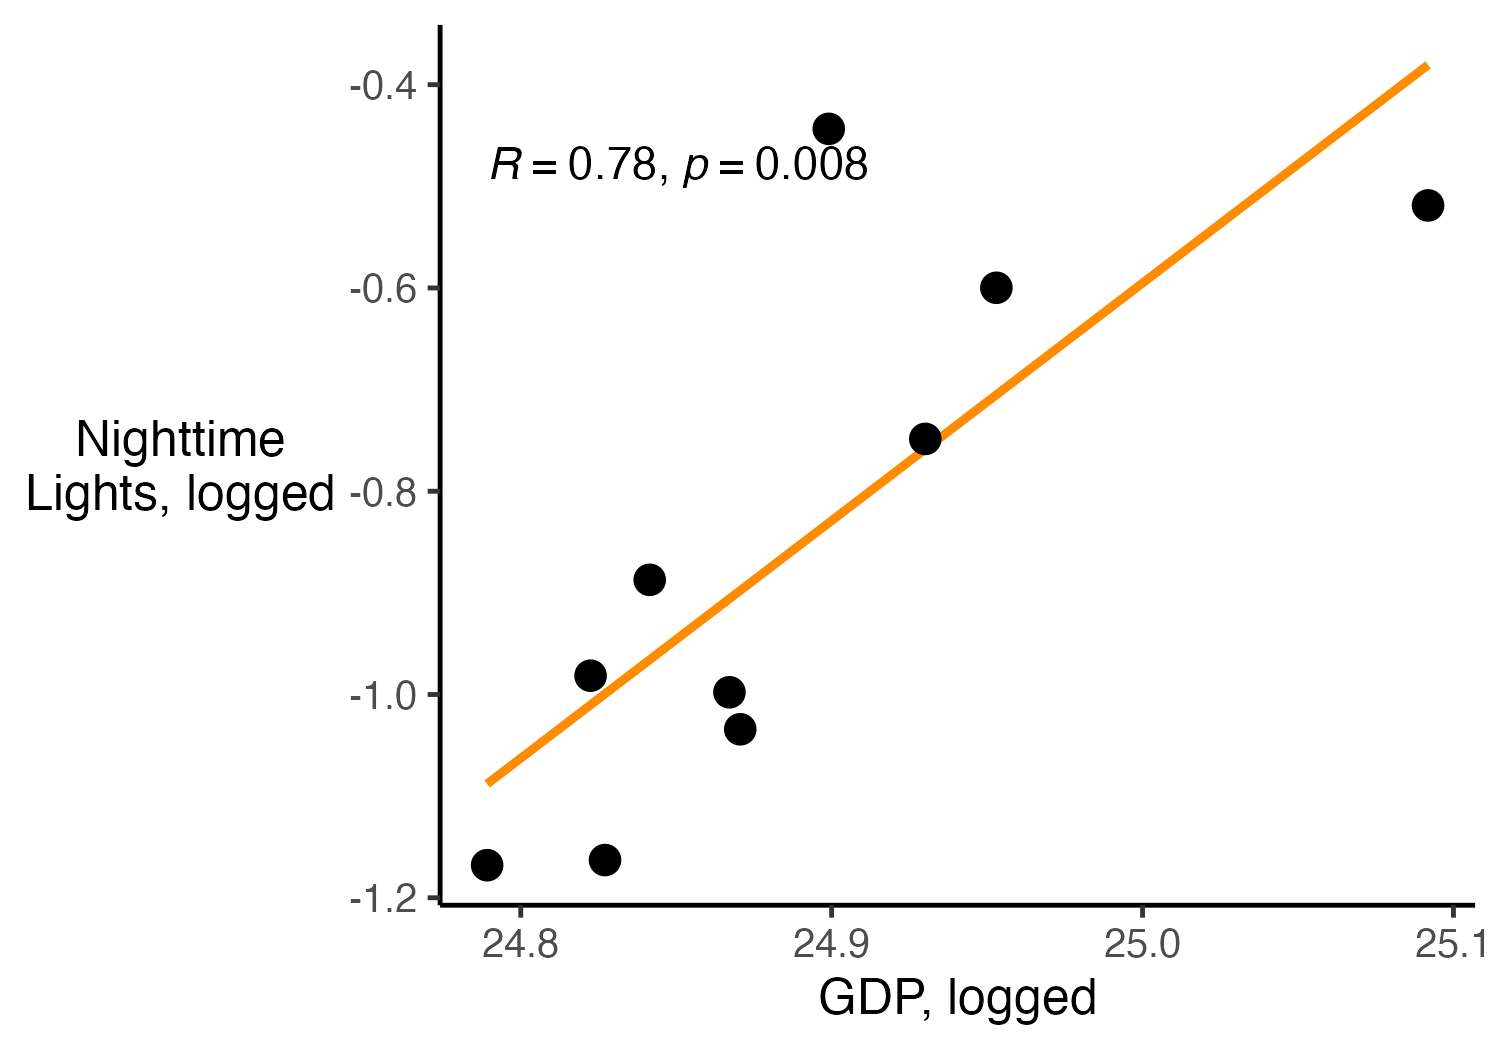
Fig. 17 Association between Nighttime Lights and GDP, logging both NTL and GDP#
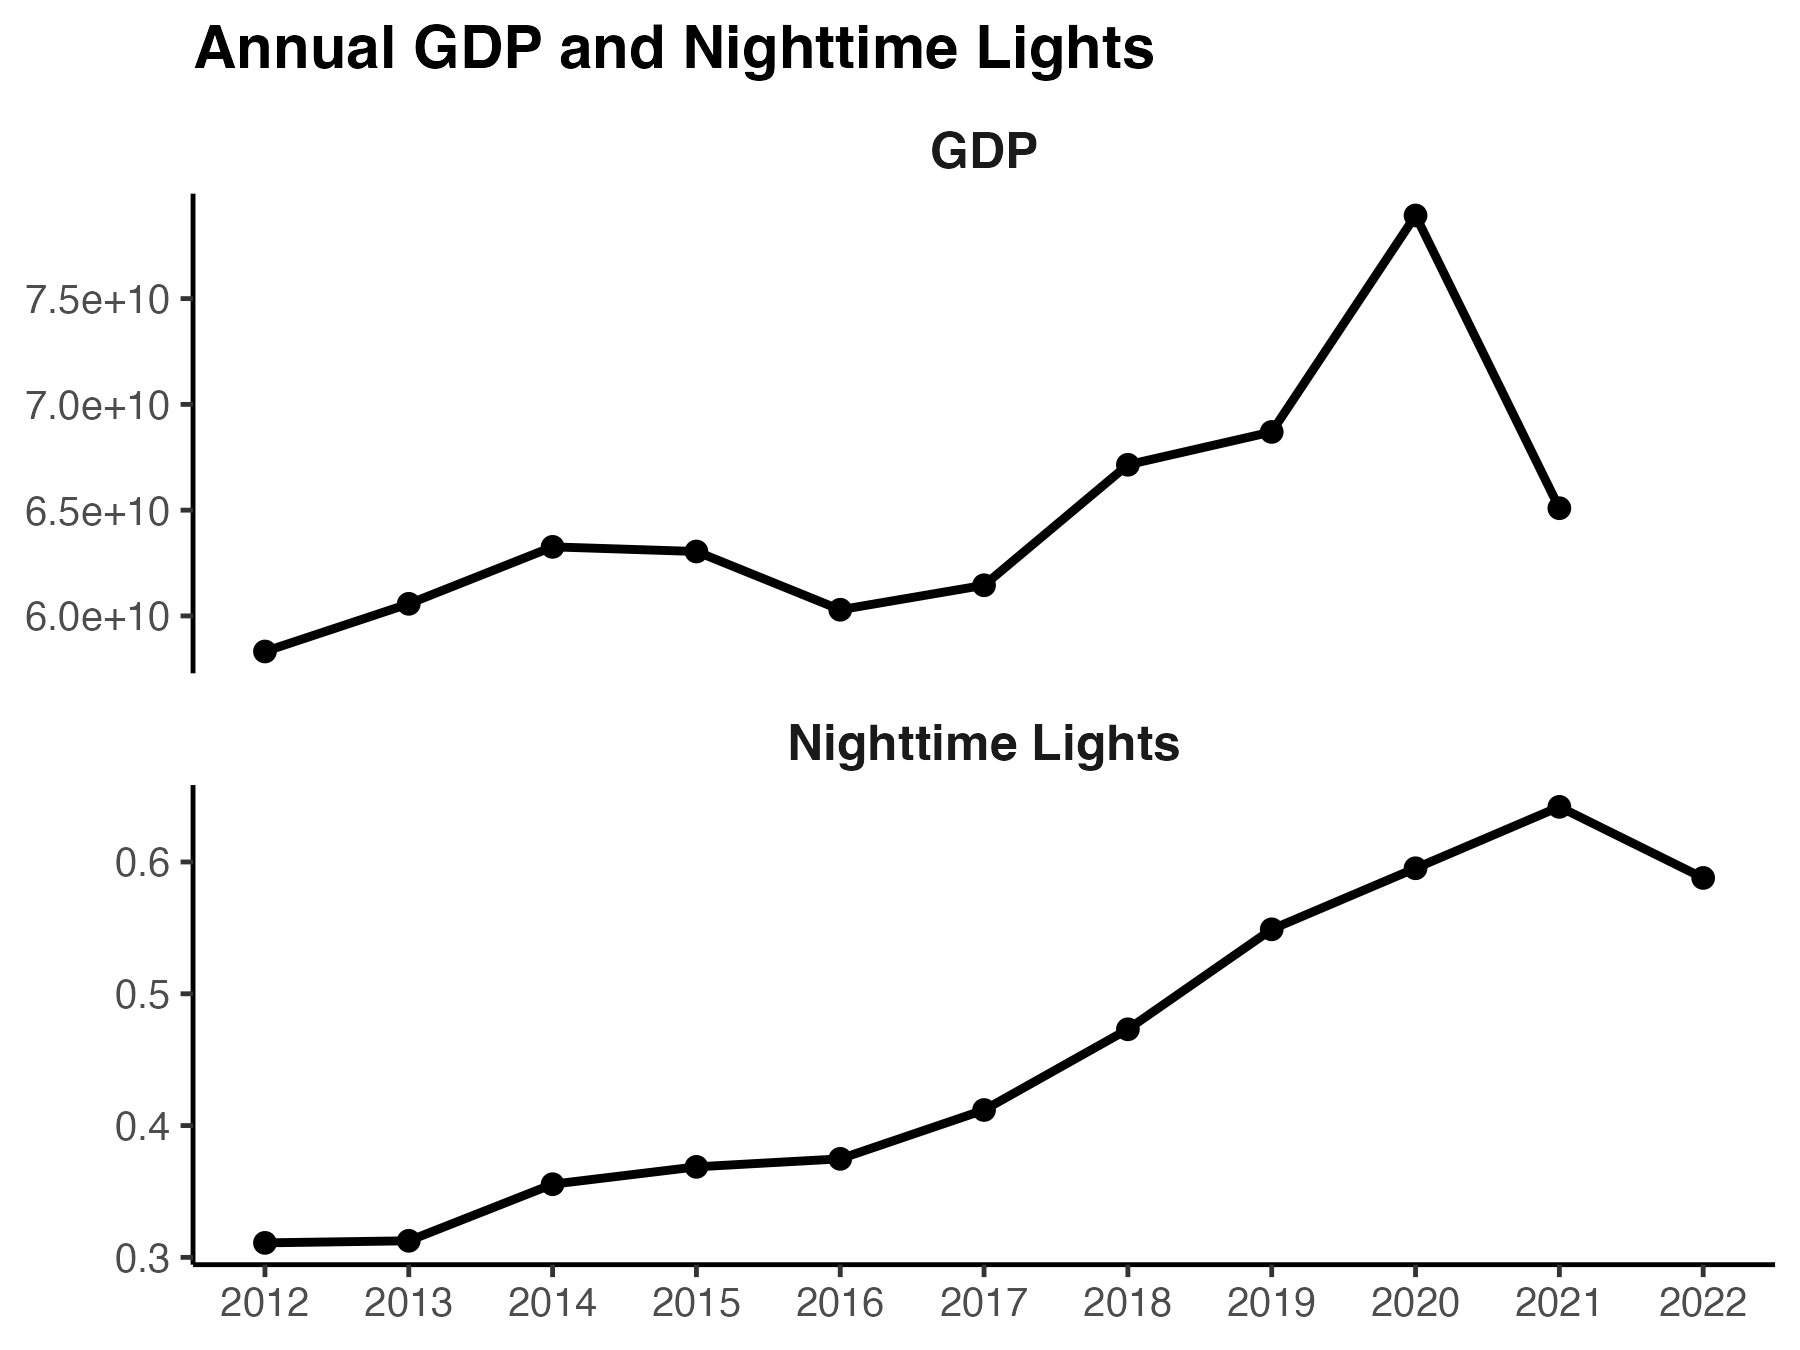
Fig. 18 Trends in GDP and Nighttime Lights#
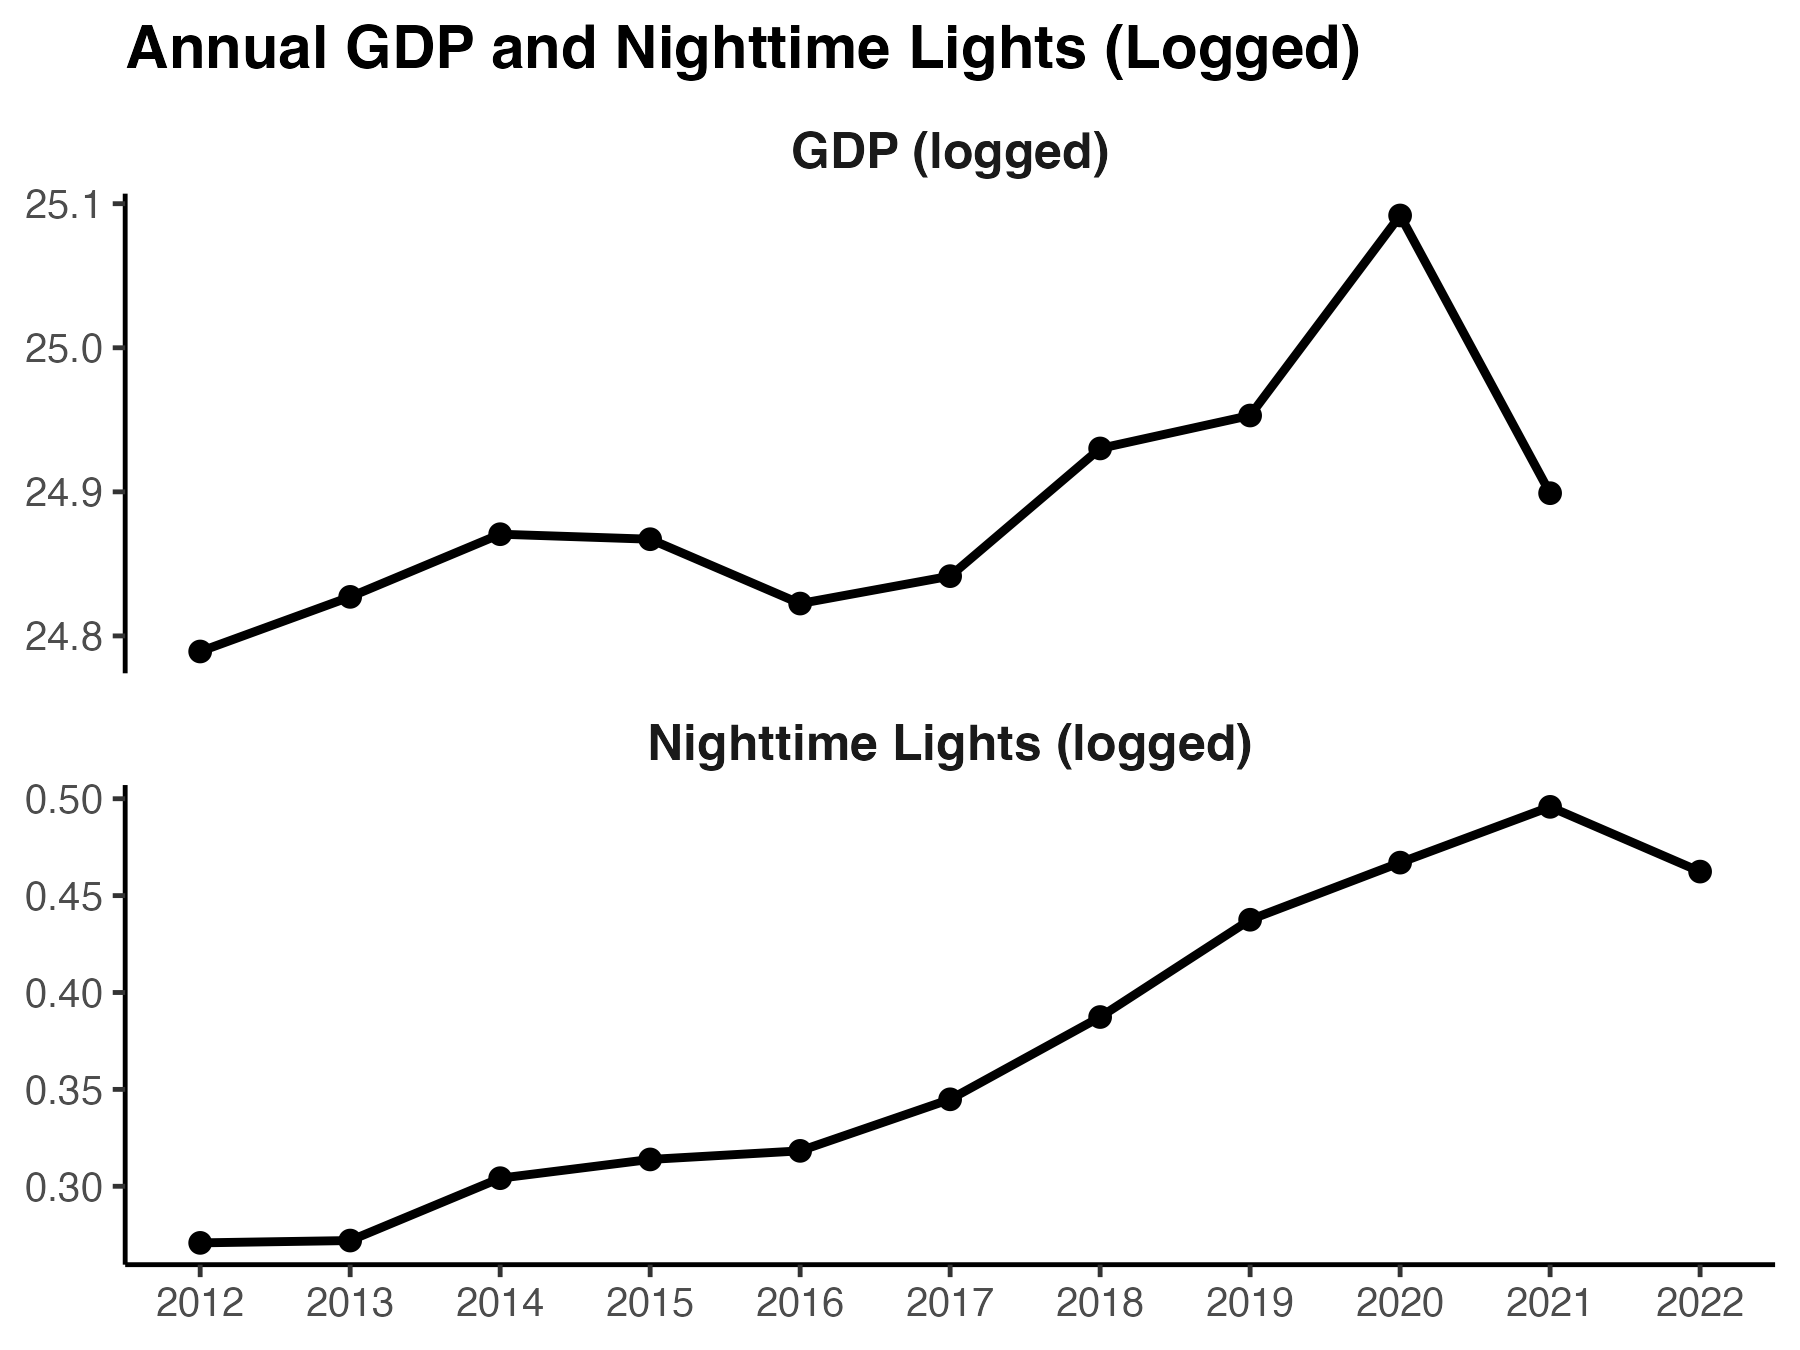
Fig. 19 Trends in GDP and Nighttime Lights, Logged#
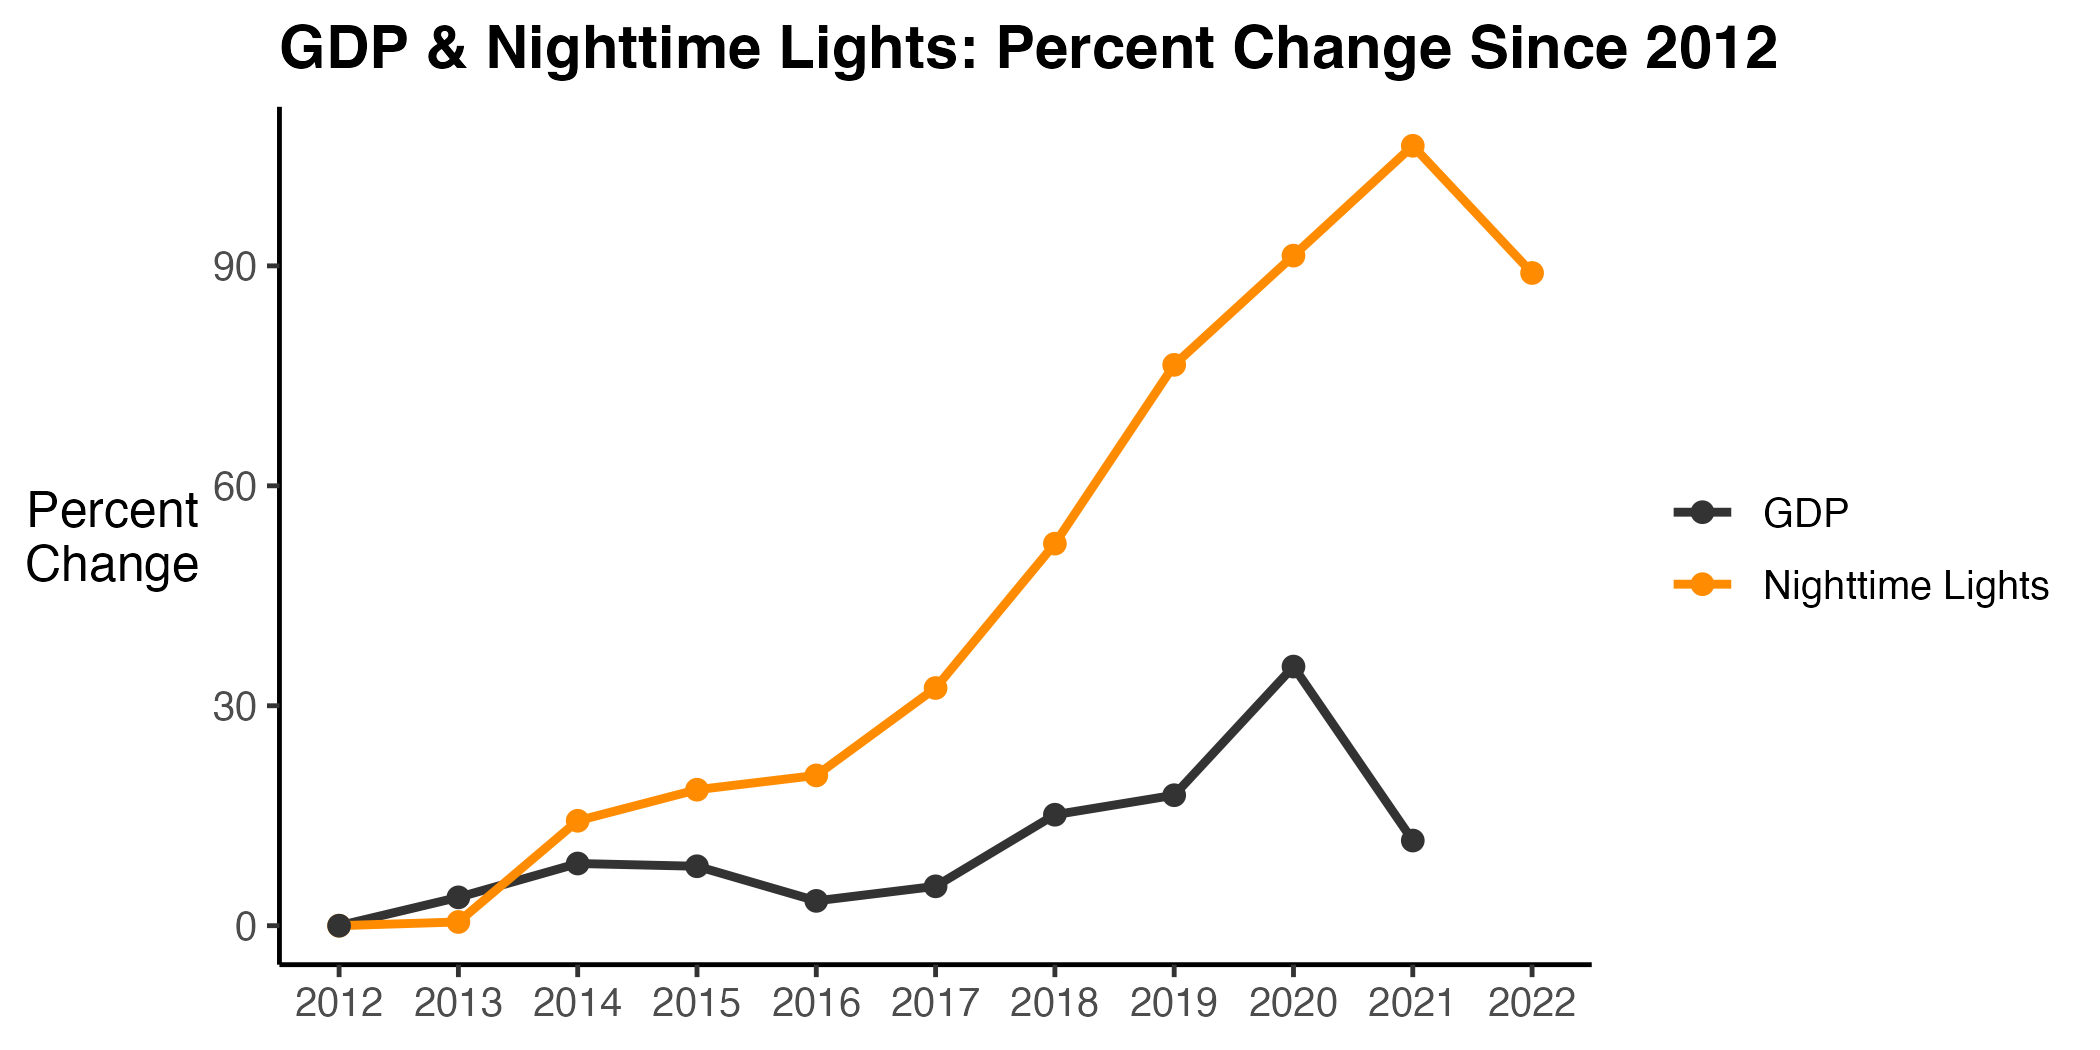
Fig. 20 Trends in GDP and Nighttime Lights: Percent Change since 2012#
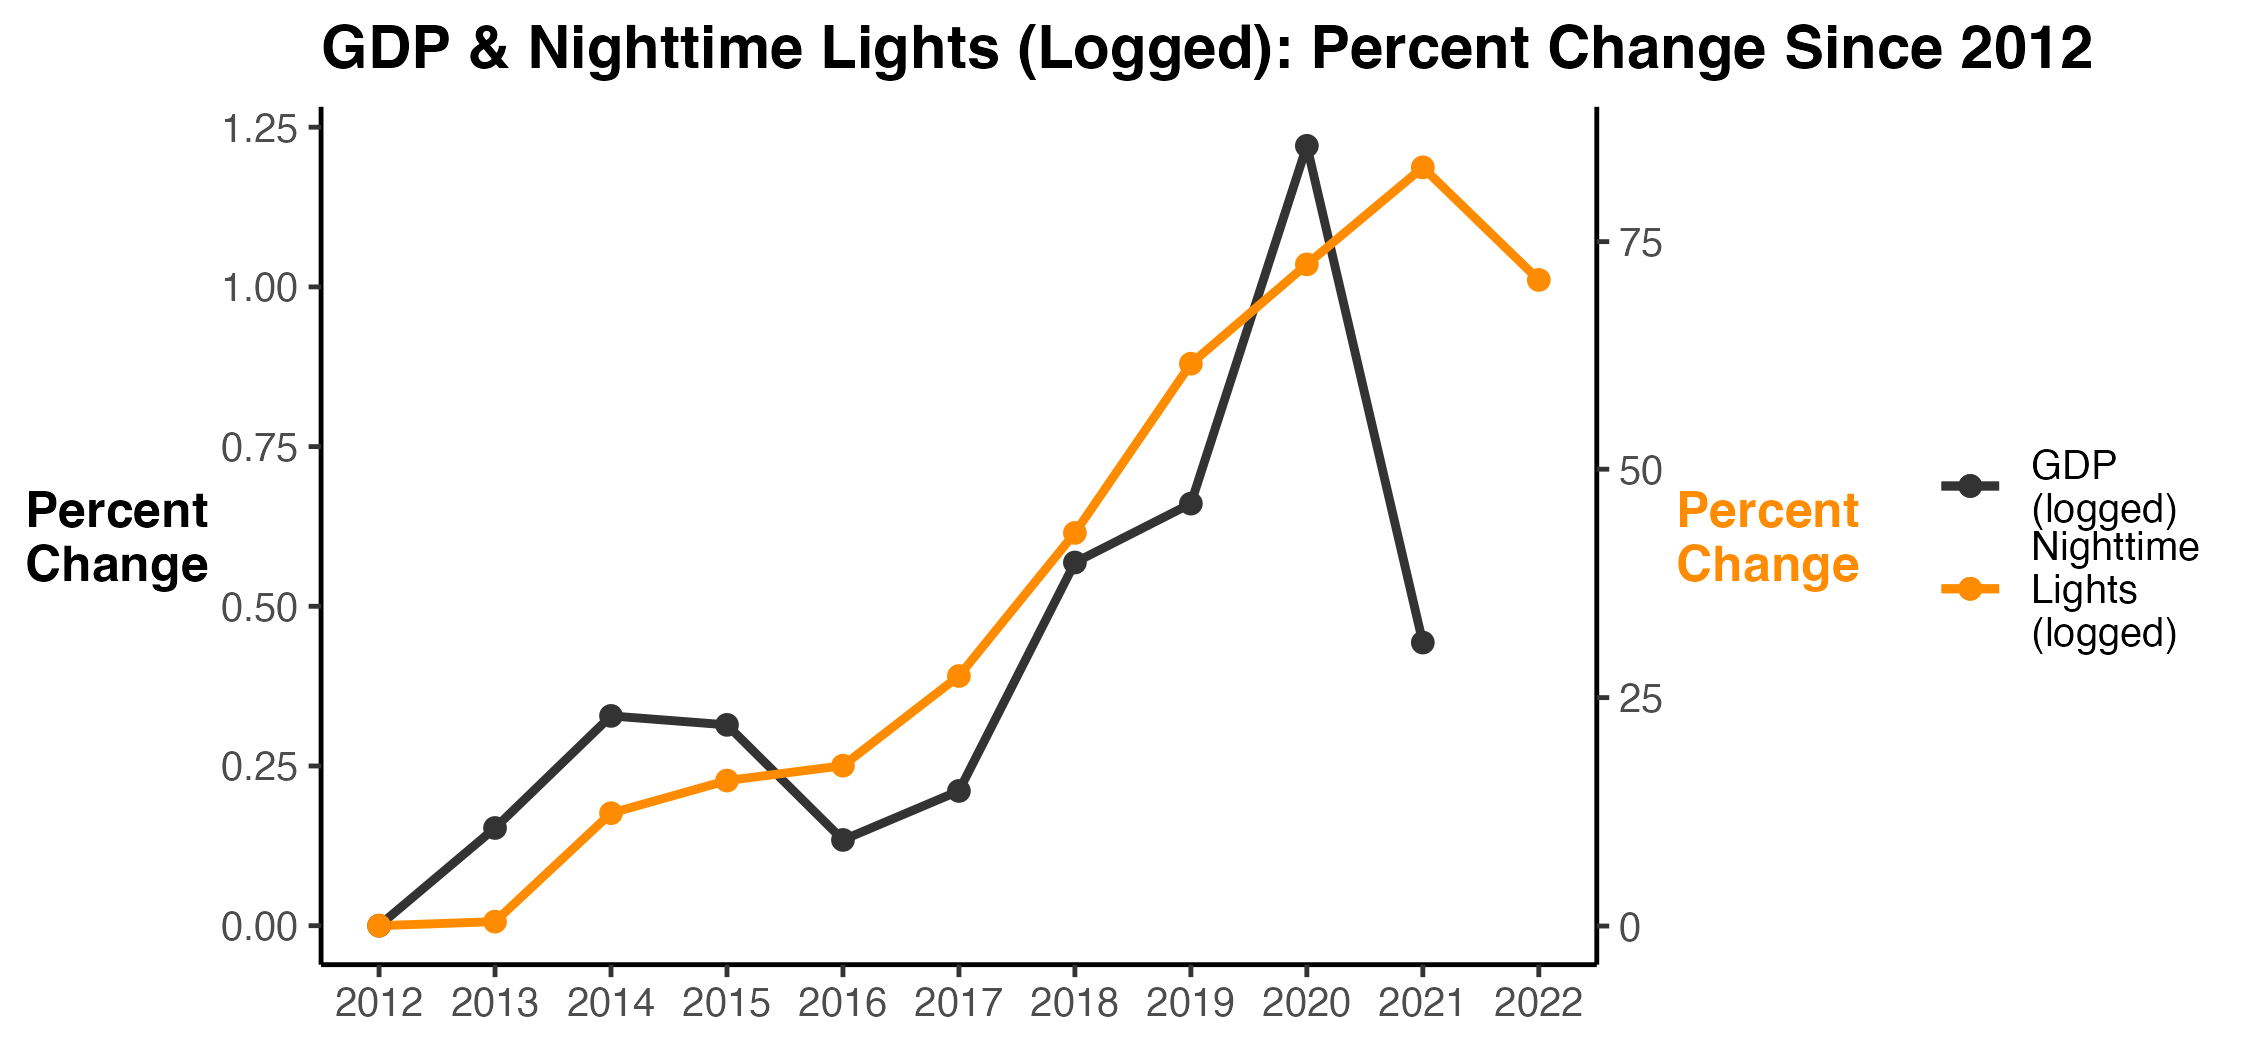
Fig. 21 Trends in GDP and Nighttime Lights: Percent Change since 2012 (Logged)#
Below shows regressions results, regressing GDP on average nighttime lights.
| Dependent variable: | ||
| GDP (Billions) | log(GDP) | |
| (1) | (2) | |
| NTL | 37.299** | |
| (11.661) | ||
| log(NTL) | 0.257*** | |
| (0.074) | ||
| Constant | 48.294*** | 25.109*** |
| (5.290) | (0.066) | |
| Observations | 10 | 10 |
| R2 | 0.561 | 0.601 |
| Adjusted R2 | 0.506 | 0.551 |
| Note: | *p<0.1; **p<0.05; ***p<0.01 | |
GDP vs Nighttime Lights: Quarterly#
This section explores the association between GDP and nighttime lights using annual data. We use available quarterly data from 2015 to 2019.
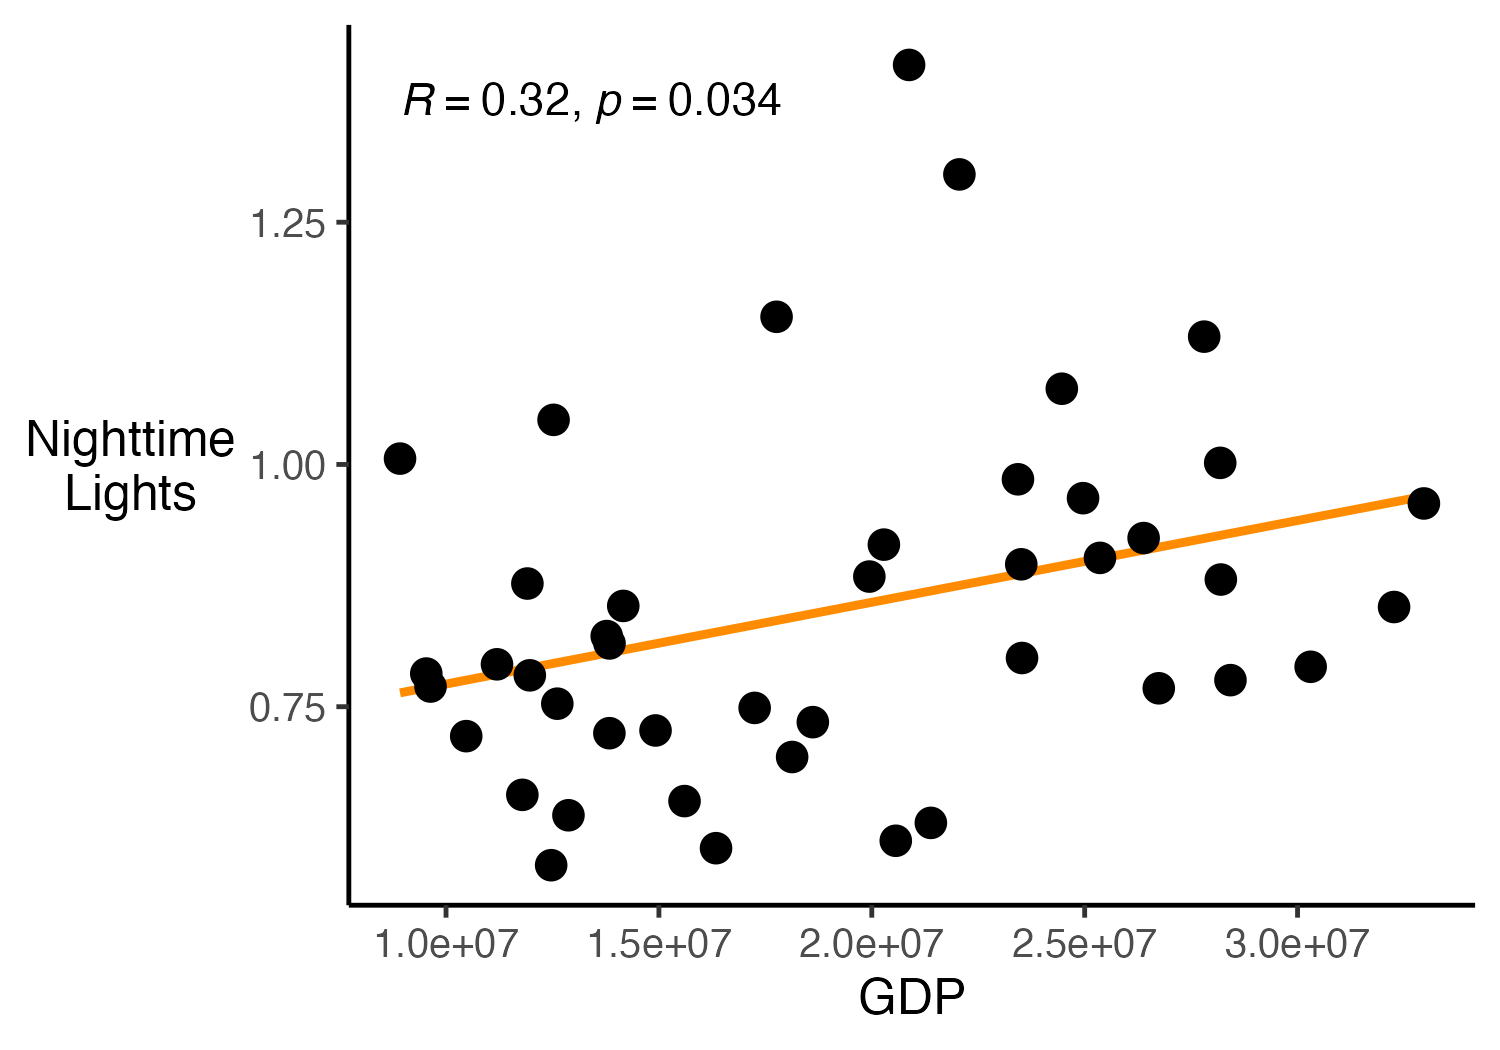
Fig. 22 Association between Nighttime Lights and GDP#
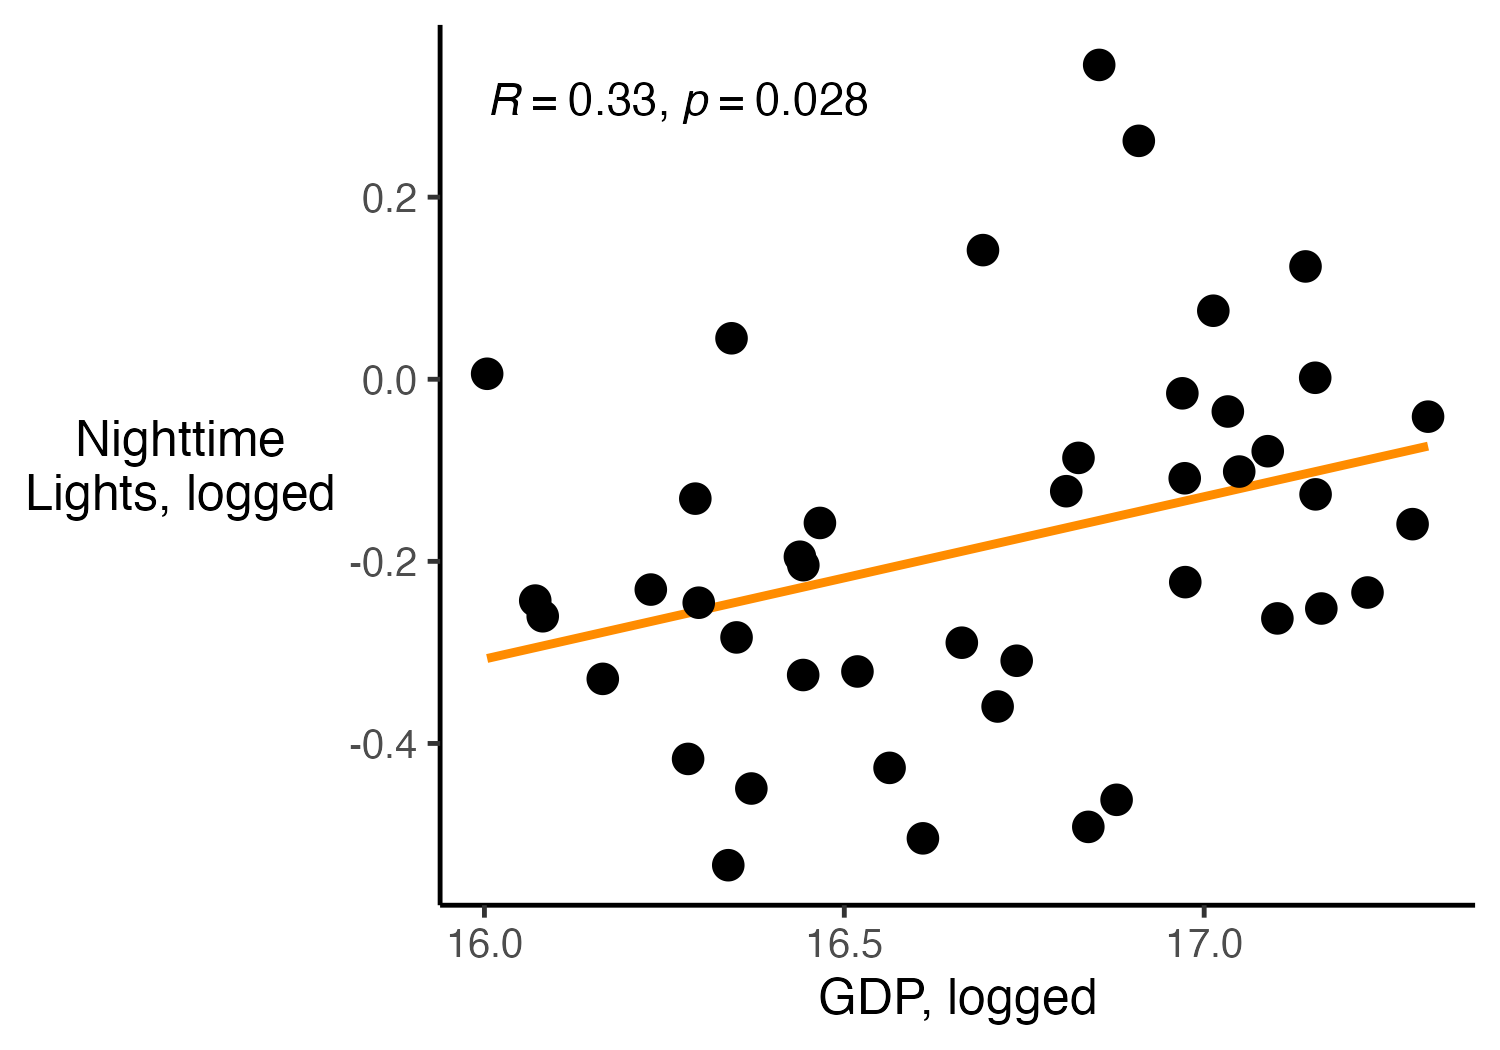
Fig. 23 Association between Nighttime Lights and GDP, logging both NTL and GDP#
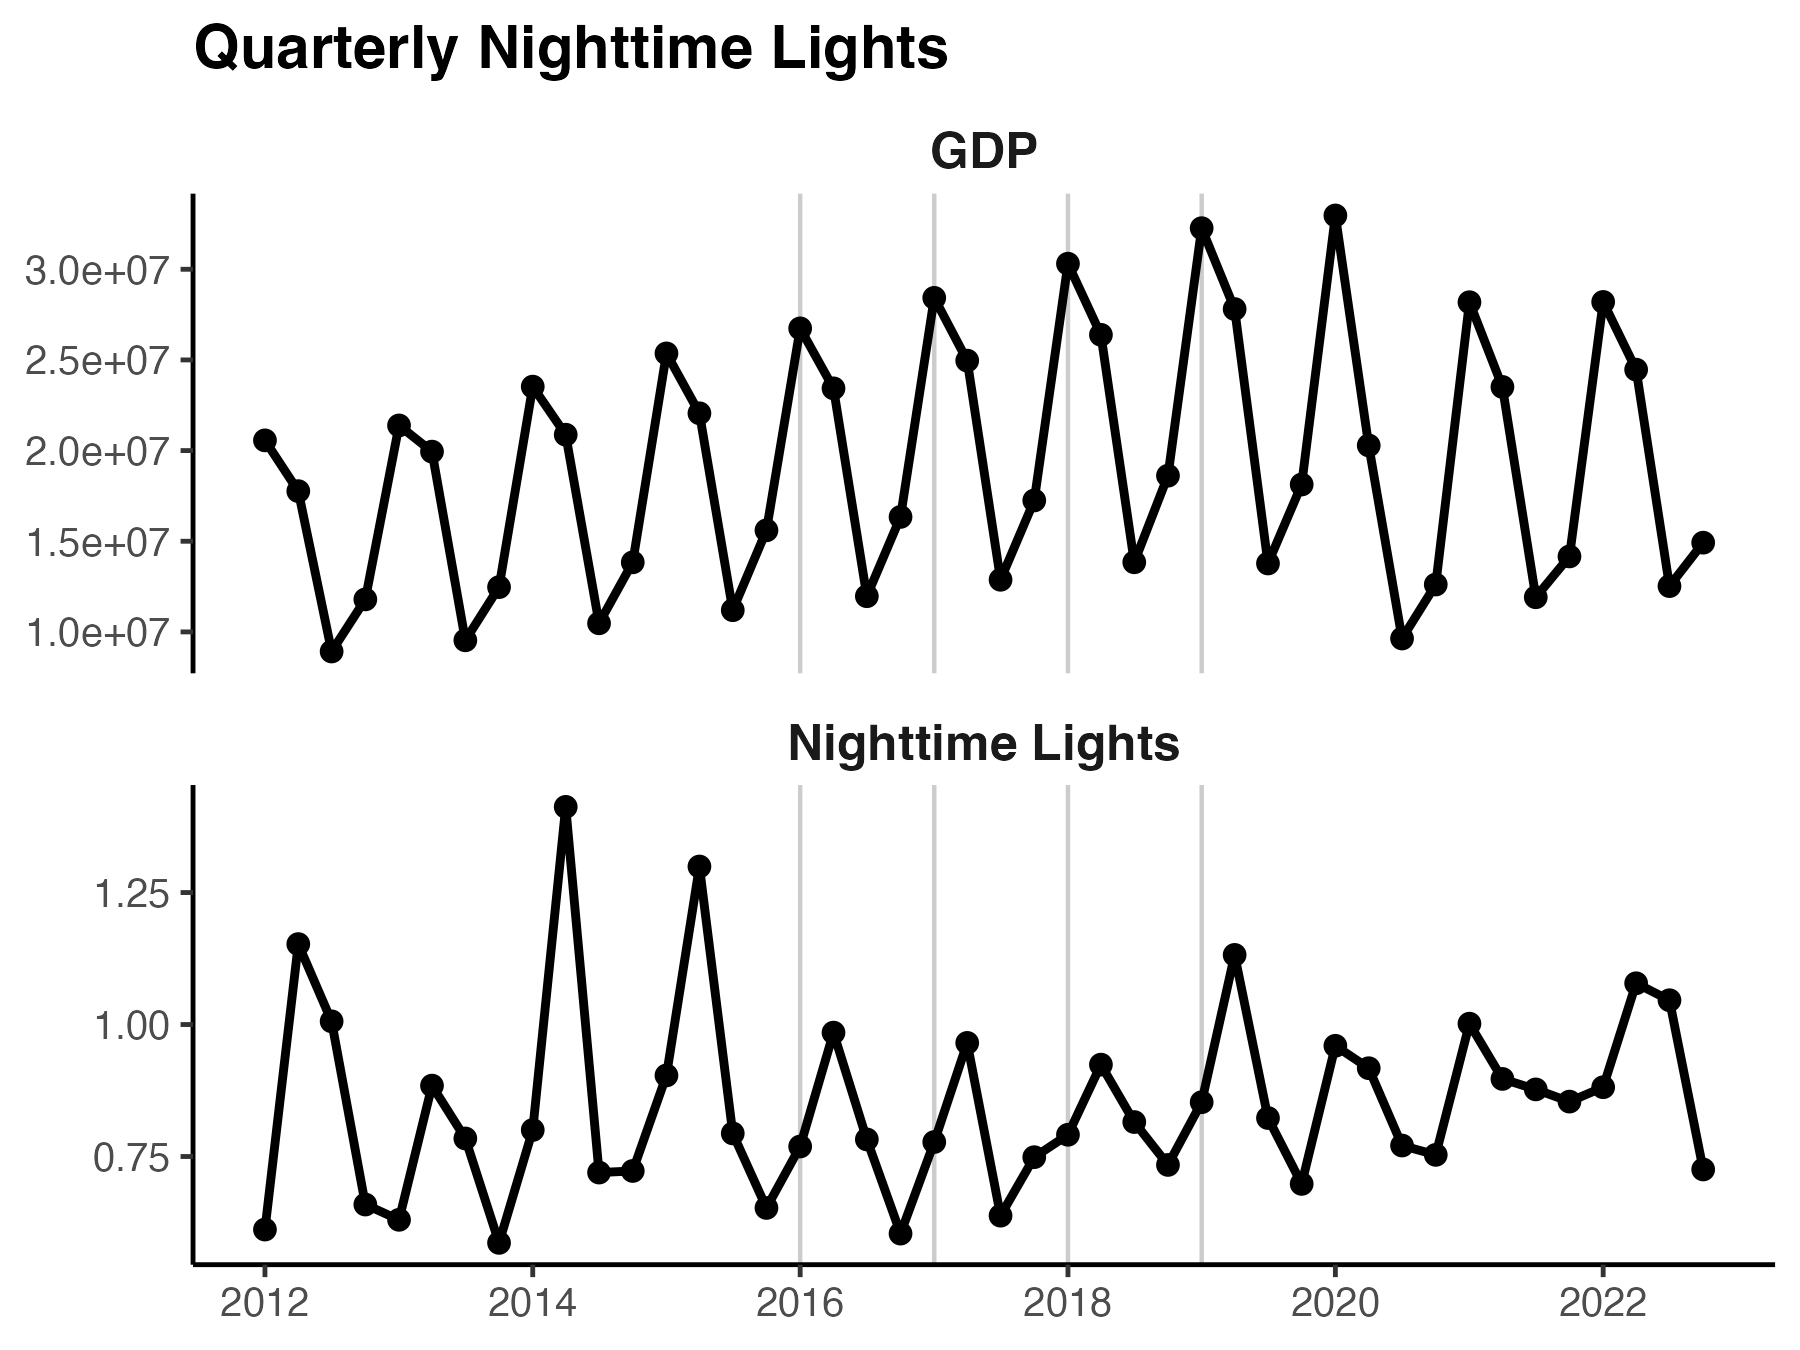
Fig. 24 Trends in GDP and Nighttime Lights#
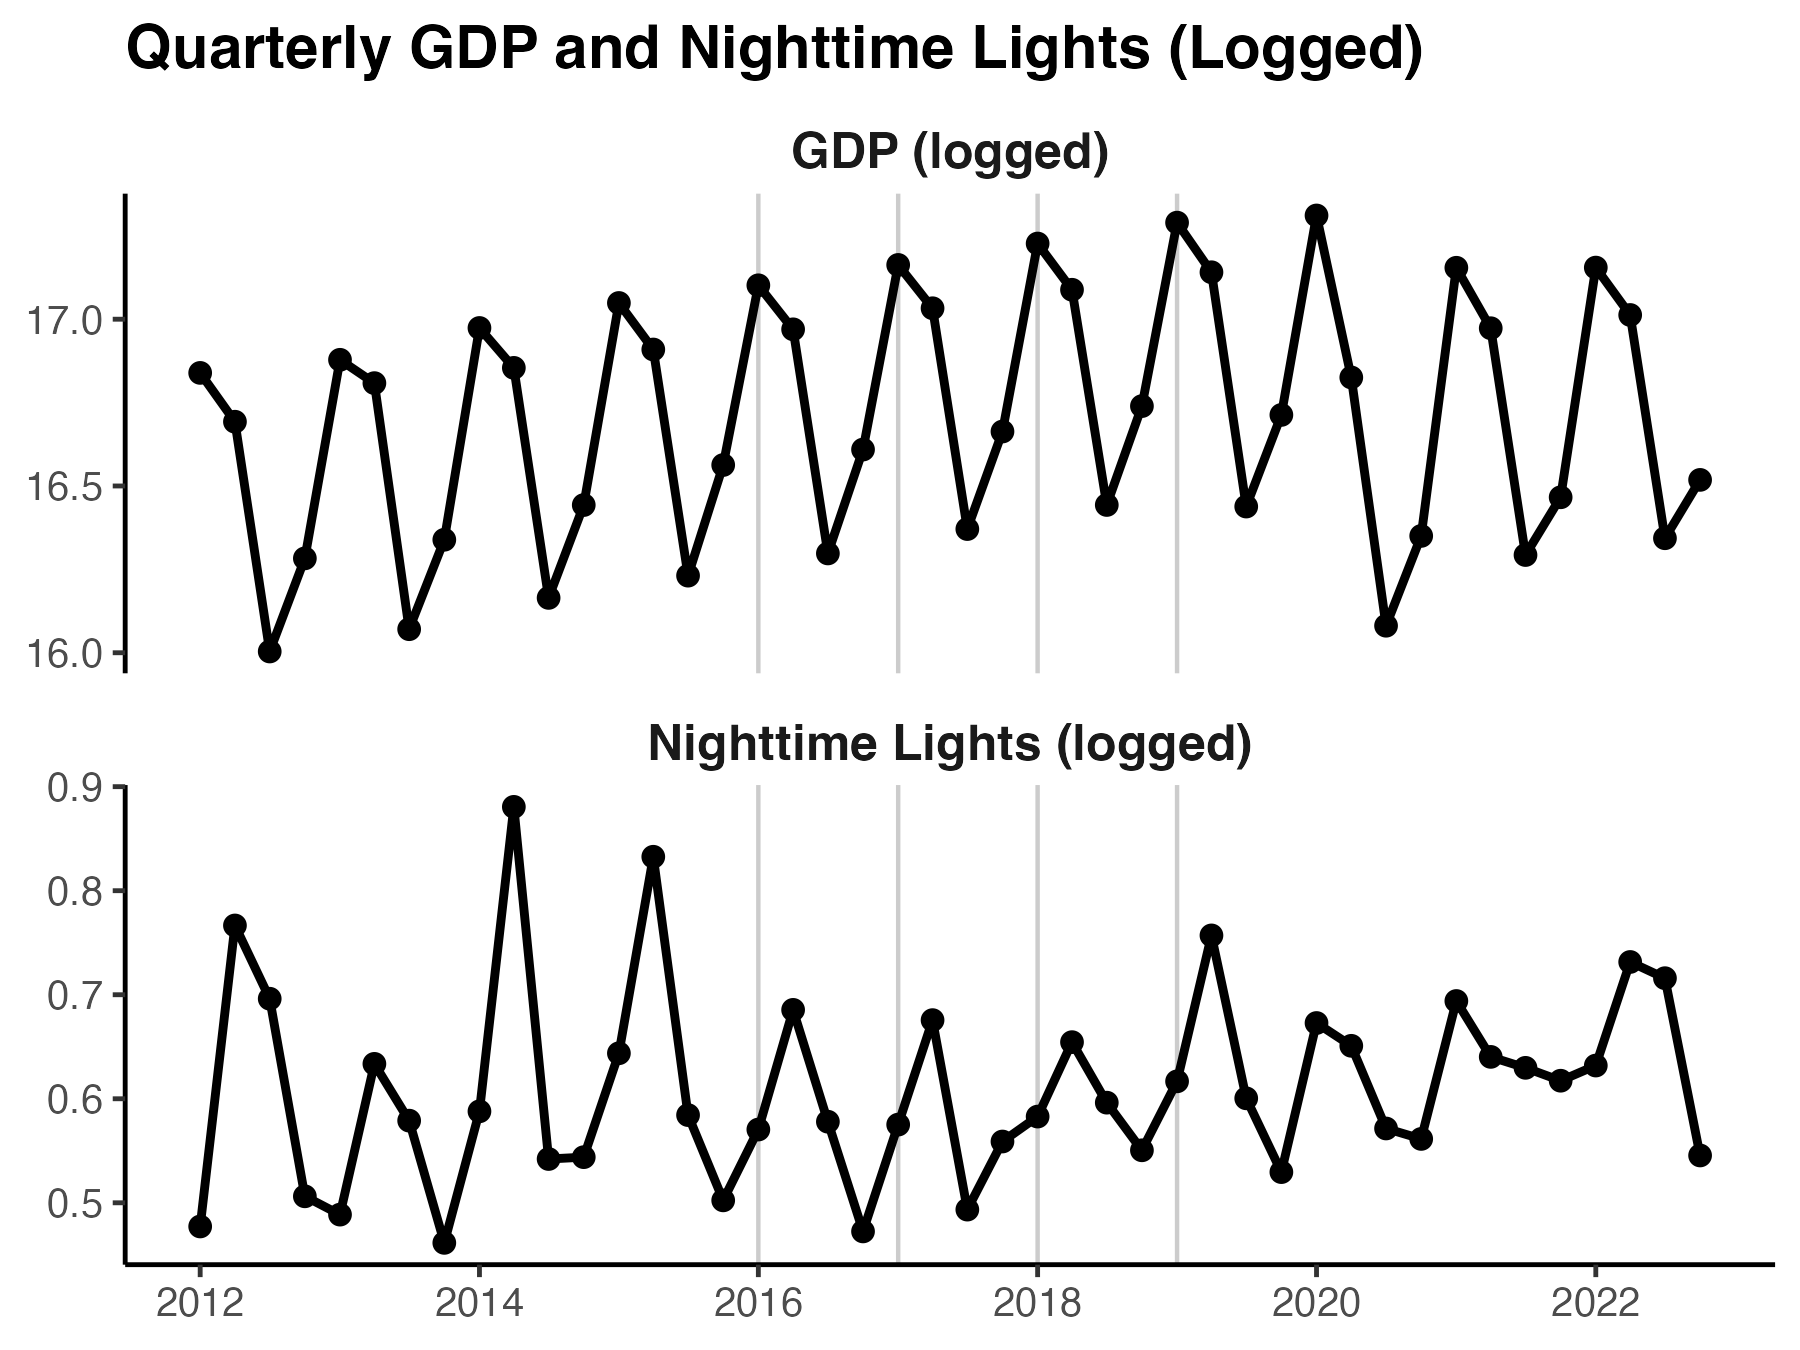
Fig. 25 Trends in GDP and Nighttime Lights, Logged#
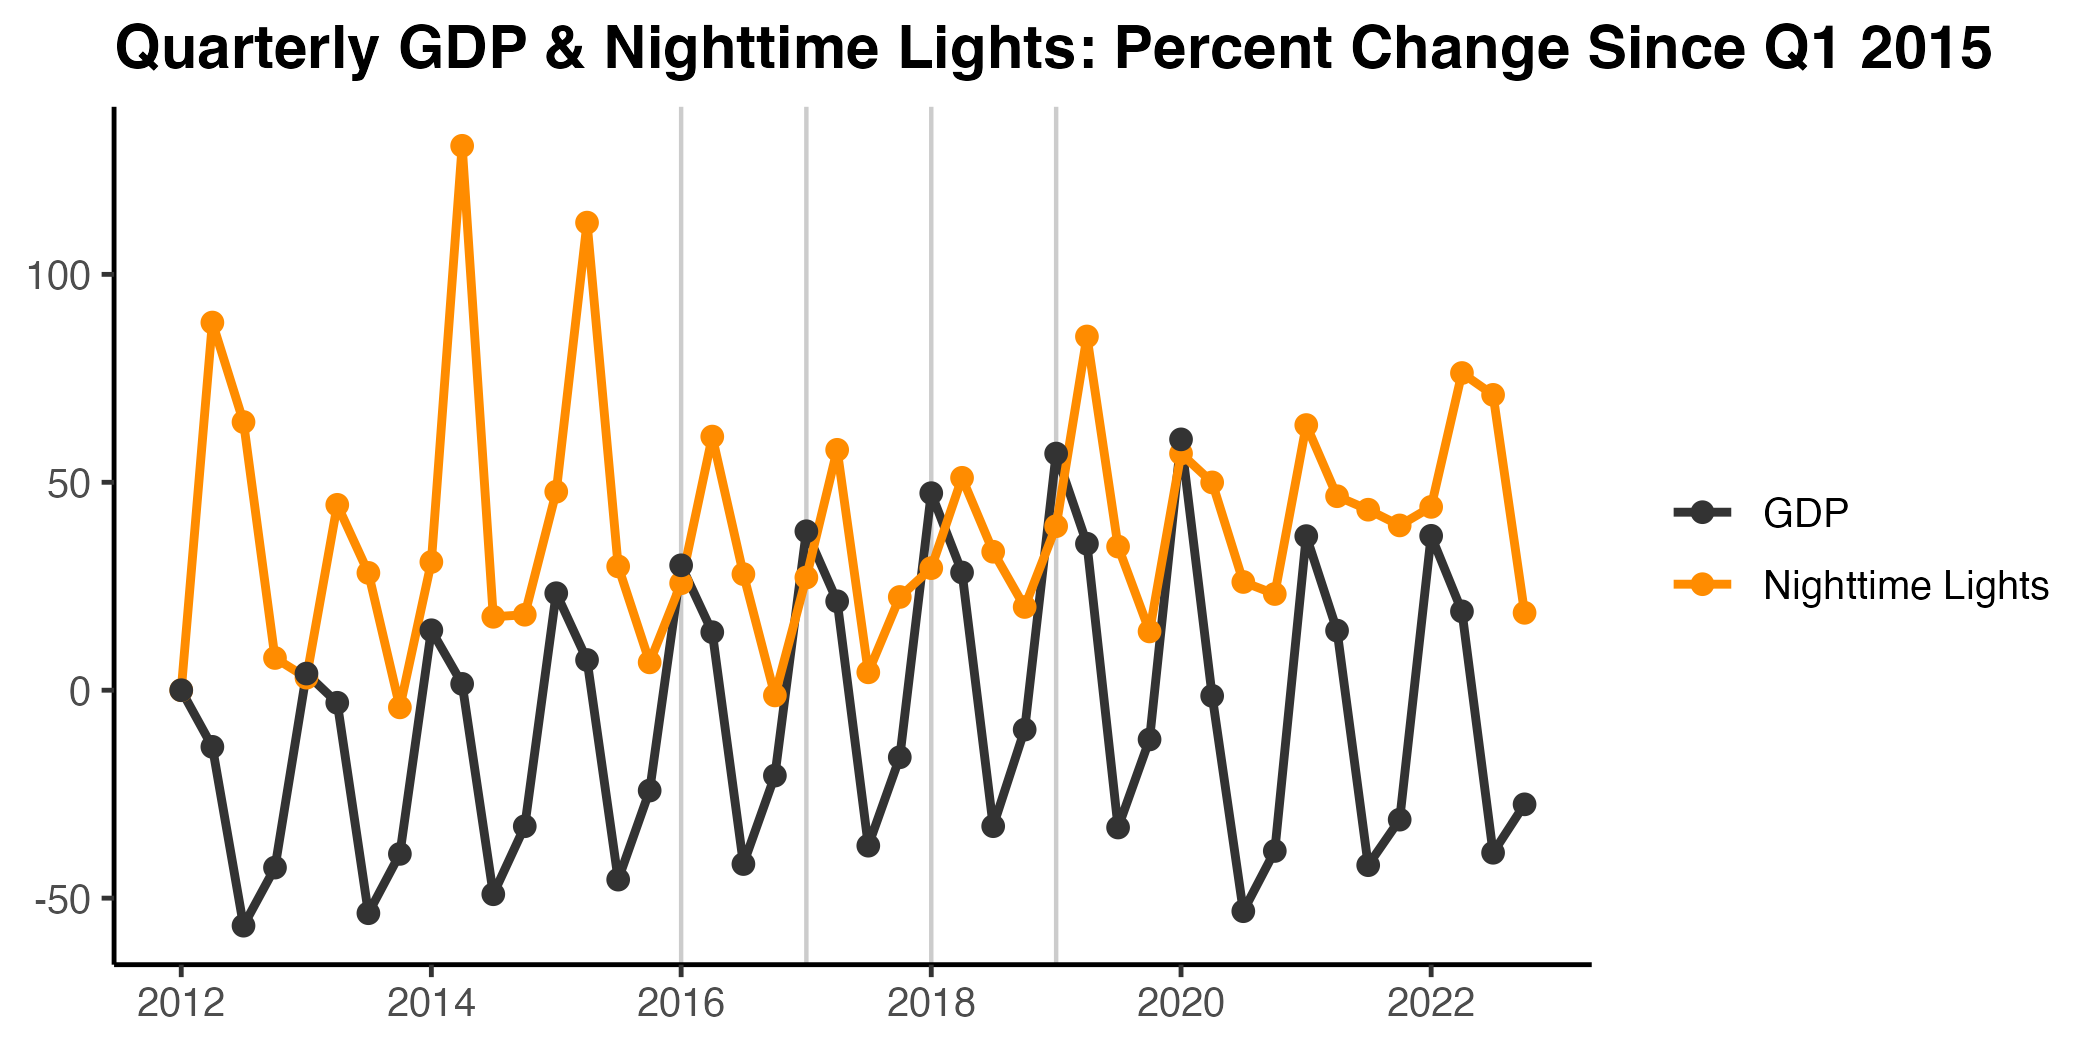
Fig. 26 Trends in GDP and Nighttime Lights: Percent Change since 2012#
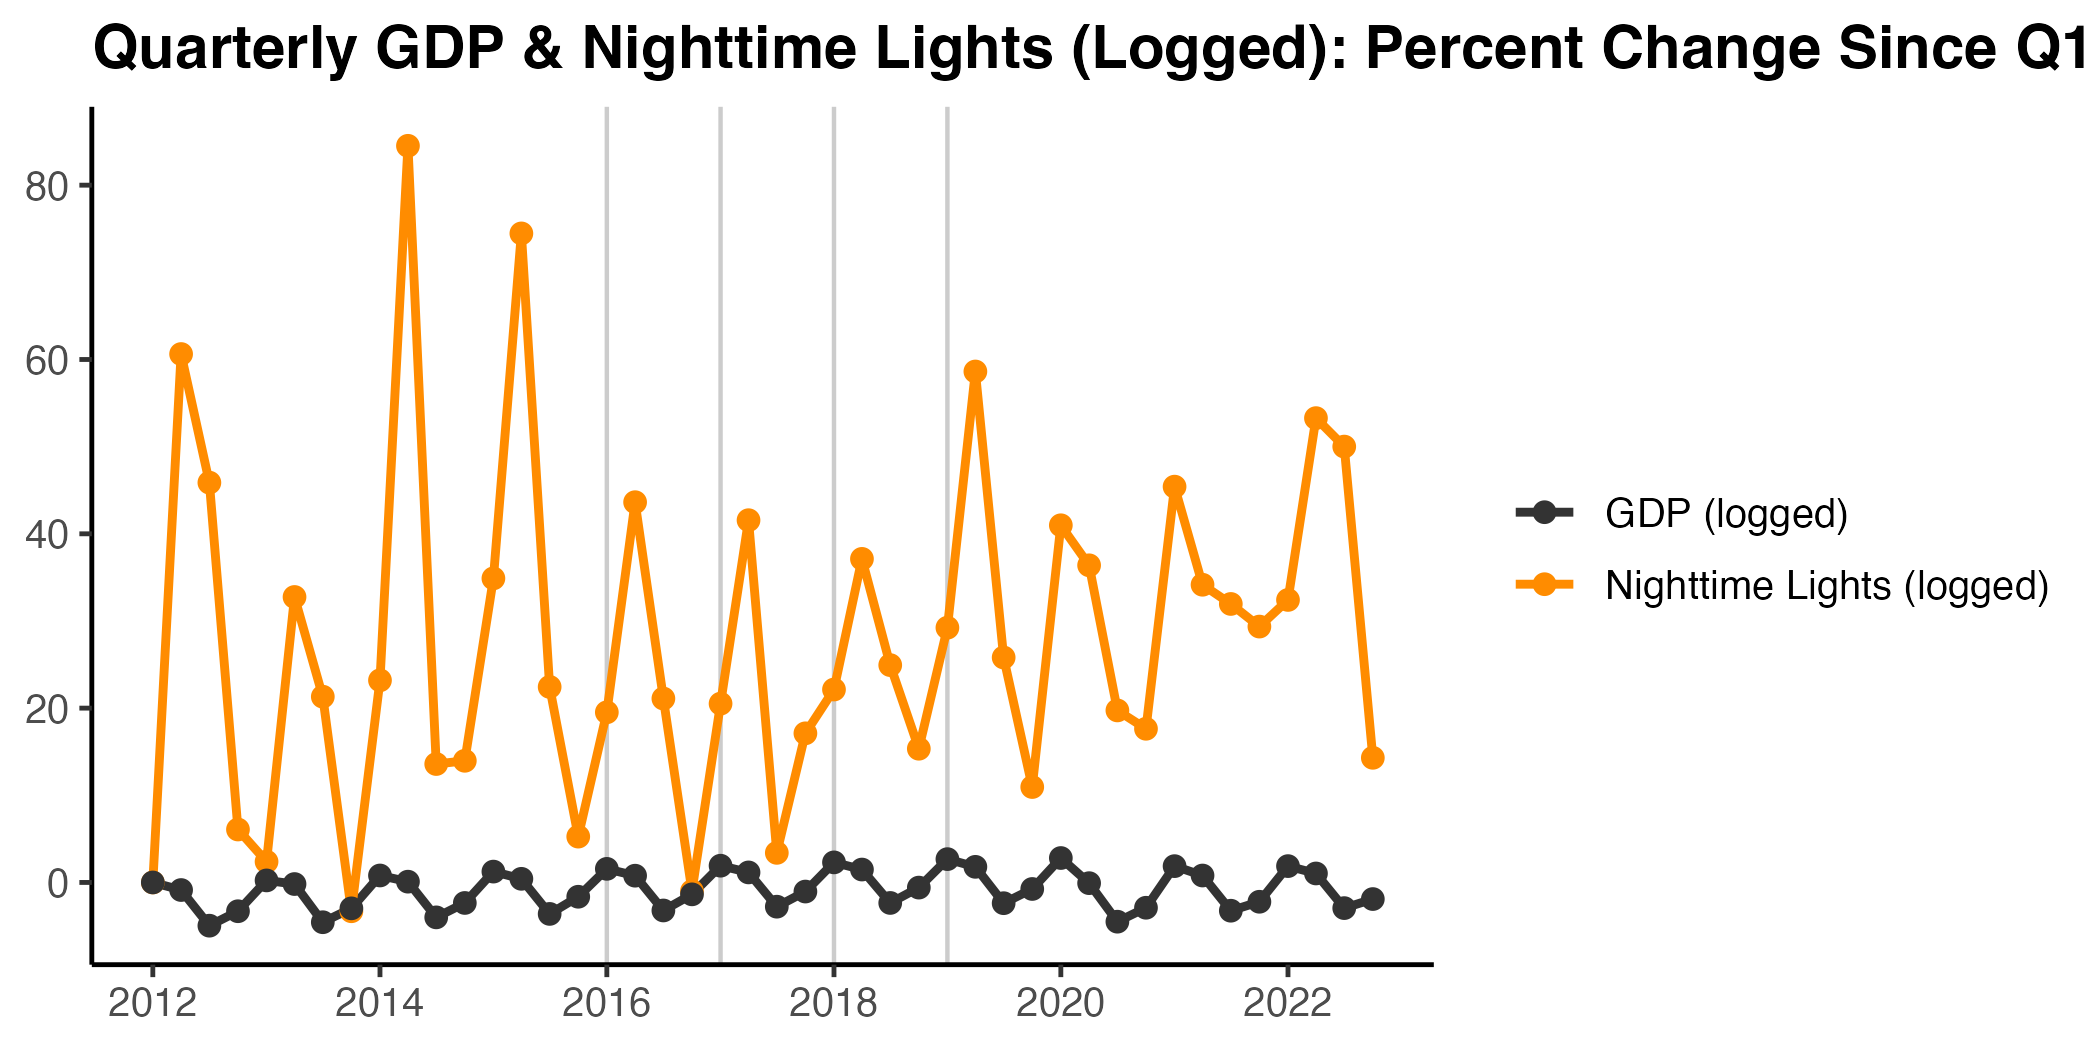
Fig. 27 Trends in GDP and Nighttime Lights: Percent Change since 2012 (Logged)#
Below shows regressions results, regressing GDP on average nighttime lights.
| Dependent variable: | ||||
| GDP (Millions) | log(GDP) | GDP (Millions) | log(GDP) | |
| (1) | (2) | (3) | (4) | |
| NTL | 11,871,105.000* | 12,350,574.000** | ||
| (5,917,835.000) | (5,727,722.000) | |||
| log(NTL) | 0.604** | 0.622** | ||
| (0.291) | (0.280) | |||
| 2020 Onwards | -314,581.800 | -0.024 | ||
| (2,636,518.000) | (0.143) | |||
| Constant | 9,085,884.000* | 16.816*** | 8,685,543.000* | 16.819*** |
| (5,062,361.000) | (0.084) | (4,908,431.000) | (0.082) | |
| Start Year | 2012 | 2012 | 2012 | 2012 |
| End Year | 2020 | 2020 | 2022 | 2022 |
| Observations | 36 | 36 | 44 | 44 |
| R2 | 0.106 | 0.113 | 0.103 | 0.110 |
| Adjusted R2 | 0.080 | 0.087 | 0.060 | 0.066 |
| Note: | *p<0.1; **p<0.05; ***p<0.01 | |||
Limitations#
Nighttime lights are a common data source for measuring local economic activity. However, it is a proxy that is strongly—although imperfectly—correlated with measures of interest, such as population, local GDP, and wealth. Consequently, care must be taken in interpreting reasons for changes in lights.