Armed Conflict Location and Event Data Analysis#
The Armed Conflict Location & Event Data Project (ACLED) is a disaggregated data collection, analysis, and crisis mapping project. ACLED collects information on the dates, actors, locations, fatalities, and types of all reported political violence and protest events around the world. The raw data is available through a license obtained by the World Bank
Removing conflict data from strategic developments after the Mynmar Country team had consultations with a team onground monitoring the conflict
acled = acled[acled["event_type"] != "Strategic developments"]
acled = acled[acled["event_date"] >= "2020-01-01"]
Calculating Conflict Index#
Conflict Index is calculated as a geometric mean of conflict events and fatalities at admin 2 level
def get_acled_conflicts_by_year(acled, start_date, end_date):
    acled_22 = acled[
        (acled["event_date"] >= start_date) & (acled["event_date"] <= end_date)
    ]
    acled_22 = (
        acled_22.groupby(
            ["latitude", "longitude", pd.Grouper(key="event_date", freq="Y")]
        )["fatalities"]
        .agg(["sum", "count"])
        .reset_index()
    )
    acled_22 = convert_to_gdf(acled_22)
    acled_22["sizeCategory"] = acled_22["sum"].apply(lambda x: get_size_category(x))
    acled_22.sort_values(by="count")

    return acled_22
acled_21 = get_acled_conflicts_by_year(acled, "2021-01-01", "2021-12-31")
acled_22 = get_acled_conflicts_by_year(acled, "2022-01-01", "2022-12-31")
acled_23 = get_acled_conflicts_by_year(acled, "2023-01-01", "2023-12-31")
Geospatial Changes in Conflict in Myanmar from 2021 to 2022#
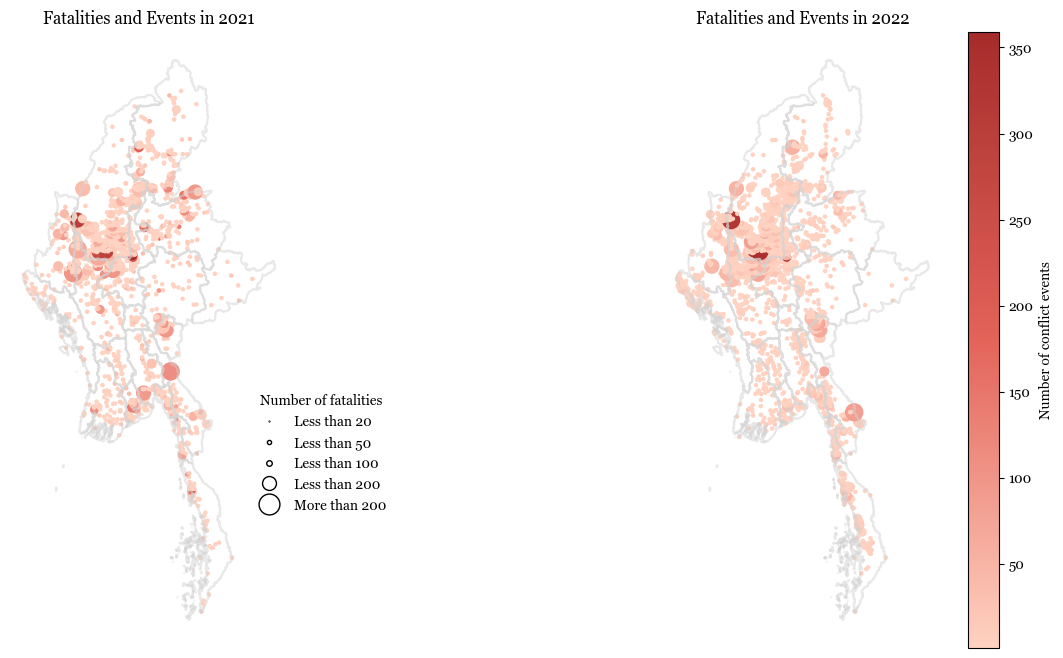
The below plot shows a map of Myanmar and the conflicts that occured in 2021 and 2022. The size of each bubble indicates the number of events while the color indicates the number of fatalities.
The following observations can be made from the below map and the following line plot -
The number of documented conflicts were the highest in 2021 but the number of deaths were the highest in 2022
In 2022, Sagaing had a lot more conflicts than in 2021 showing a 60% increase
Through visual inspection, conflicts were slightly more spread out in 2022 than 2021
This could indicate that some of the events caused severe damage in 2022
The areas where there were high damage remained the same in 2021 and 2022, focussed in the Sagaing and Magway regions
In 2021, the most number of events were in Mandalay followed by Yinmarbin, in 2022, most conflicts were in Yinmarbin followed by Shwebo
In 2021, the most fatalities were in Yinmarbin followed by Kale, in 2022, most fatalities were in Yinmarbin followed by Shwebo
Regions that saw less conflict in 2021 like Shan (East) continued to see less conflict in 2022 as well, compared to the other regions.
Show code cell source
plt.rcParams["font.family"] = "Georgia"

fig, ax = plt.subplots(1, 2, sharex=True, figsize=(15, 8))


acled_21.plot(
    column="count", cmap=cmap, ax=ax[0], markersize="sizeCategory", marker="o"
)
myanmar_adm1.boundary.plot(ax=ax[0], color="lightgrey", alpha=0.5, zorder=1)
ax[0].set_title("Fatalities and Events in 2021")

acled_22.plot(column="count", cmap=cmap, ax=ax[1], markersize="sizeCategory")
myanmar_adm1.boundary.plot(ax=ax[1], color="lightgrey", alpha=0.5, zorder=1)
ax[1].set_title("Fatalities and Events in 2022")

# acled_23.plot(column = 'sum',  cmap = 'Reds', ax = ax[2], markersize = 'sizeCategory', vmin=10, vmax = 300)
# myanmar_adm1.boundary.plot(ax=ax[2], color = 'lightgrey', alpha = 0.5, zorder = 1)

# for idx, row in myanmar_adm1.iterrows():
#     print(row['ST'])
#     ax[1].annotate(text=row['ST'], xy=row['coords'],
#                  horizontalalignment='center')
# ax[2].set_title('Fatalities and Events in 2023')

# Create a colorbar
sm = plt.cm.ScalarMappable(cmap=cmap)
sm.set_array(acled_22["count"])
cbar = plt.colorbar(sm)
cbar.set_label("Number of conflict events")

for i in [0, 1]:
    ax[i].spines["top"].set_visible(False)
    ax[i].spines["bottom"].set_visible(False)
    ax[i].spines["left"].set_visible(False)
    ax[i].spines["right"].set_visible(False)

    ax[i].set_xticks([])
    ax[i].set_yticks([])

sizes = acled_22.sort_values(by="sizeCategory")["sizeCategory"].unique()
handles = []
for size in sizes:
    (handle,) = ax[0].plot(
        [],
        [],
        marker="o",
        markersize=size / 10,
        linestyle="",
        label=sizeCategoryLabels[size],
        markerfacecolor="white",
        markeredgecolor="black",
    )
    handles.append(handle)
ax[0].legend(
    handles=handles,
    title="Number of fatalities",
    loc="lower right",
    frameon=False,
    bbox_to_anchor=(1.4, 0.2),
)
plt.show()
# ax[i].set_xticks(False)
C:\Users\sahit\AppData\Local\Temp\ipykernel_23336\1745098067.py:29: MatplotlibDeprecationWarning: Unable to determine Axes to steal space for Colorbar. Using gca(), but will raise in the future. Either provide the *cax* argument to use as the Axes for the Colorbar, provide the *ax* argument to steal space from it, or add *mappable* to an Axes.
  cbar = plt.colorbar(sm)
Top 5 worst affected admin 1 regions in 2021#
acled_adm1[acled_adm1["event_date"].between("2022-01-01", "2022-12-31")].groupby(
    [pd.Grouper(key="event_date", freq="Y"), "ST"]
).sum(["fatalities", "nrEvents"]).reset_index().sort_values(
    by="nrEvents", ascending=False
)[["event_date", "ST", "fatalities", "nrEvents"]].head(5)
| event_date | ST | fatalities | nrEvents | |
|---|---|---|---|---|
| 12 | 2022-12-31 | Sagaing | 8204 | 4211 |
| 8 | 2022-12-31 | Mandalay | 1048 | 1000 |
| 7 | 2022-12-31 | Magway | 2424 | 953 |
| 16 | 2022-12-31 | Tanintharyi | 1042 | 746 |
| 17 | 2022-12-31 | Yangon | 317 | 731 |
Top 5 worst affected admin 1 regions in 2021#
Show code cell source
acled_adm1[acled_adm1["event_date"].between("2021-01-01", "2021-12-31")].groupby(
    [pd.Grouper(key="event_date", freq="Y"), "ST"]
).sum(["fatalities", "nrEvents"]).reset_index().sort_values(
    by="nrEvents", ascending=False
)[["event_date", "ST", "fatalities", "nrEvents"]].head(5)
| event_date | ST | fatalities | nrEvents | |
|---|---|---|---|---|
| 12 | 2021-12-31 | Sagaing | 4275 | 2609 |
| 17 | 2021-12-31 | Yangon | 484 | 1841 |
| 8 | 2021-12-31 | Mandalay | 683 | 1719 |
| 14 | 2021-12-31 | Shan (North) | 505 | 1181 |
| 4 | 2021-12-31 | Kachin | 648 | 1128 |
Show code cell source
output_notebook()
bokeh.core.validation.silence(EMPTY_LAYOUT, True)
bokeh.core.validation.silence(MISSING_RENDERERS, True)

tabs = []

# df = get_acled_by_admin(myanmar_adm1, acled, columns = ['country'])
for type in ["nrEvents", "fatalities"]:
    tabs.append(
        TabPanel(
            child=get_line_plot(
                acled_adm0,
                f"{type.capitalize()} in the country",
                "Source: ACLED",
                earthquakes=True,
                subtitle="",
                category="country",
                measure=type,
            ),
            title=type.capitalize(),
        )
    )

tabs = Tabs(tabs=tabs, sizing_mode="scale_both")
show(tabs, warn_on_missing_glyphs=False)
Show code cell source
output_notebook()
bokeh.core.validation.silence(EMPTY_LAYOUT, True)
bokeh.core.validation.silence(MISSING_RENDERERS, True)

tabs = []

tabs.append(
    TabPanel(
        child=get_line_plot(
            acled_adm1,
            "Conflict Index by admin 1",
            "Source: ACLED",
            earthquakes=True,
            subtitle="",
            category="ST",
        ),
        # title=adm.capitalize(),
    )
)

tabs = Tabs(tabs=tabs, sizing_mode="scale_both")
show(tabs, warn_on_missing_glyphs=False)
Show code cell source
output_notebook()
bokeh.core.validation.silence(EMPTY_LAYOUT, True)
bokeh.core.validation.silence(MISSING_RENDERERS, True)


tabs = []

for adm in list(acled_adm2["ST"].unique()):
    df = acled_adm2[acled_adm2["ST"] == adm]

    tabs.append(
        TabPanel(
            child=get_line_plot(
                df,
                "Conflict Index by admin 2",
                "Source: ACLED",
                earthquakes=True,
                subtitle="",
            ),
            title=adm.capitalize(),
        )
    )

tabs = Tabs(tabs=tabs, sizing_mode="scale_both")
show(tabs, warn_on_missing_glyphs=False)
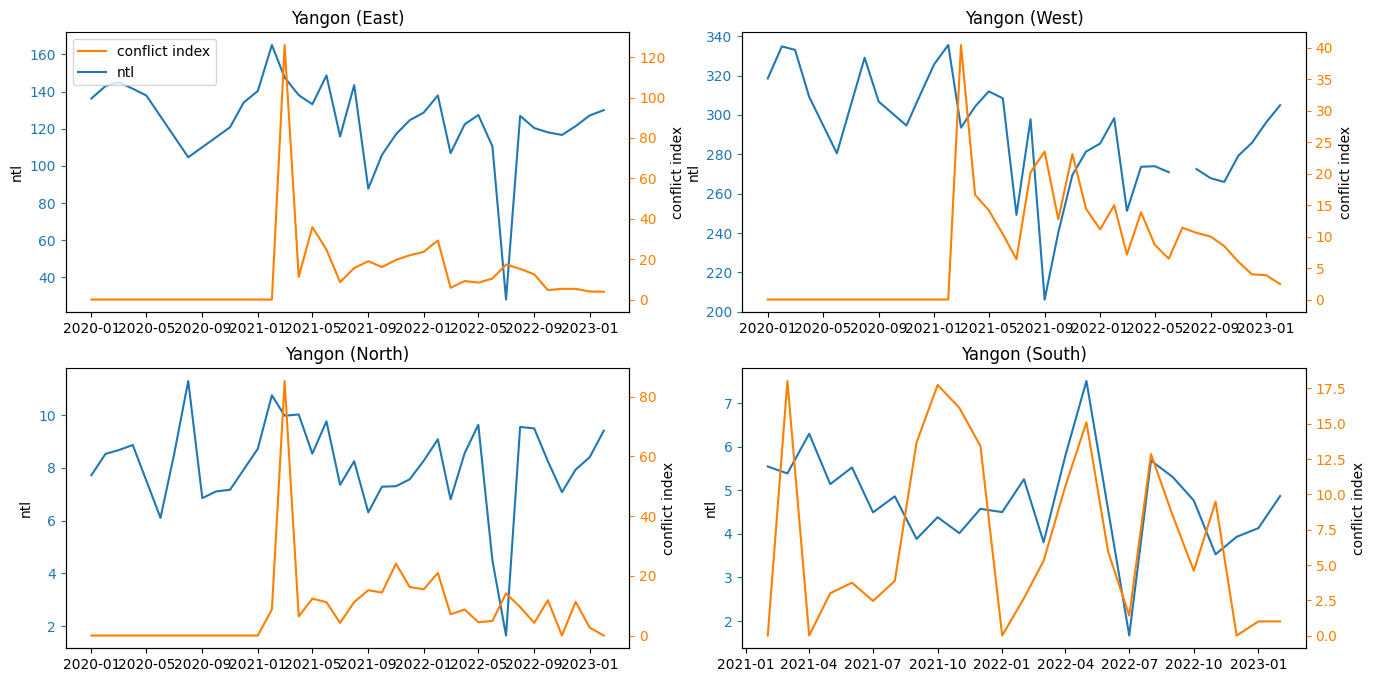
Observe trends between nightlights and ACLED data#
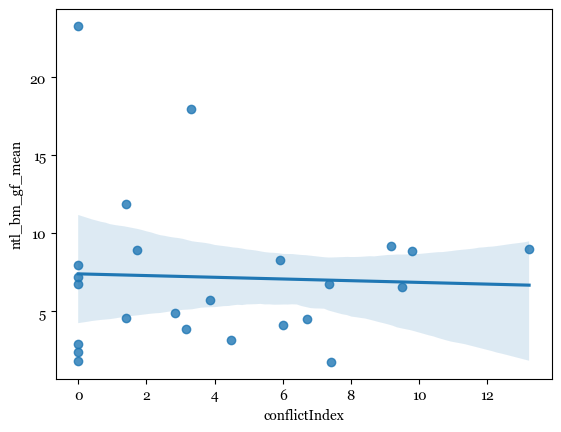
There are too few data points to show a correlation between conflict and Night Time Lights#
import seaborn as sns

sns.regplot(data=df, x=df["conflictIndex"], y=df["ntl_bm_gf_mean"])
<Axes: xlabel='conflictIndex', ylabel='ntl_bm_gf_mean'>
Show code cell source
fig, axs = plt.subplots(2, 2, figsize=(16, 8))
ax = axs.flatten()

for i, ST in enumerate(
    ["Yangon (East)", "Yangon (West)", "Yangon (North)", "Yangon (South)"]
):
    df1 = df[df["NAME_2"] == ST]
    ax[i].plot(df1["date"], df1["ntl_bm_mean"], "#1F77B4", label="ntl")
    ax[i].set_ylabel("ntl")
    ax[i].tick_params("y", colors="#1F77B4")

    ax1 = ax[i].twinx()
    ax1.plot(df1["date"], df1["conflictIndex"], "#FF7F00", label="conflict index")
    ax1.set_xlabel("x")
    ax1.set_ylabel("conflict index")
    ax1.tick_params("y", colors="#FF7F00")

    ax[i].spines["top"].set_visible(False)
    ax[i].spines["top"].set_visible(False)

    lines = ax1.get_lines() + ax[i].get_lines()
    labels = [line.get_label() for line in lines]
    ax[0].legend(lines, labels, loc="upper left")

    ax[i].set_title(ST)