Demographics of Myanmar#
To overcome gaps in official demographic statistics, the team has turned to private sector data sources. The Data Lab used algorithmically generated data such as that released by Meta.
Additionally, the team also extracted the Relative Wealth Index data from Meta which helps identify differences in standard of living in the population.
Data#
High Resolution Population Density#
In partnership with the Center for International Earth Science Information Network (CIESIN) at Columbia University, Meta uses state-of-the-art computer vision techniques to identify buildings from publicly accessible mapping services to create these population datasets. These maps are available at 30-meter resolution. These maps aren’t built using Facebook data and instead rely on applying machine vision AI to satellite imagery and census information. This data is made accessible to this team through the Development Data Partnership. The available version of the data was last updated in 2019.
The Population Data is demographically disaggregated into the following categories
Men
Women
Children under 5
Elderly
Women of Reproductive Age (15-49)
Youth (15-24)
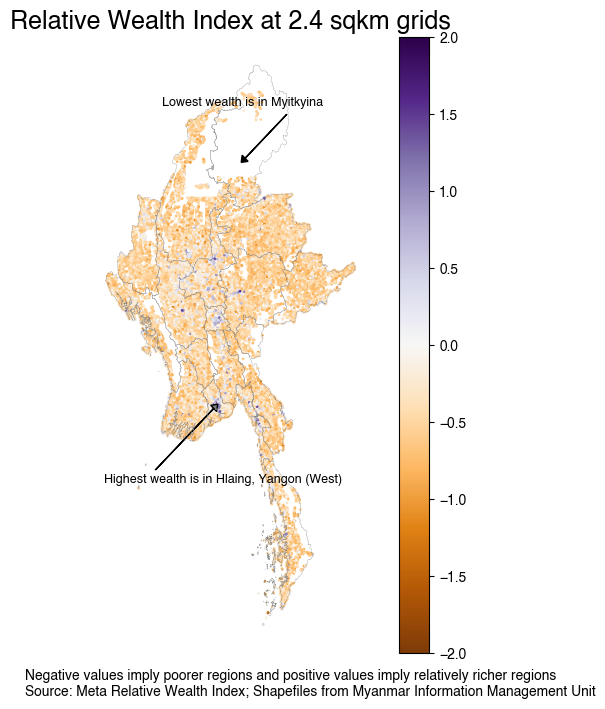
Relative Wealth Index#
The Meta Relative Wealth Index predicts the relative standard of living within countries using privacy protecting connectivity data, satellite imagery, and other novel data sources. To calculate this index, Meta uses measurements of household wealth collected through face-to-face surveys conducted by the United States Agency for International Development with 1,457,315 unique households living in 66,819 villages in 56 different LMICs around the world. Following this, they use spatial markers to link villages to non-traditional data sources , including satellite imagery, cellular network data, topographic maps, and privacy protecting connectivity data from Facebook. They process the non-traditional data using deep learning and other computational algorithms, which convert the raw data to a set of quantitative features for each village. They use these features to train a supervised machine learning model that predicts the relative wealth of each populated 2.4km2 grid cell on the planet, even in regions where no ground truth data exists (Chi et. al., 2022).
The Relative Wealth Index is a number that compared the wealth within the country where negative RWI implies poorer areas and positive RWI implies richer areas.
Methodology and Implementation#
The data extracted from Meta was then aggregated to different admin levels using the shapefiles available on Myanmar information Management Unit. These datasets are made available on SharePoint.
Findings#
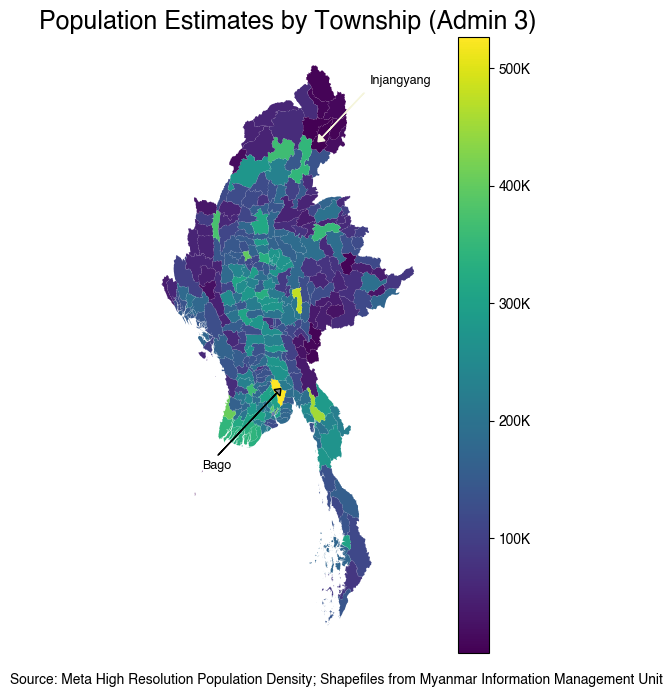
Popultion Estimates#
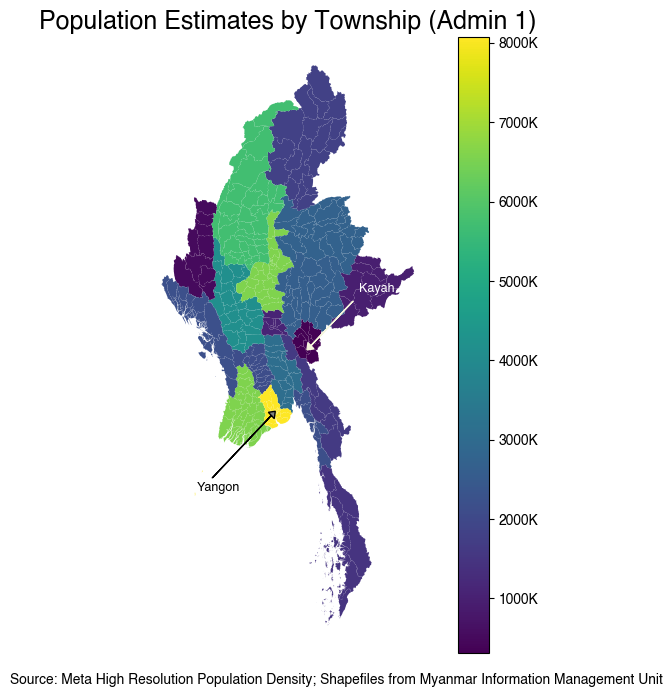
Observations and Limitations#
The data is from 2019. Myanmar has seen a lot of conflict and political unrest, aside from a pandemic since then. The numbers shown here do not reflect any of the recent changes in population movement.
The regions close to the Bangladesh border (Cox’s Bazar) and the regions close to the Chinese border are less populated compared to regions close to the Thailand border.
Bago, a township north of Yangon is the most populous township.
Yangon is the most populous region
Relative Wealth Distribution#
Comparing Relative Wealth across the Regions of Myanmar#
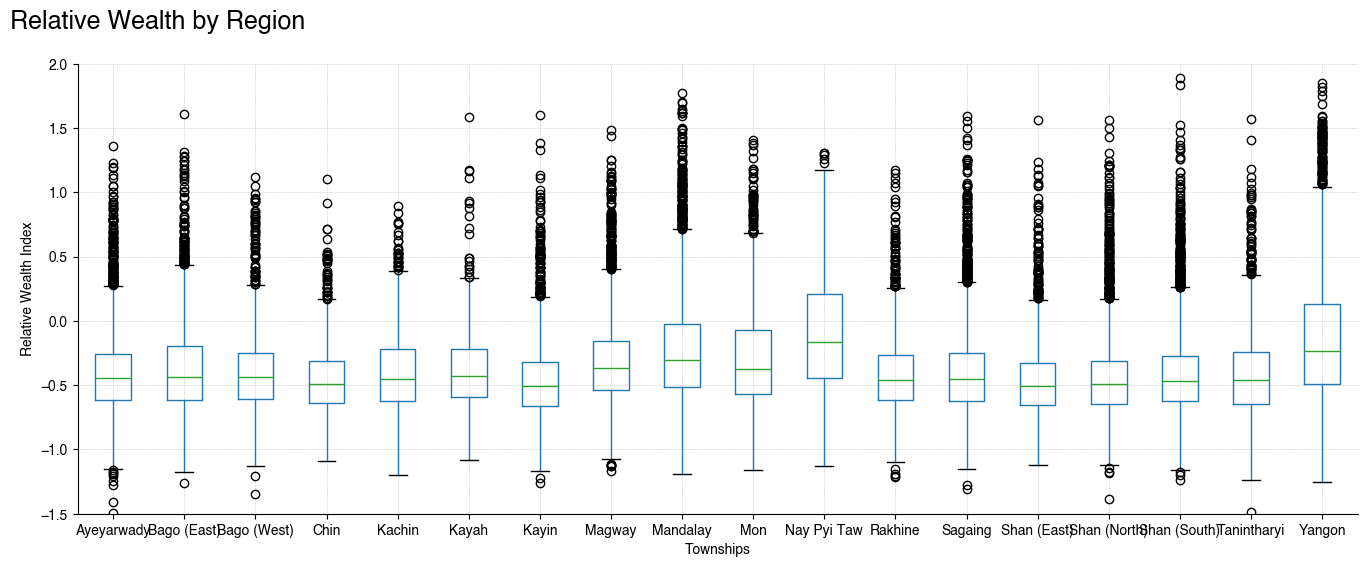
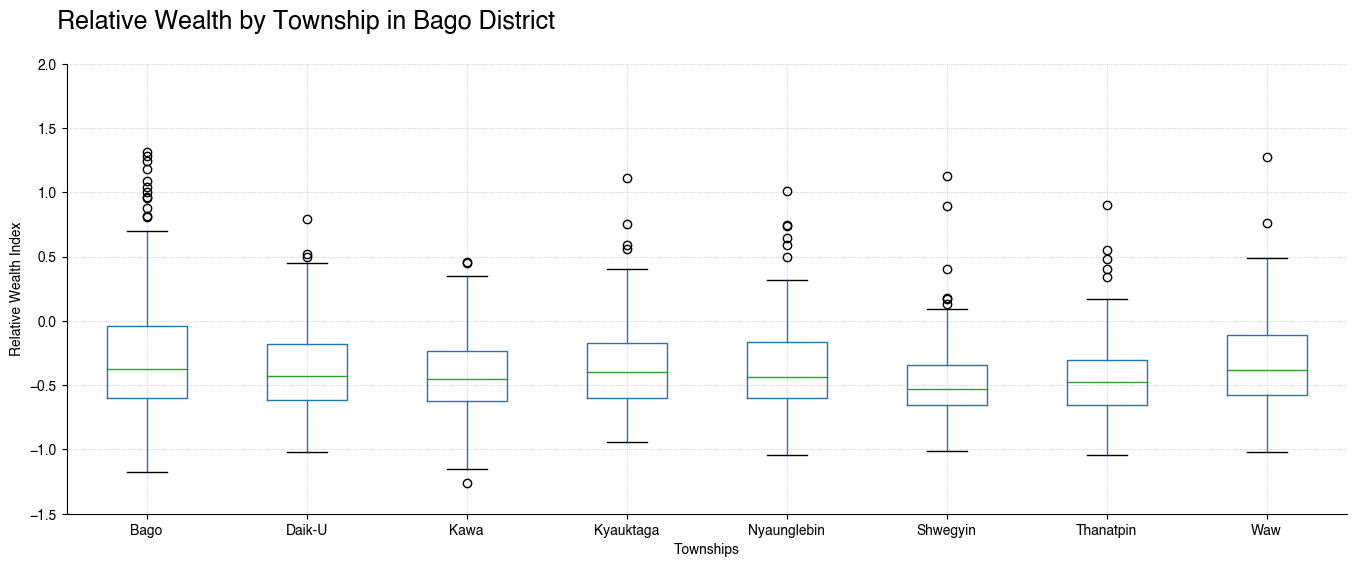
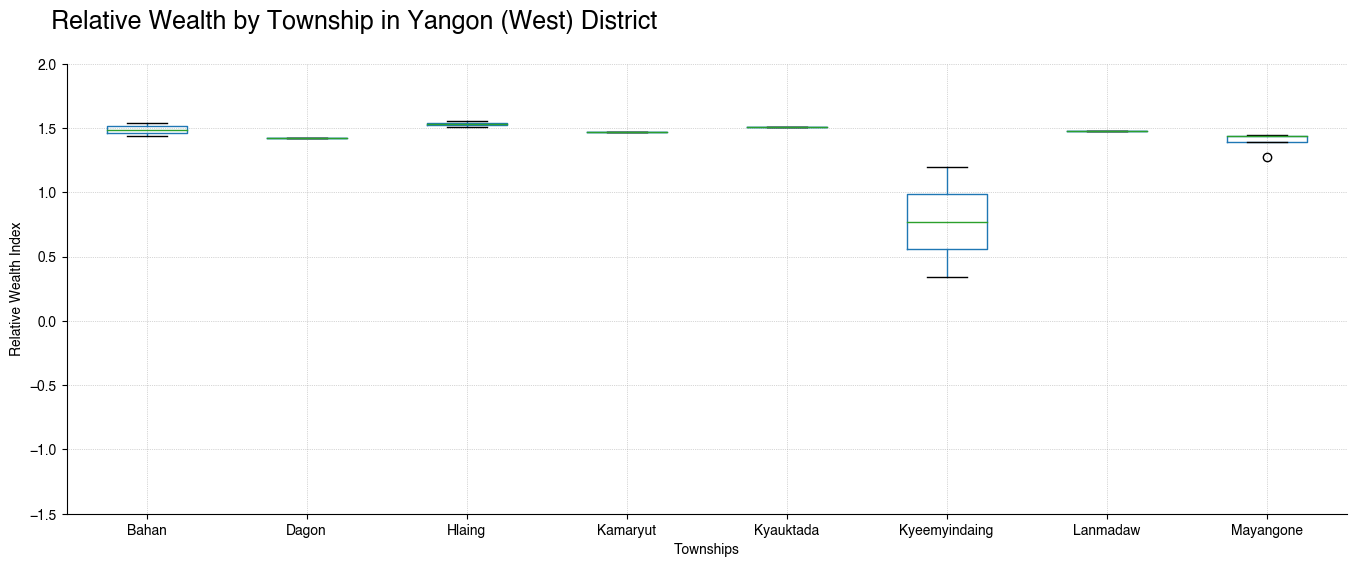
Observations and Limitations#
Yangon (West) is significantly wealthier. However, Hlaing, the richest township is also much smaller in area compared to the Bago township.
There is a lot of income inequality in the most populous district of Myanmar with the average being relatively poor than the rest of the nation. This average is likely brought down by the extremely ric parts of Yangon (West).