Nighttime Lights in Myanmar#
Data & Methodology Note:
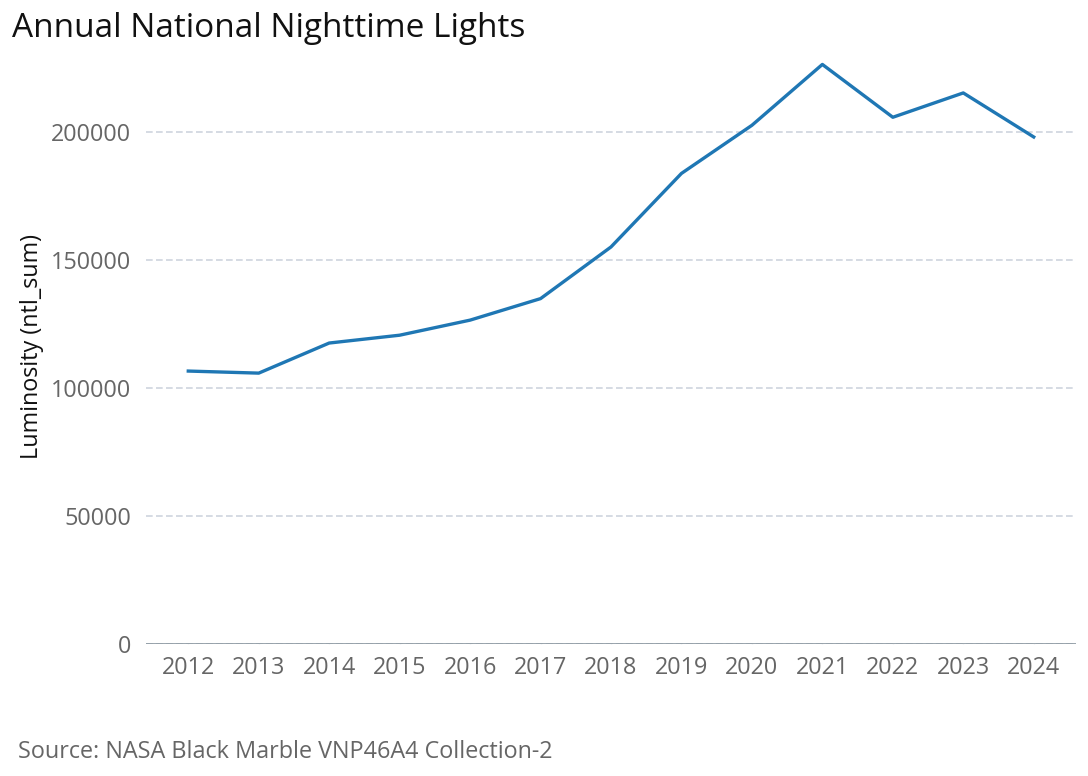
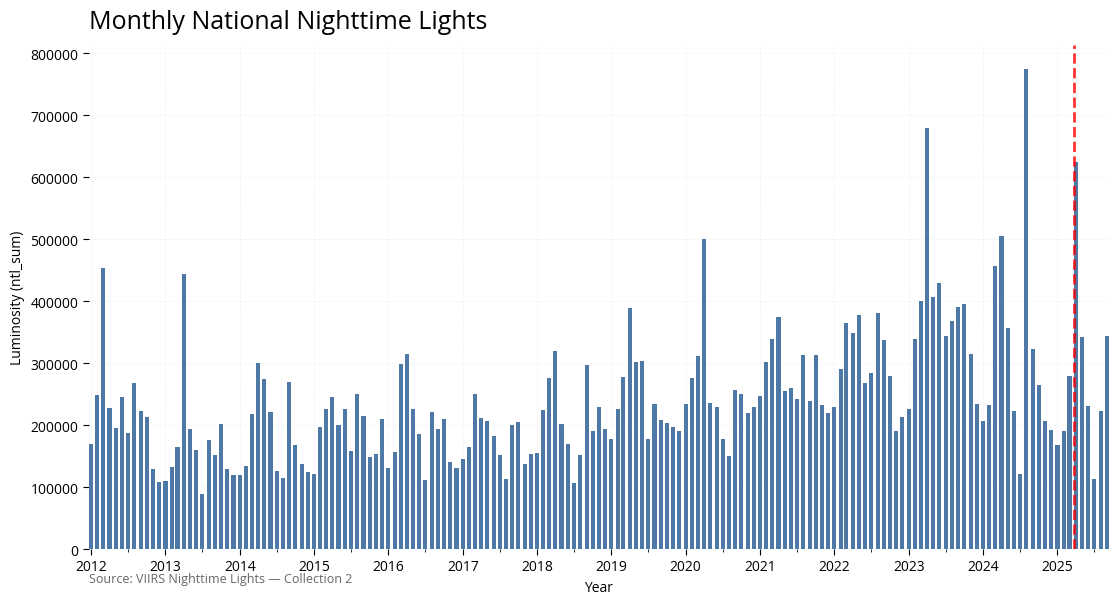
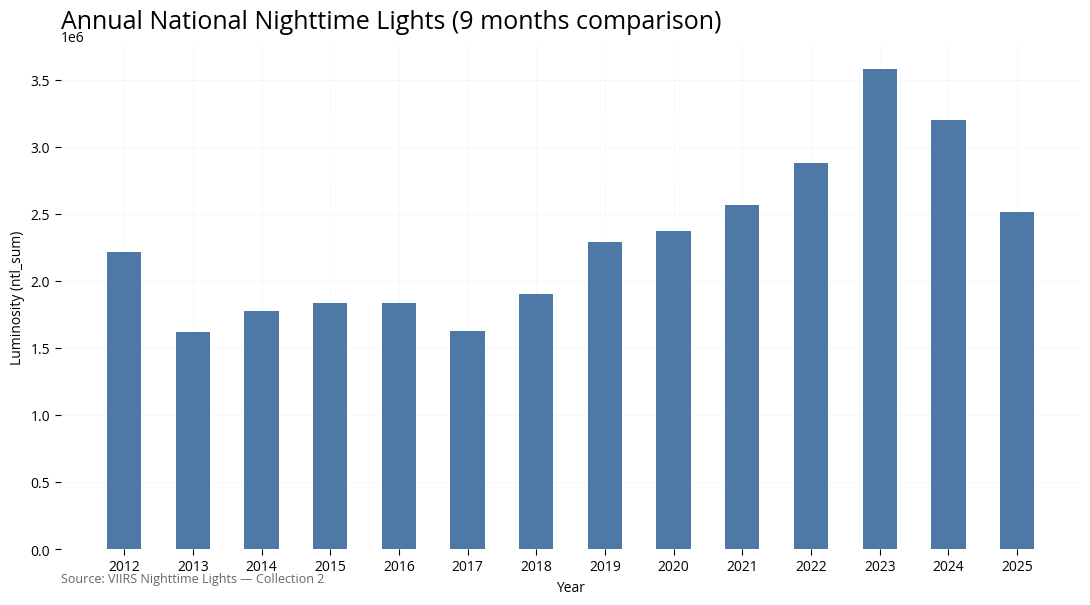
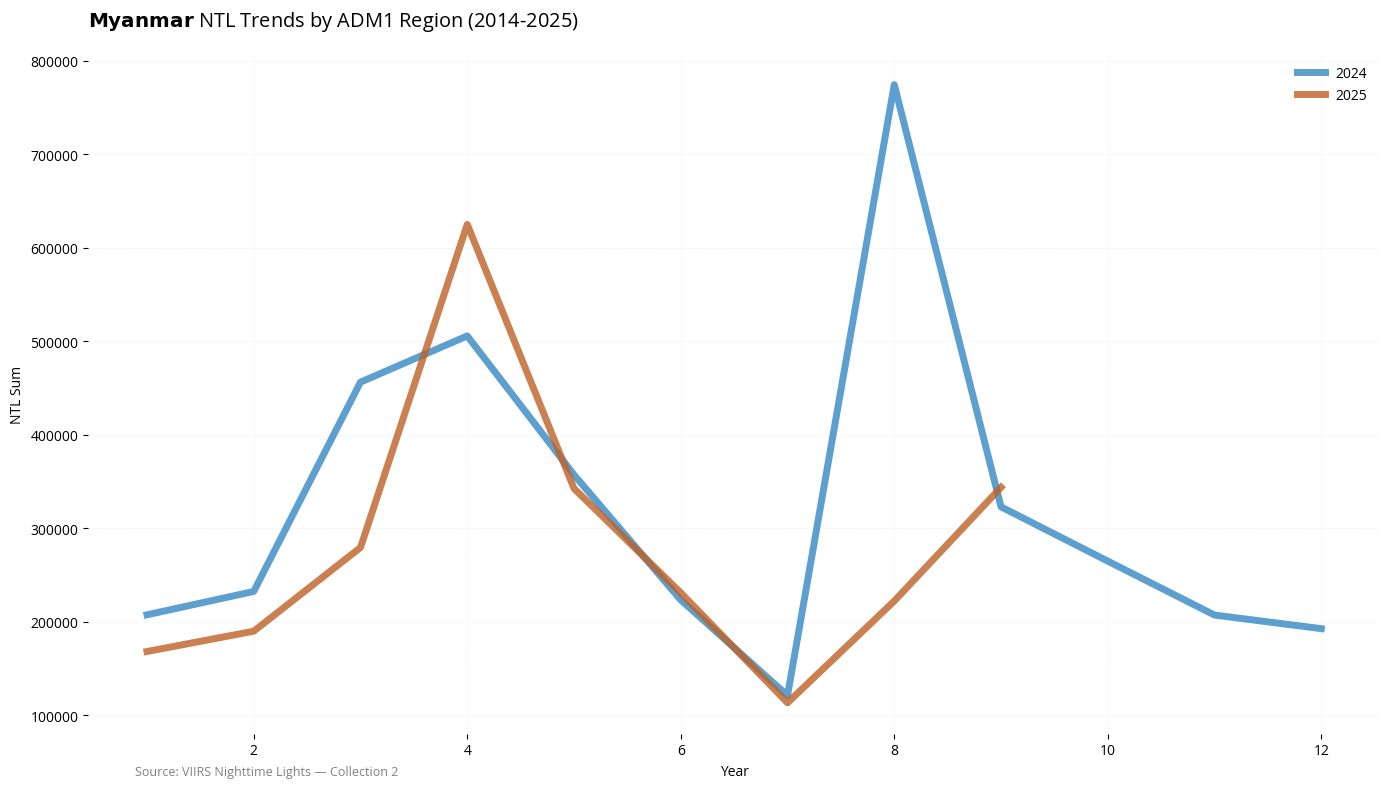
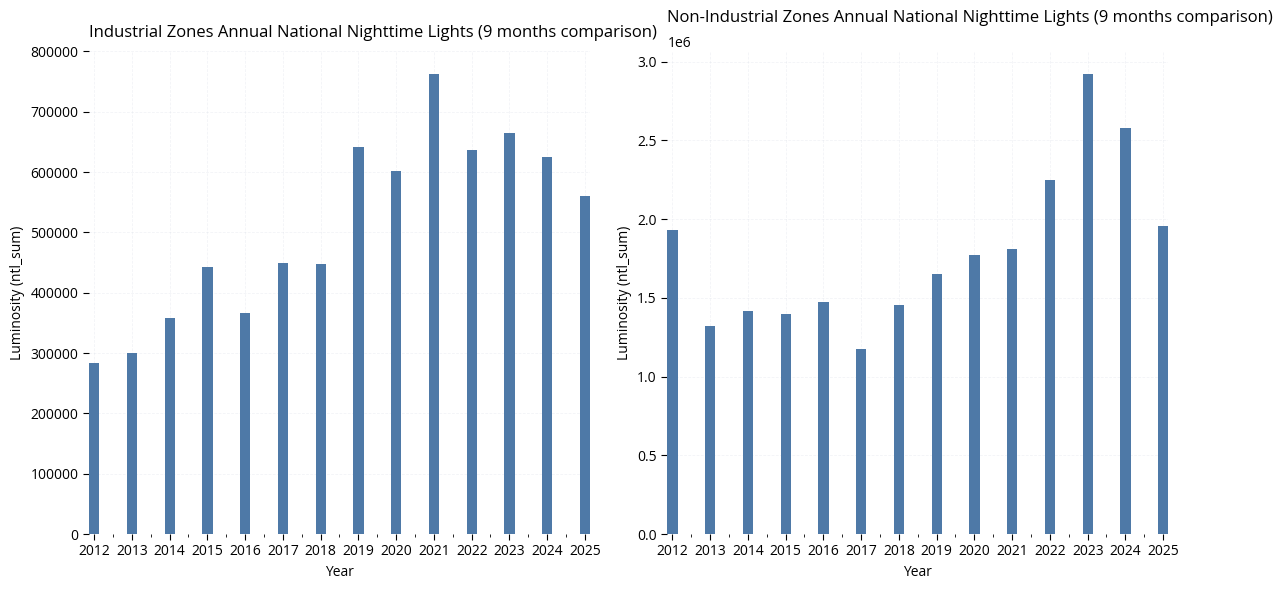
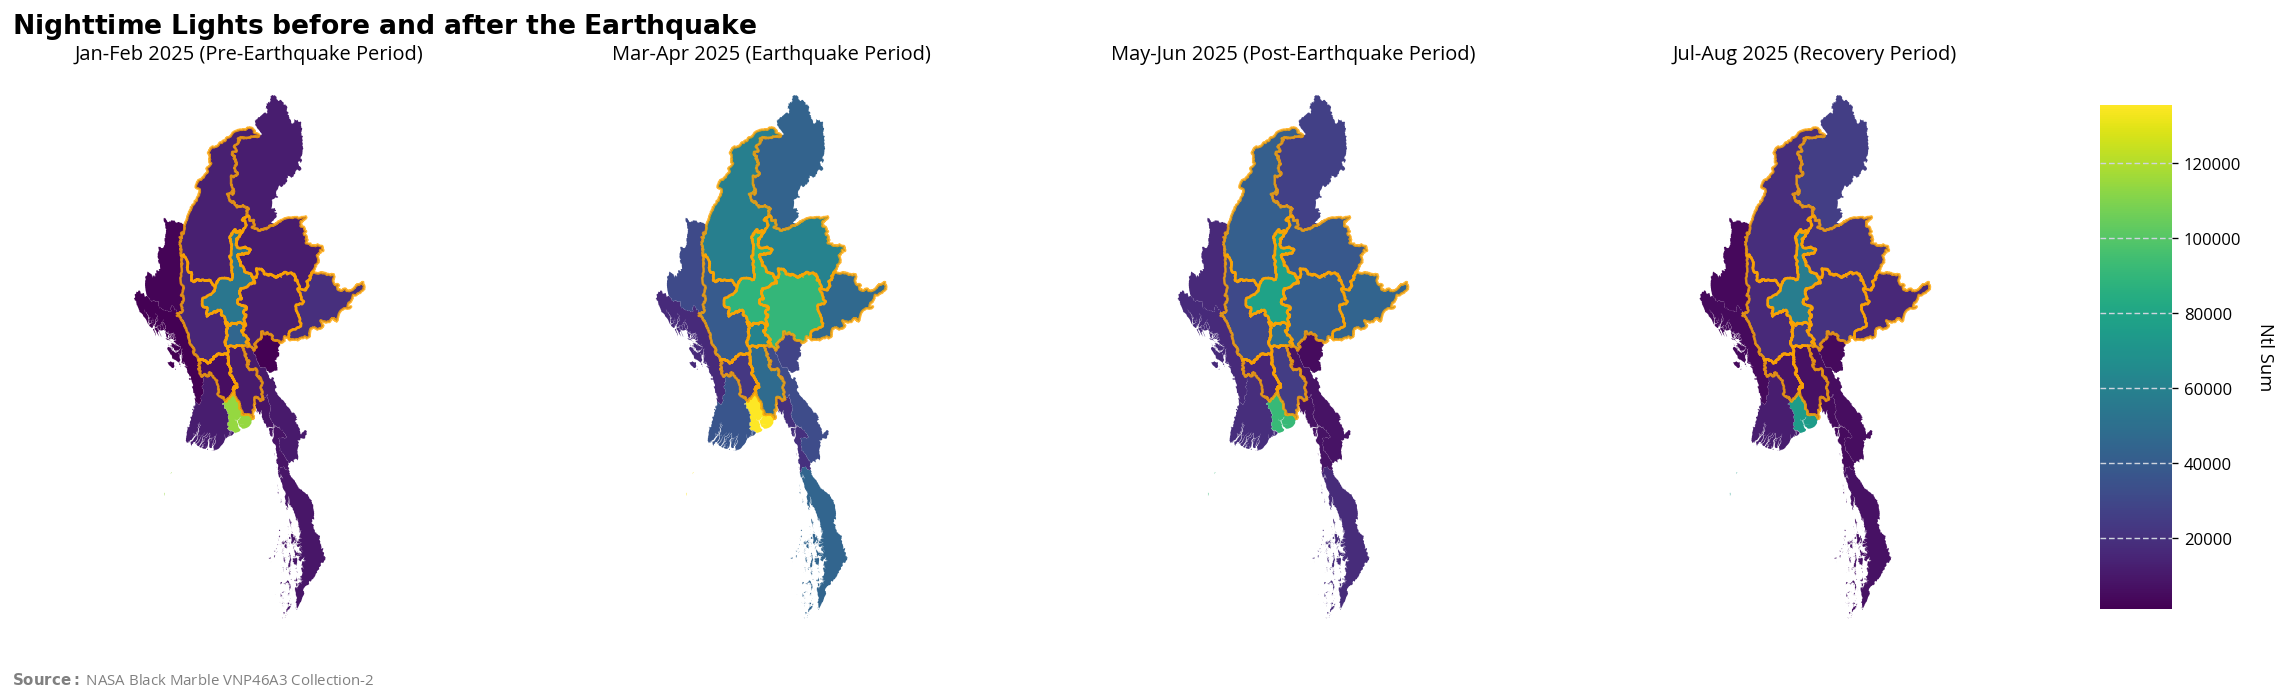
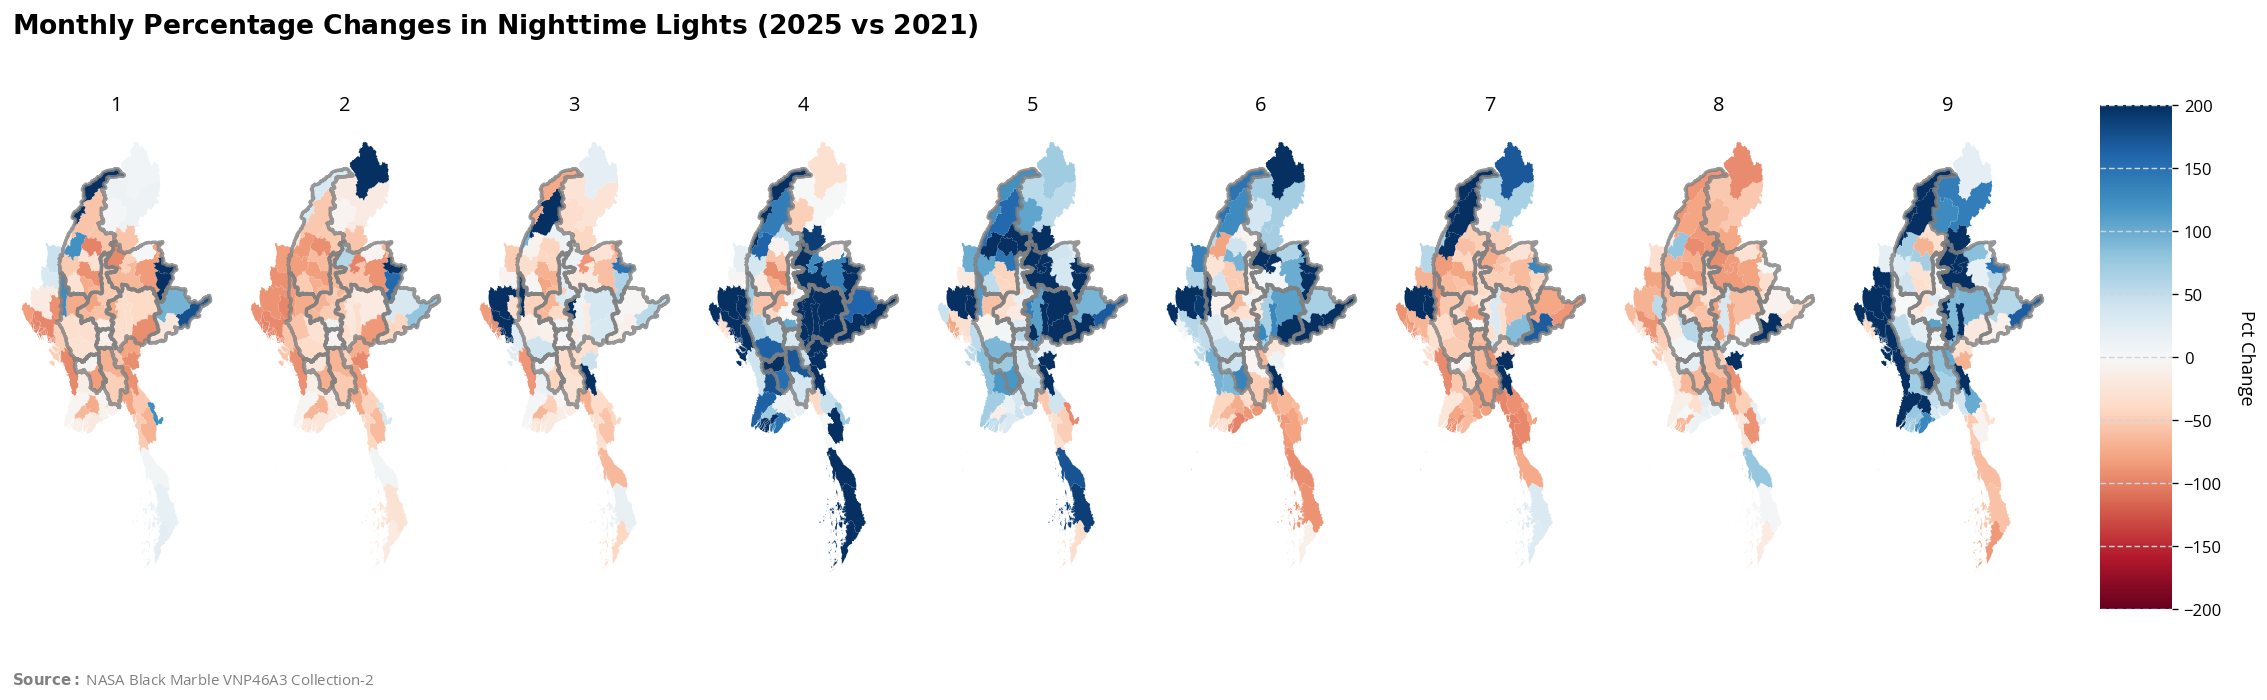
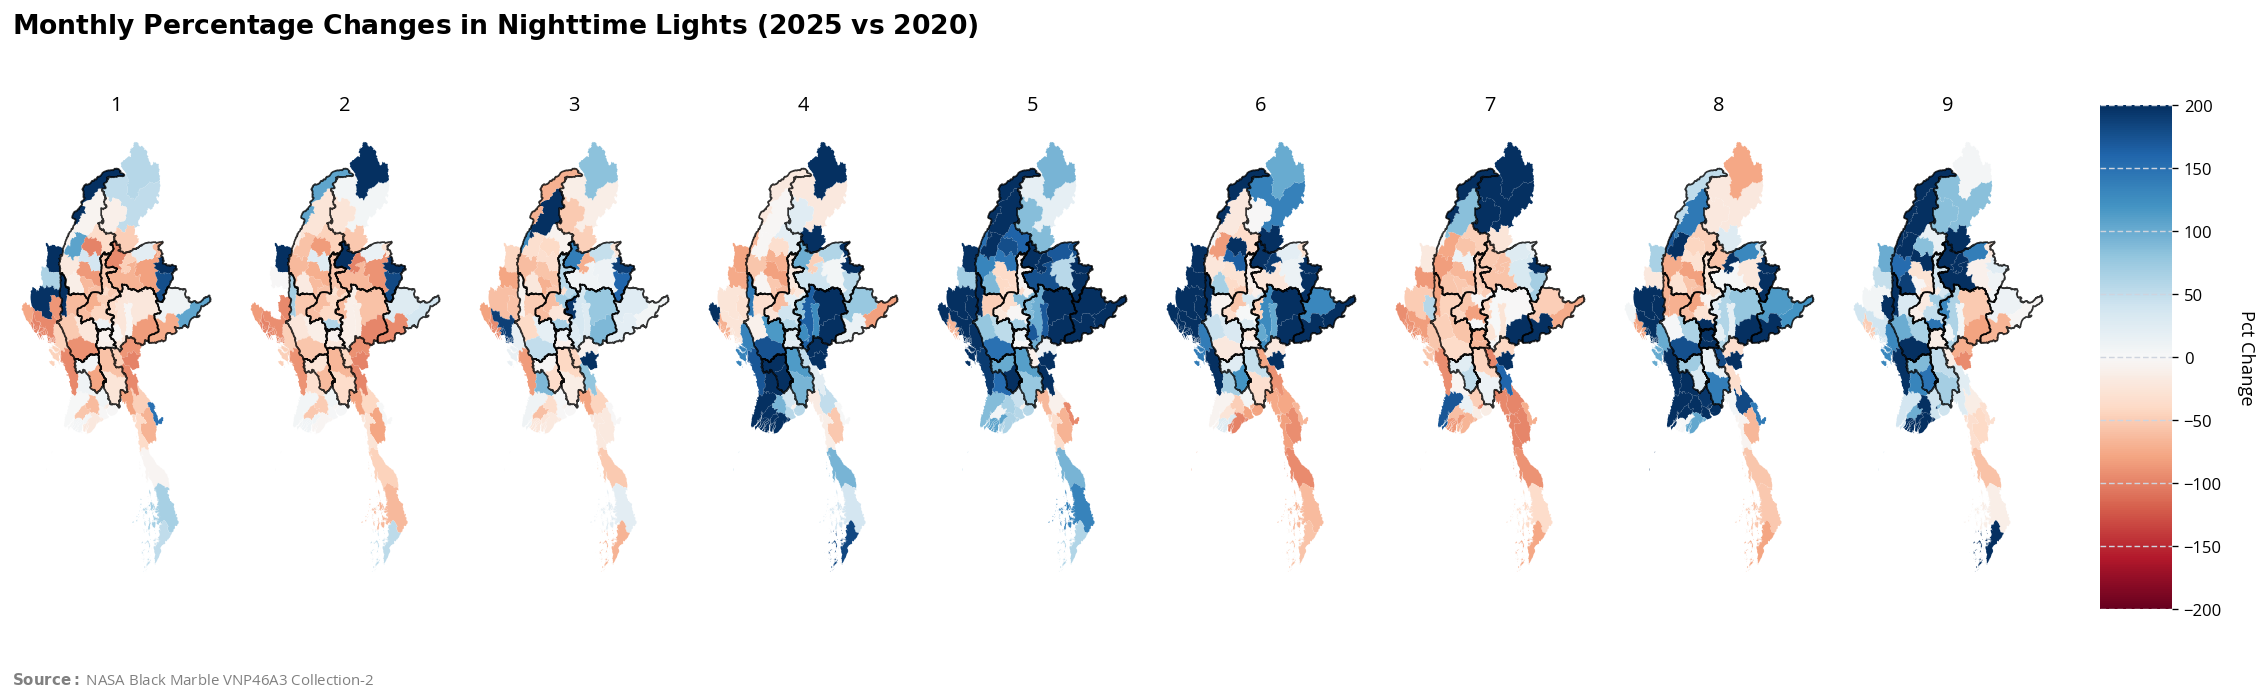
This notebook uses VIIRS Nighttime Lights Collection 2 monthly and annual products. For all analyses and visualizations where the year 2025 is shown, monthly data are aggregated to the annual level to ensure completeness, as the official annual product for 2025 may not be available yet. All other years use the official annual product where possible.
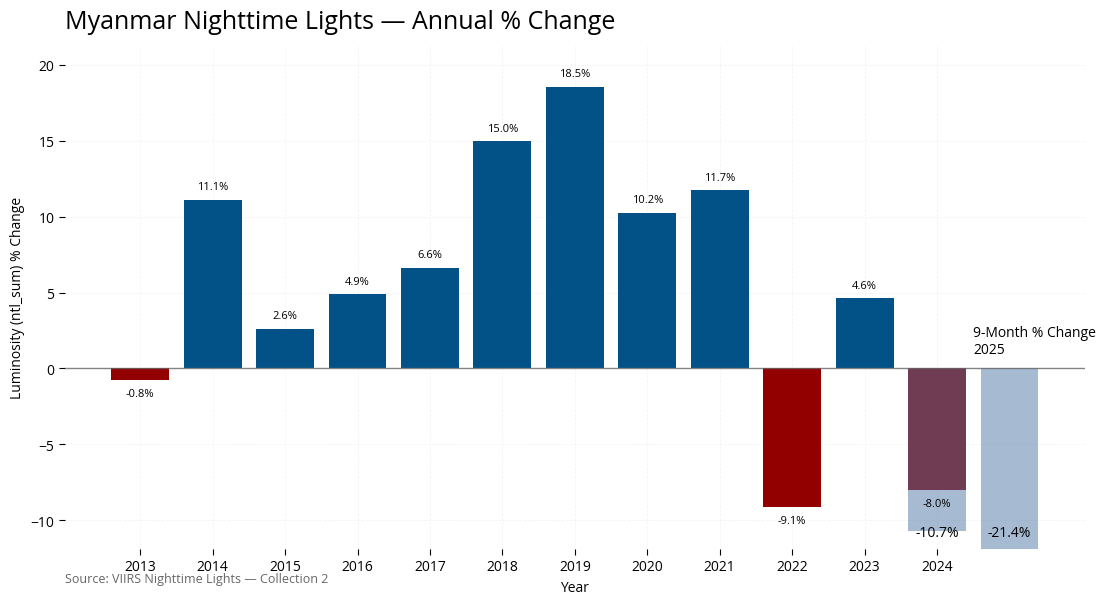
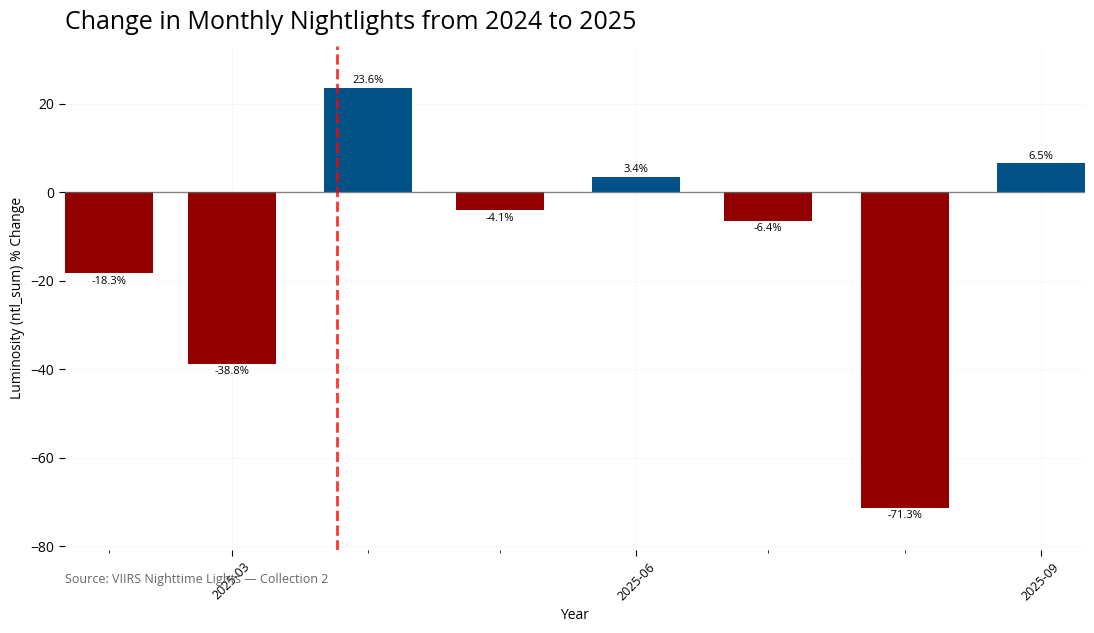
(<Figure size 1200x600 with 1 Axes>,
 <Axes: xlabel='Year', ylabel='Luminosity (ntl_sum) % Change'>)
The autoreload extension is already loaded. To reload it, use:
  %reload_ext autoreload
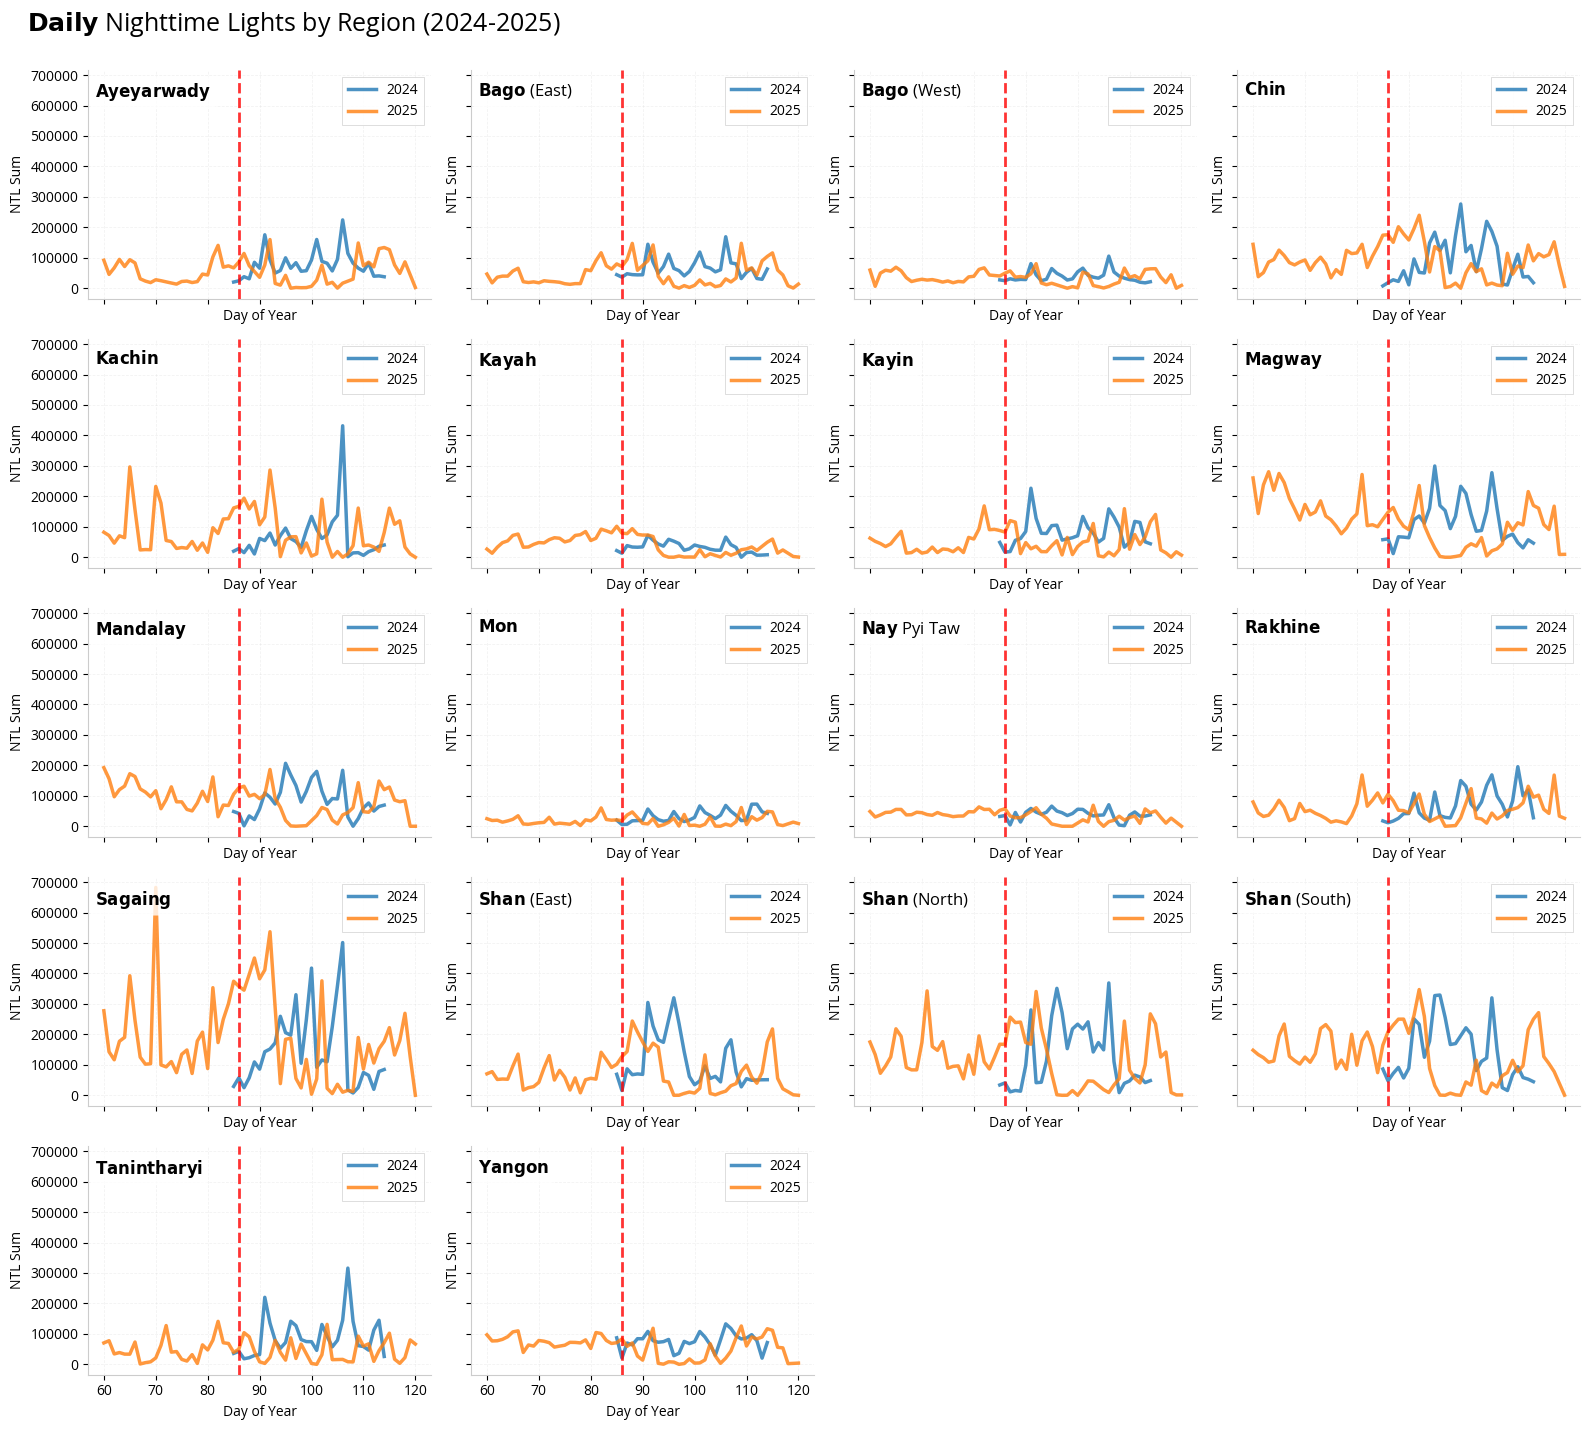
Trends in Earthquake Impacted Regions#
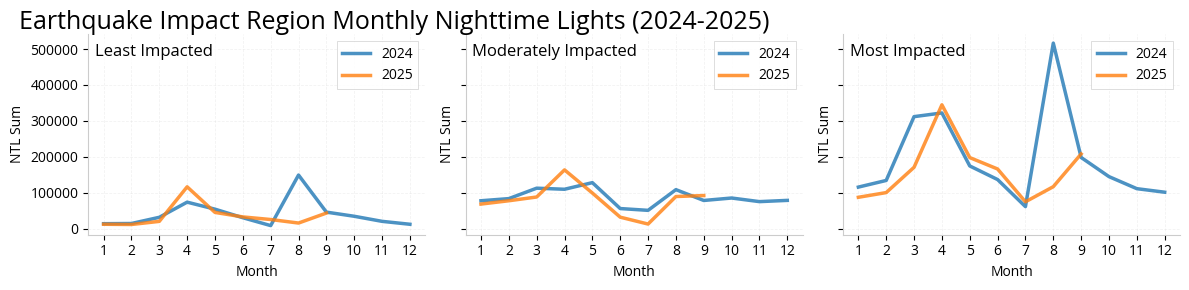
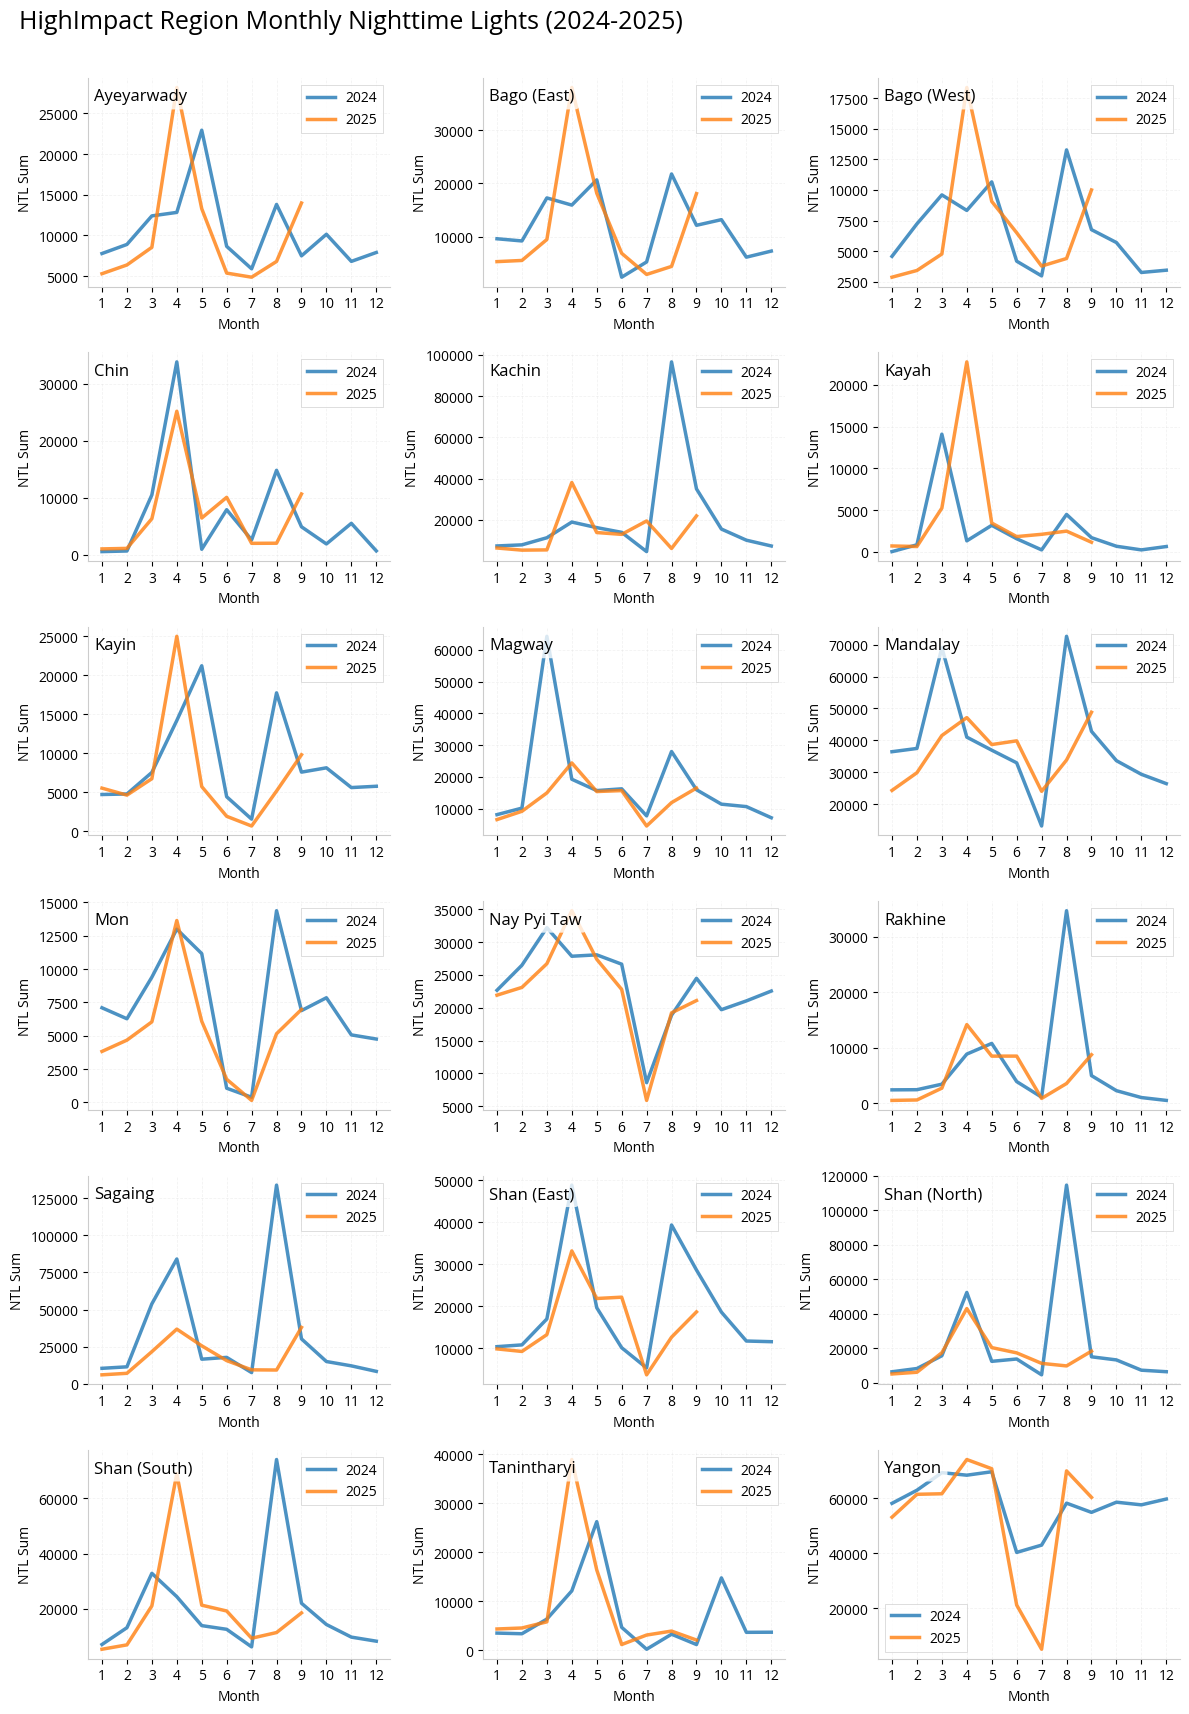
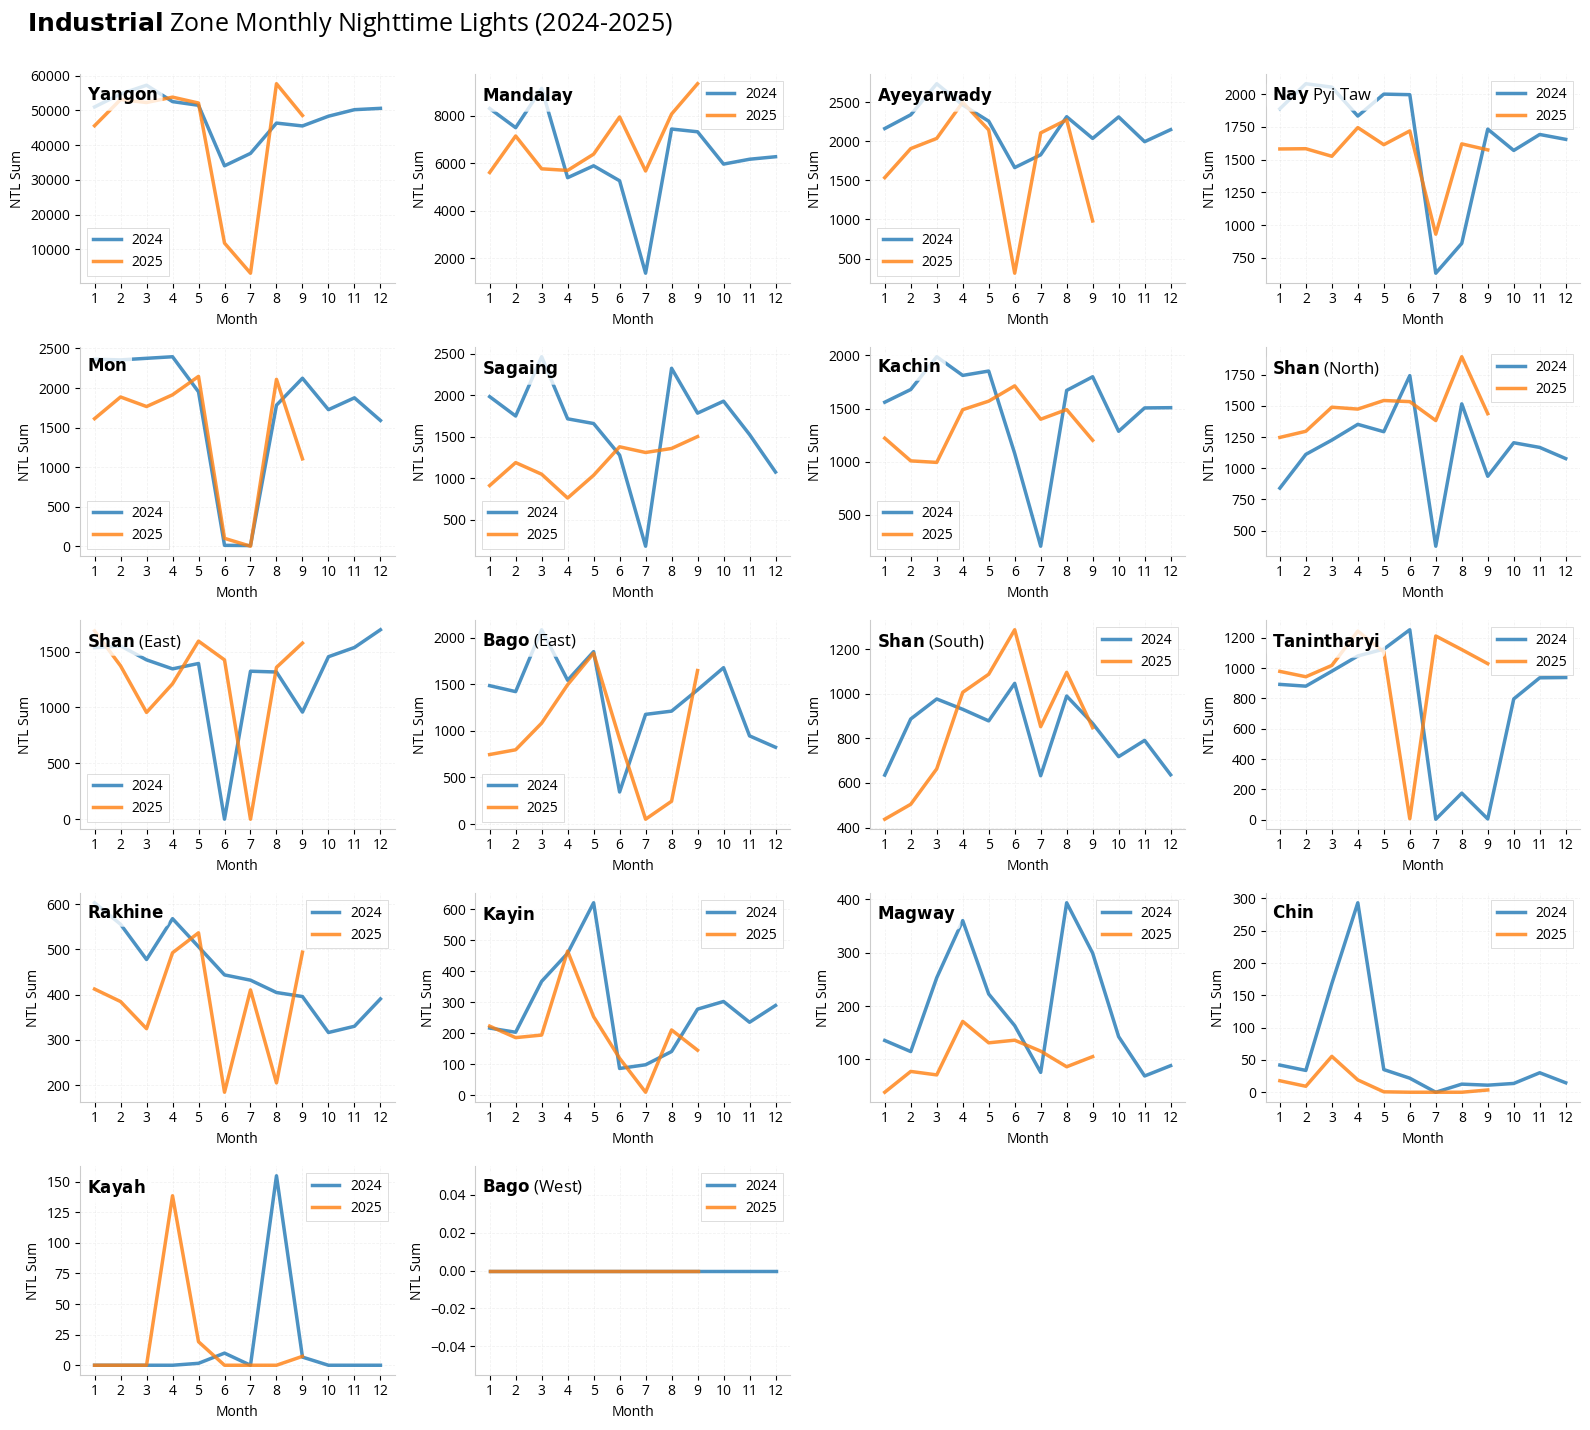
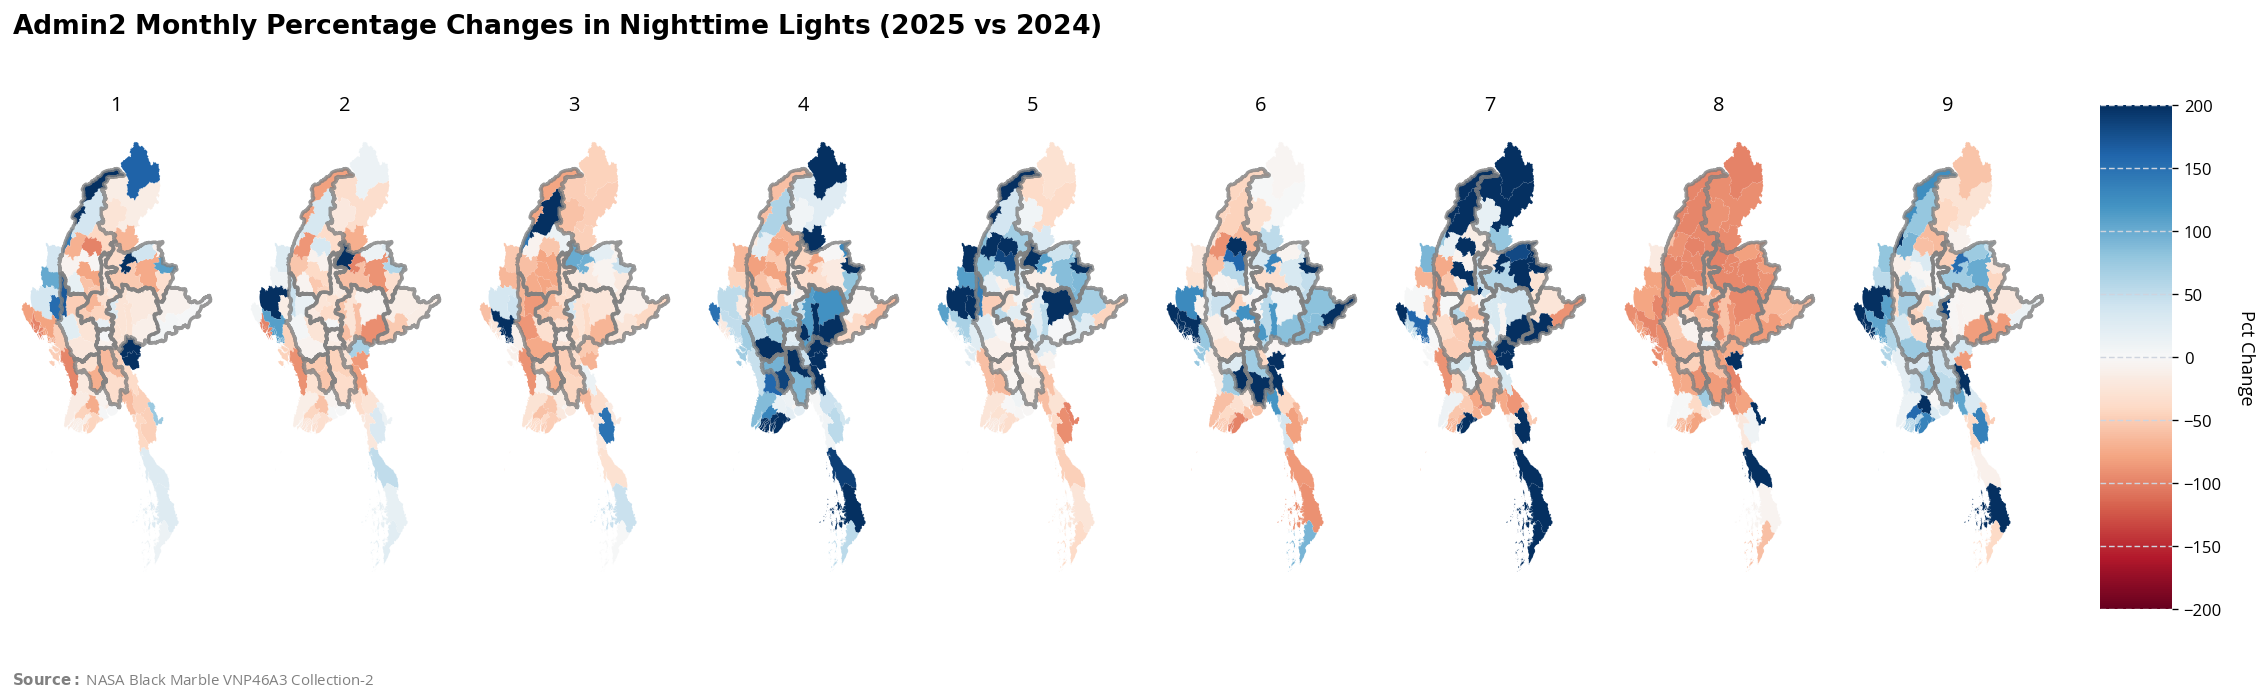
Shan South and Bago East, in the high impact earthquake regions saw an increase in lights after the earthquake
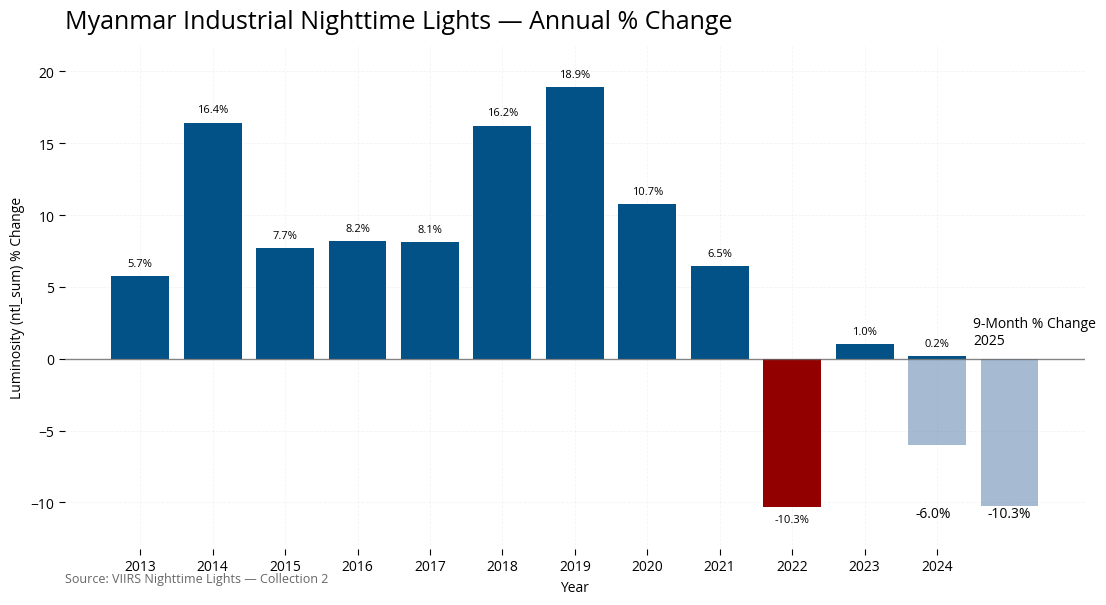
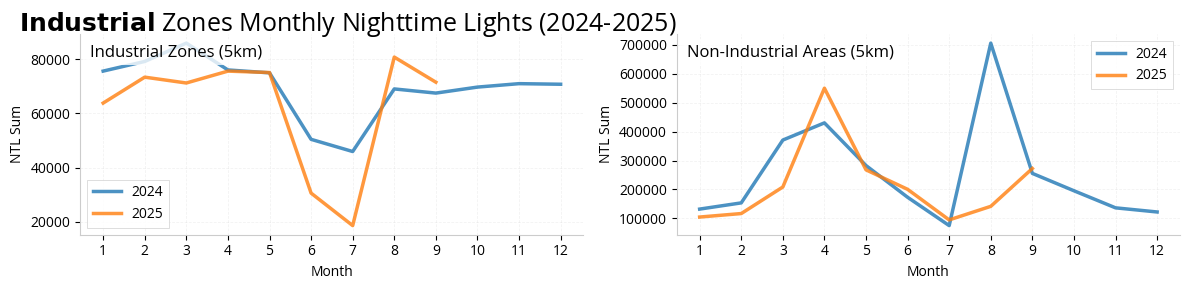
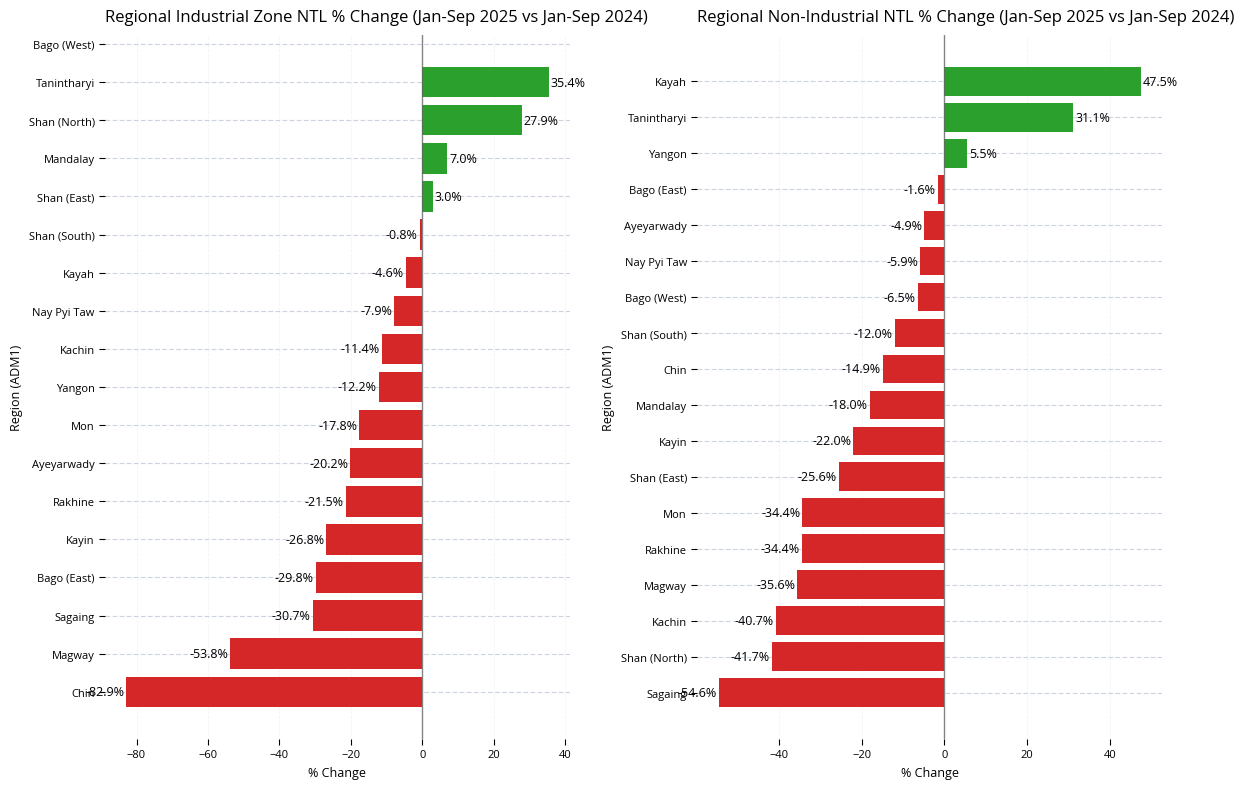
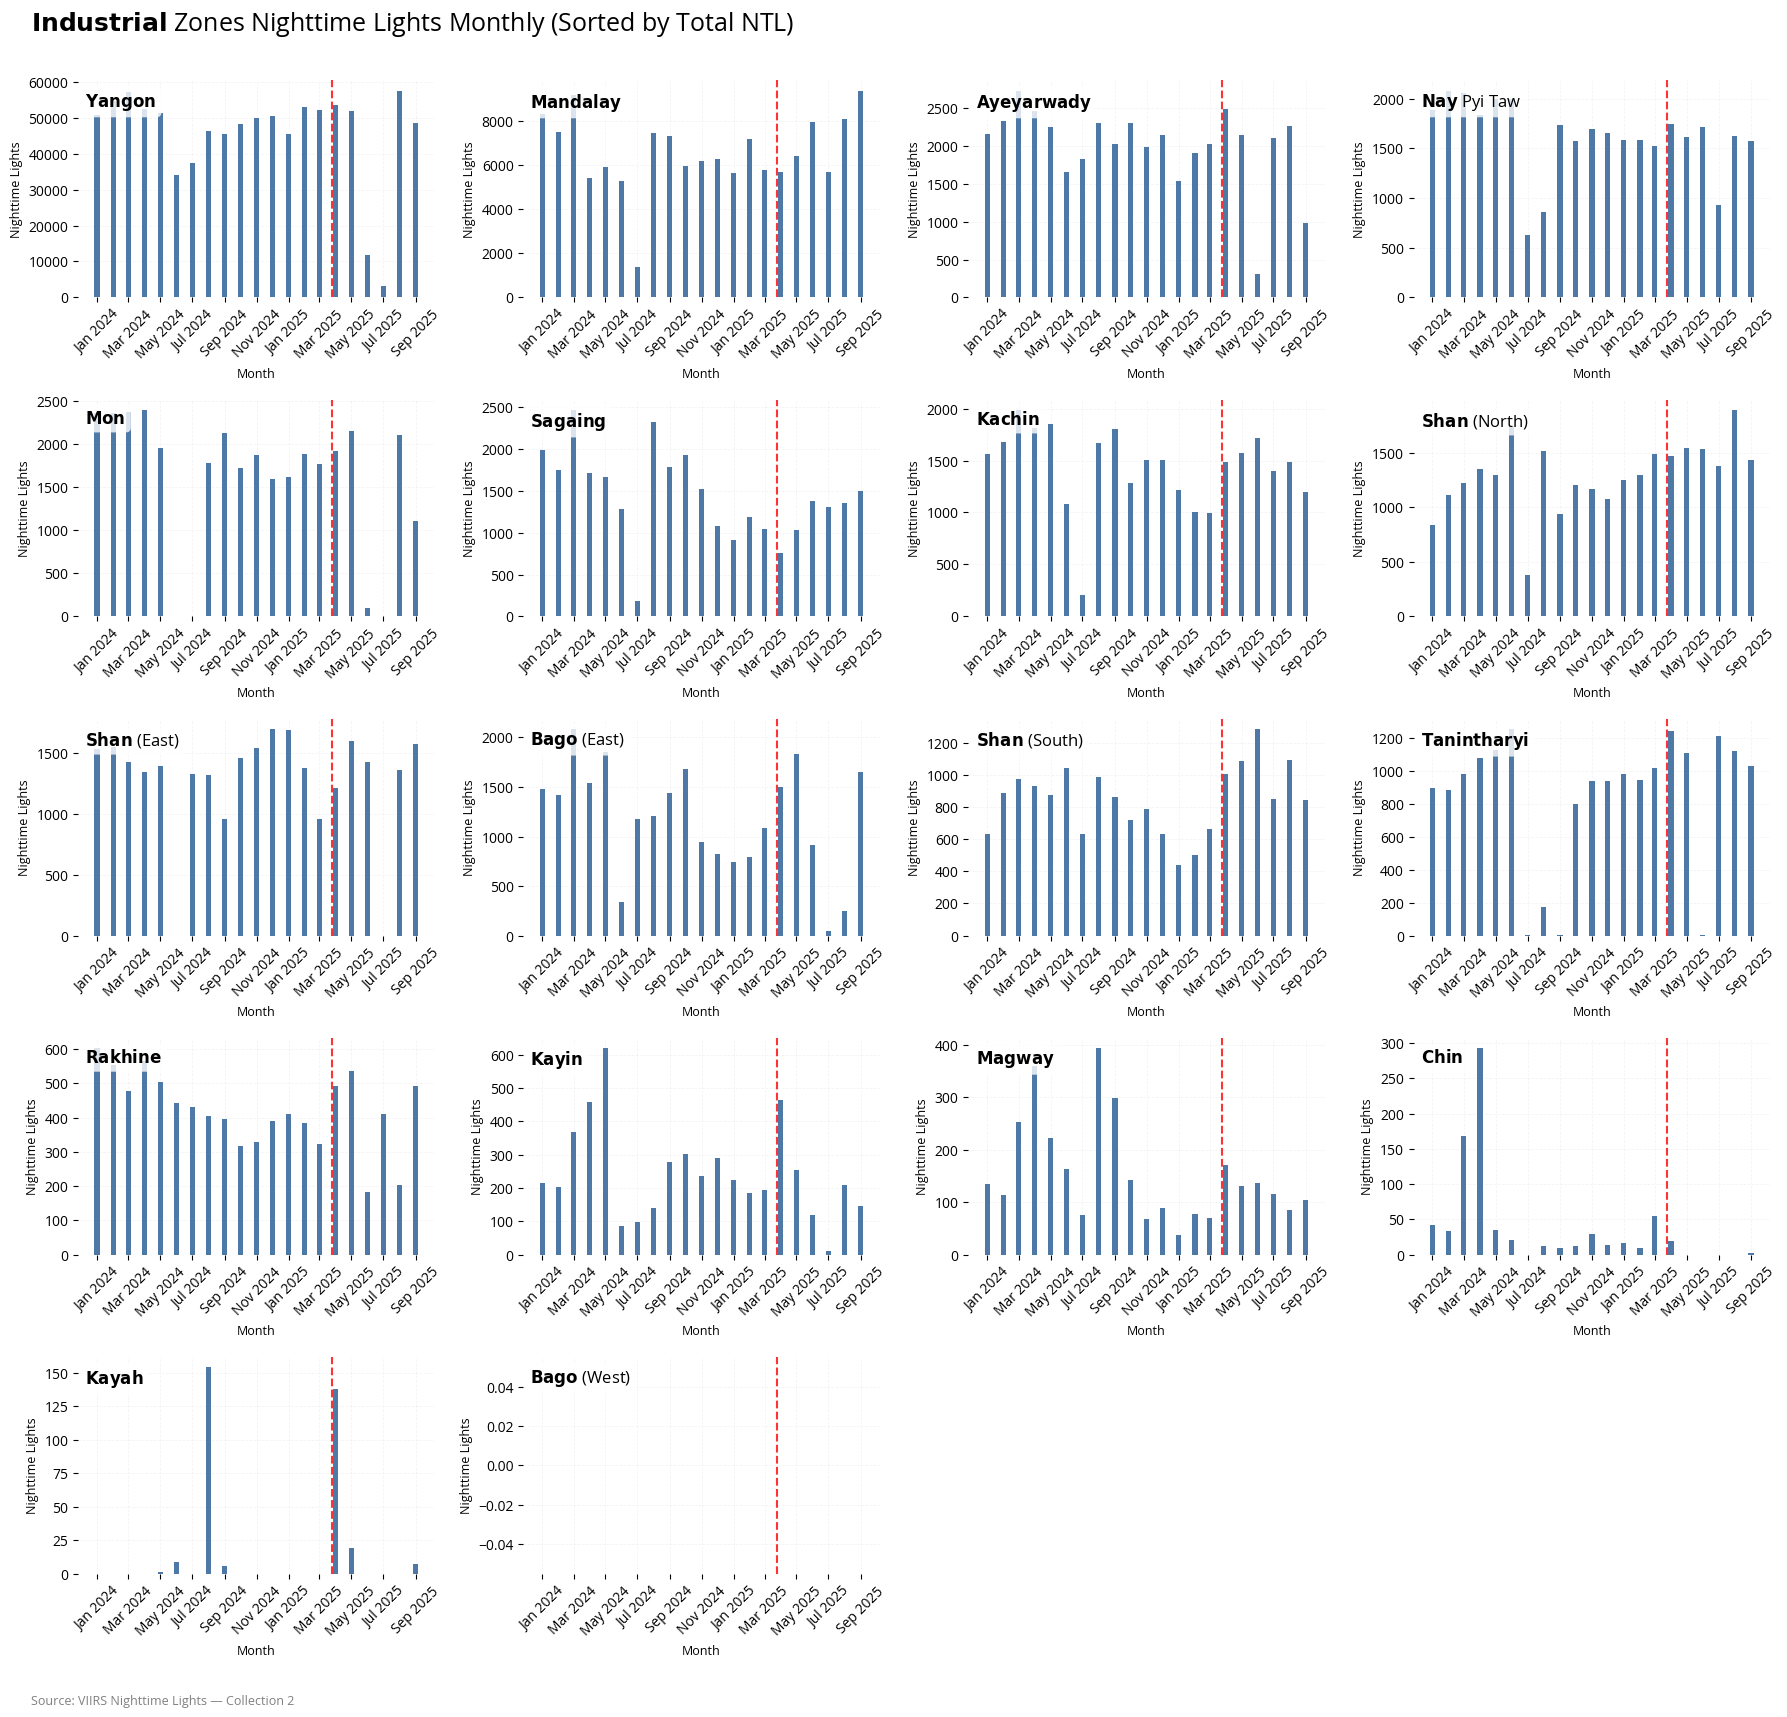
Nighttime Lights in Industrial Zones#
/var/folders/gs/_227cnyd0pq1fr817_0jbcyw0000gp/T/ipykernel_15061/671949646.py:15: SettingWithCopyWarning:
A value is trying to be set on a copy of a slice from a DataFrame.
Try using .loc[row_indexer,col_indexer] = value instead

See the caveats in the documentation: https://pandas.pydata.org/pandas-docs/stable/user_guide/indexing.html#returning-a-view-versus-a-copy
  df["ADM1_EN"] = pd.Categorical(
Dive Dive into Bago and Shan#
--- Statistics ---
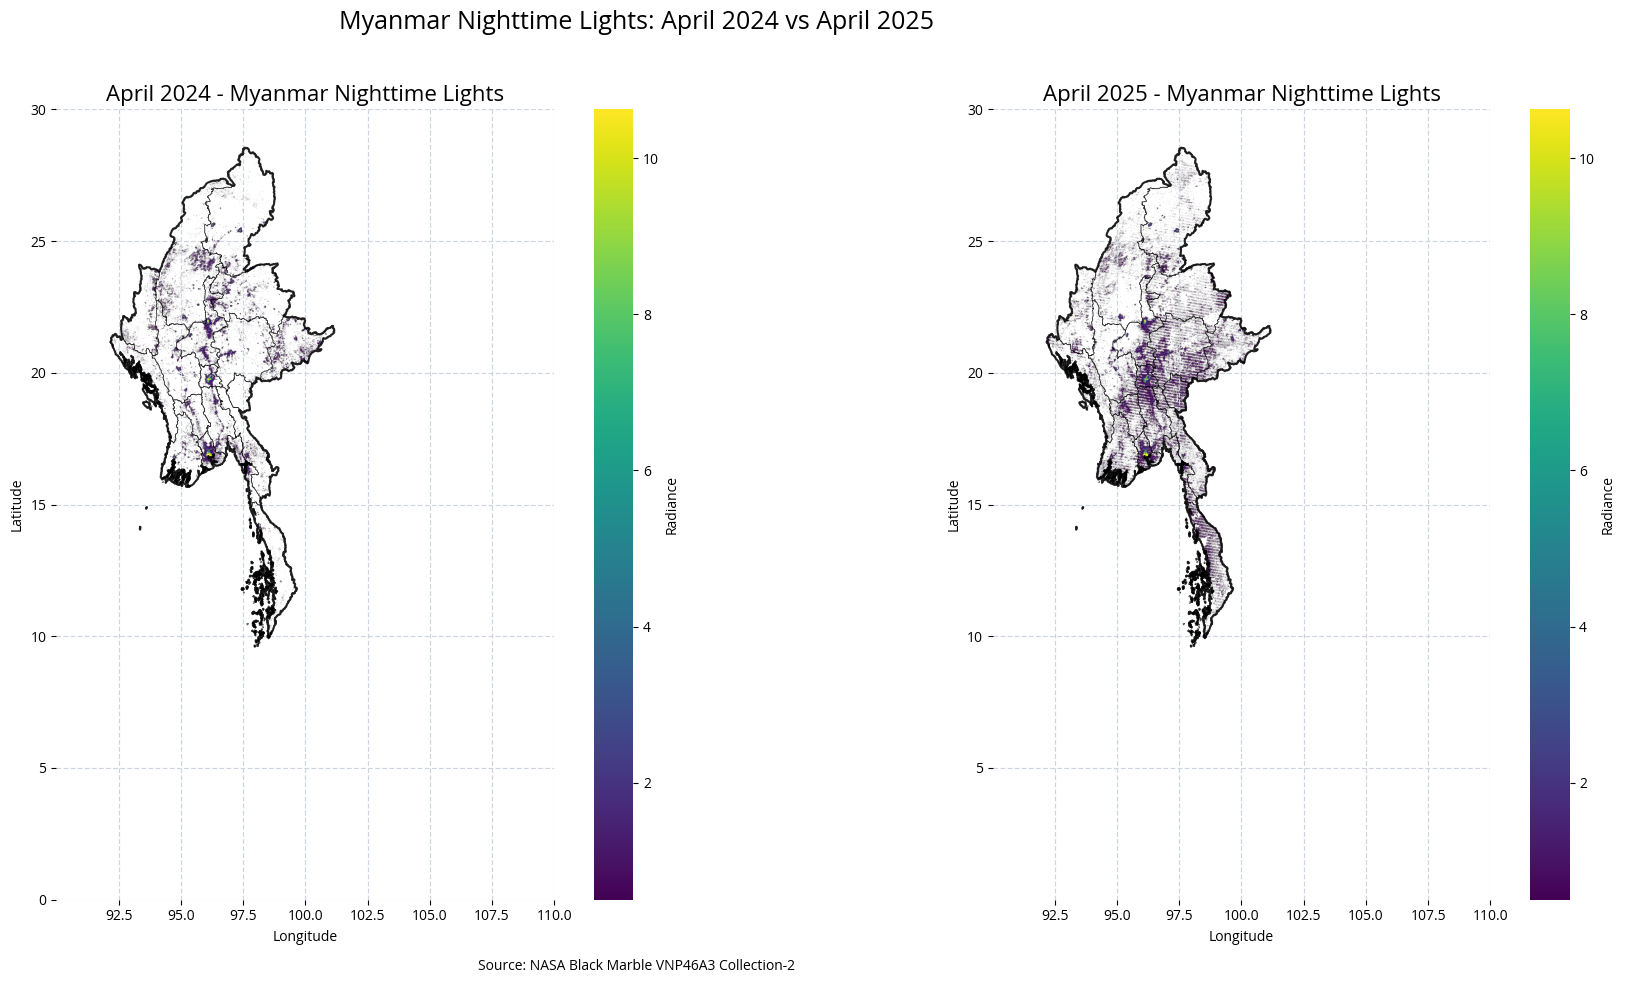
April 2024: Mean=1.47, Max=450.42
April 2025: Mean=0.90, Max=987.33
Change: -38.69%
Change: -38.69%
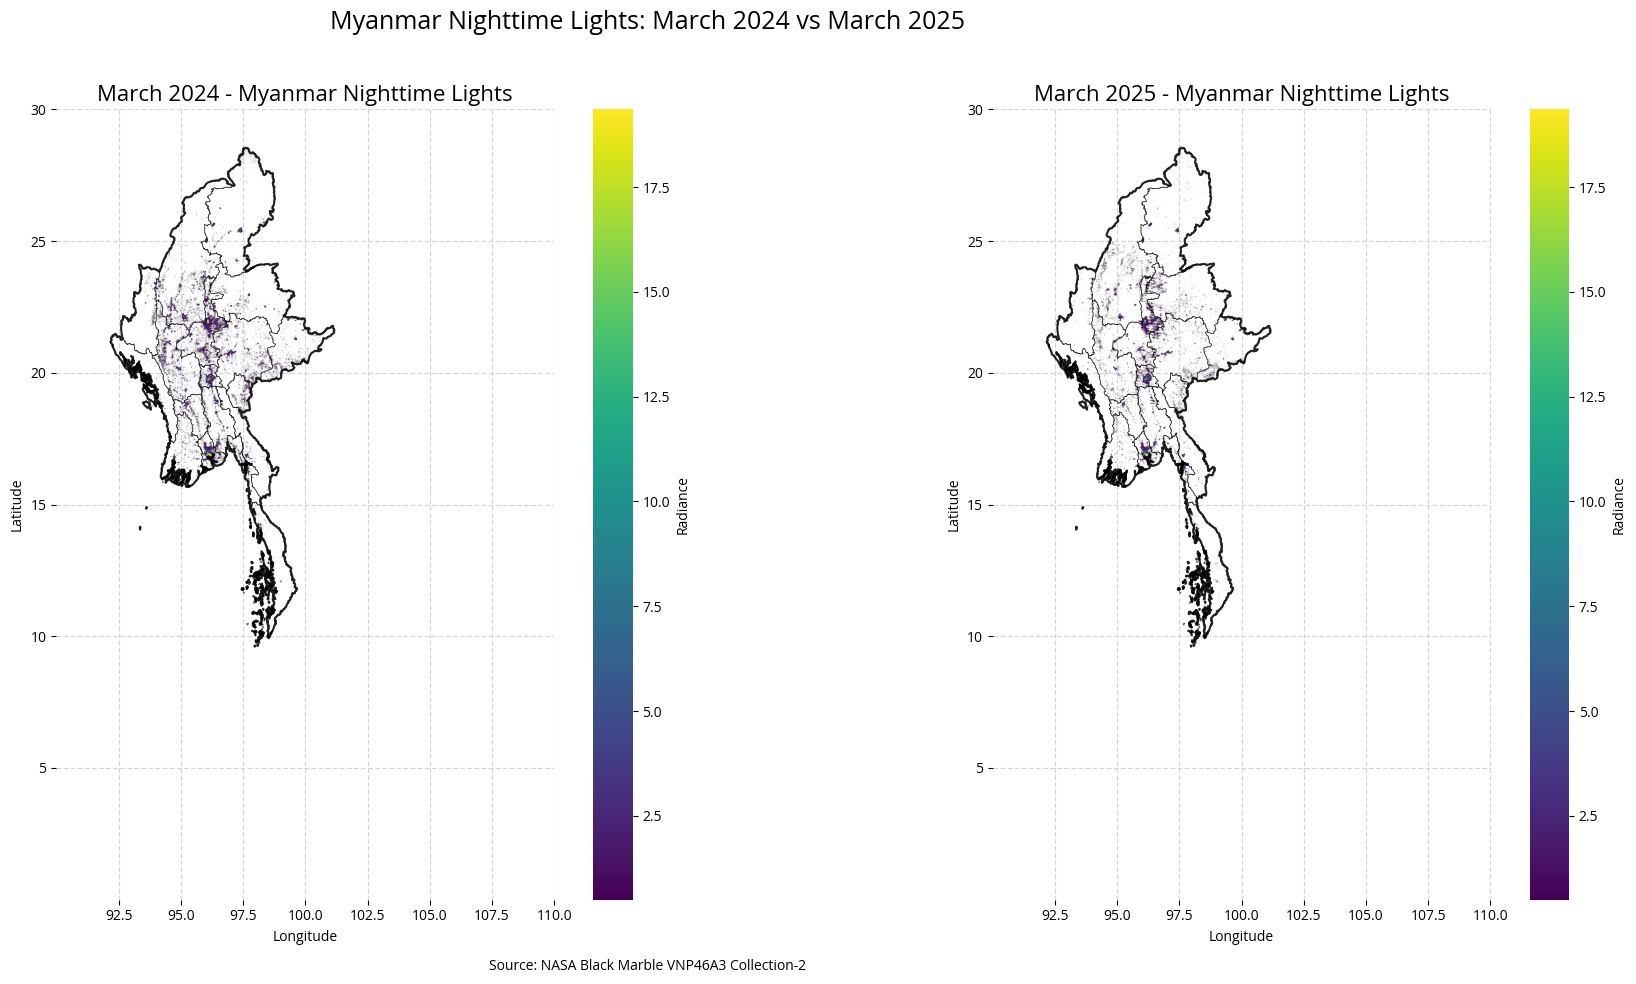
Comparison of March 2024 vs March 2025 Nighttime Lights#
Using common scale: vmin=0.50, vmax=19.35
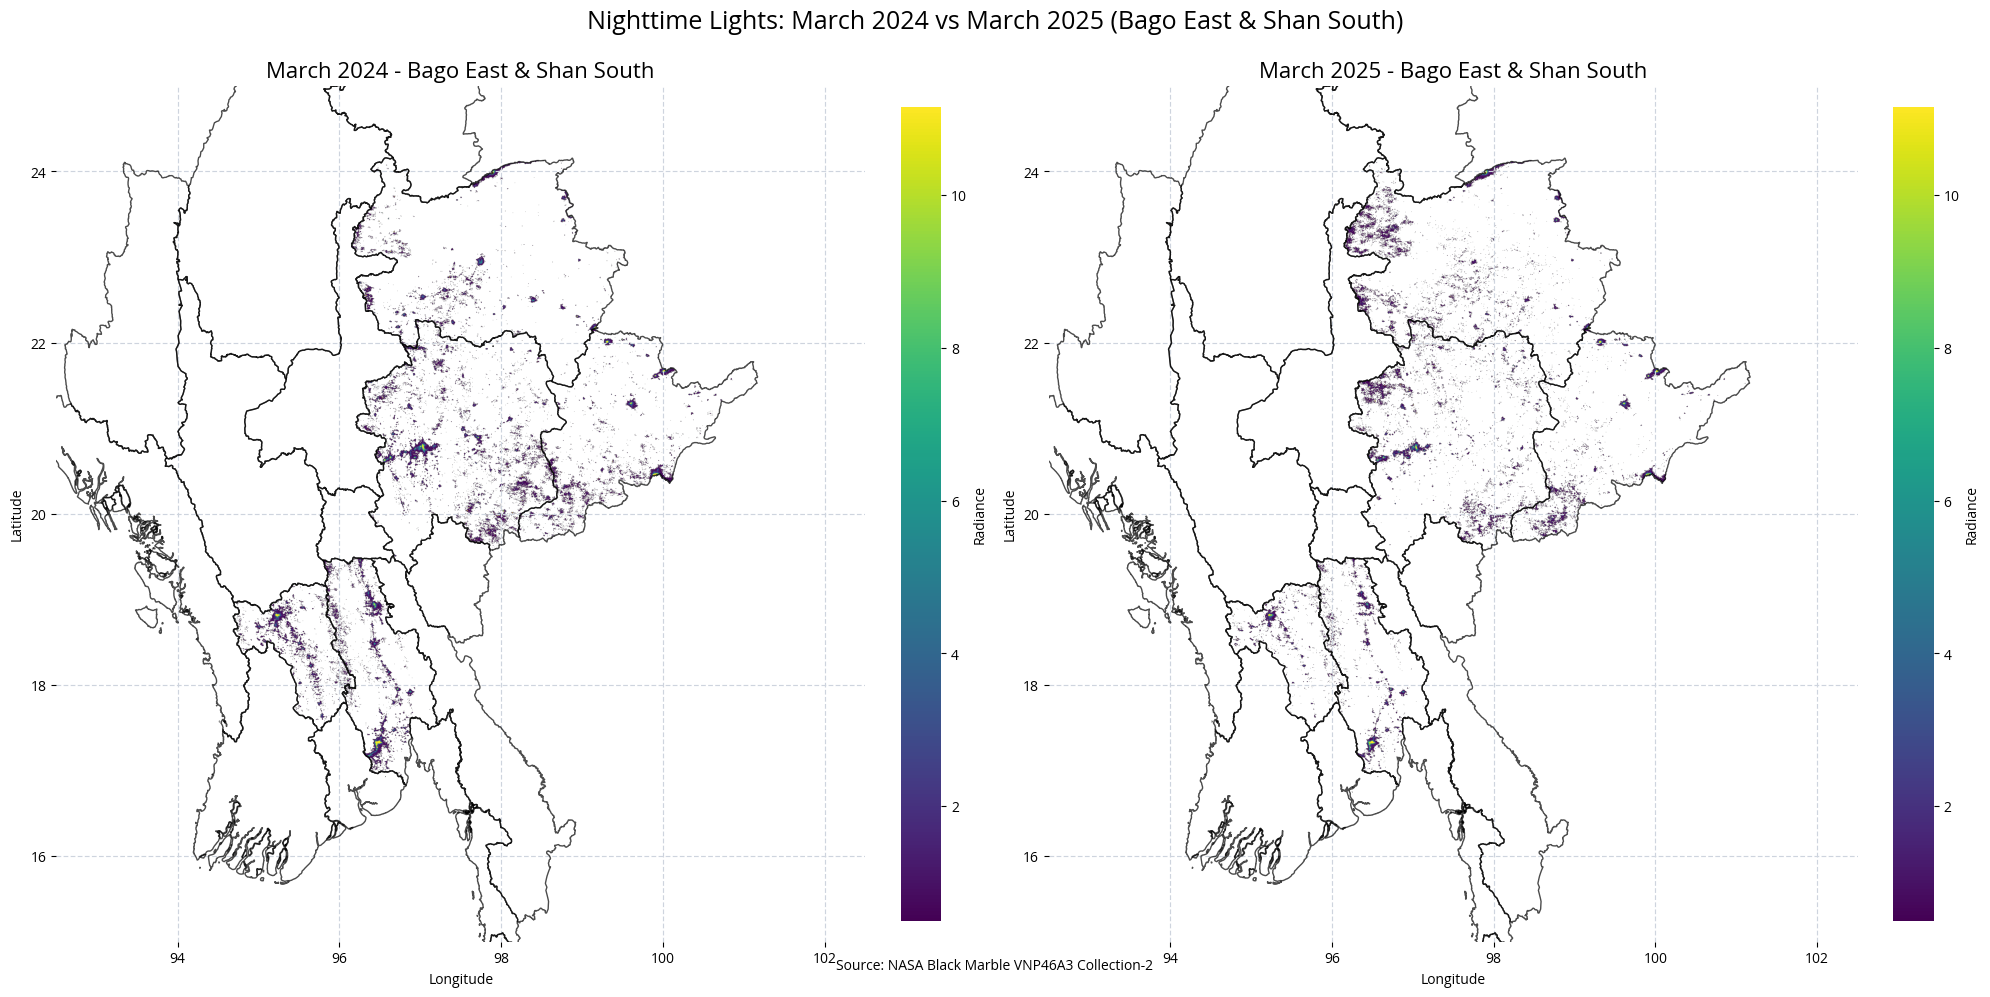
--- Statistics ---
March 2024: Mean=1.31, Max=307.09
March 2025: Mean=1.17, Max=179.61
Change: -10.63%
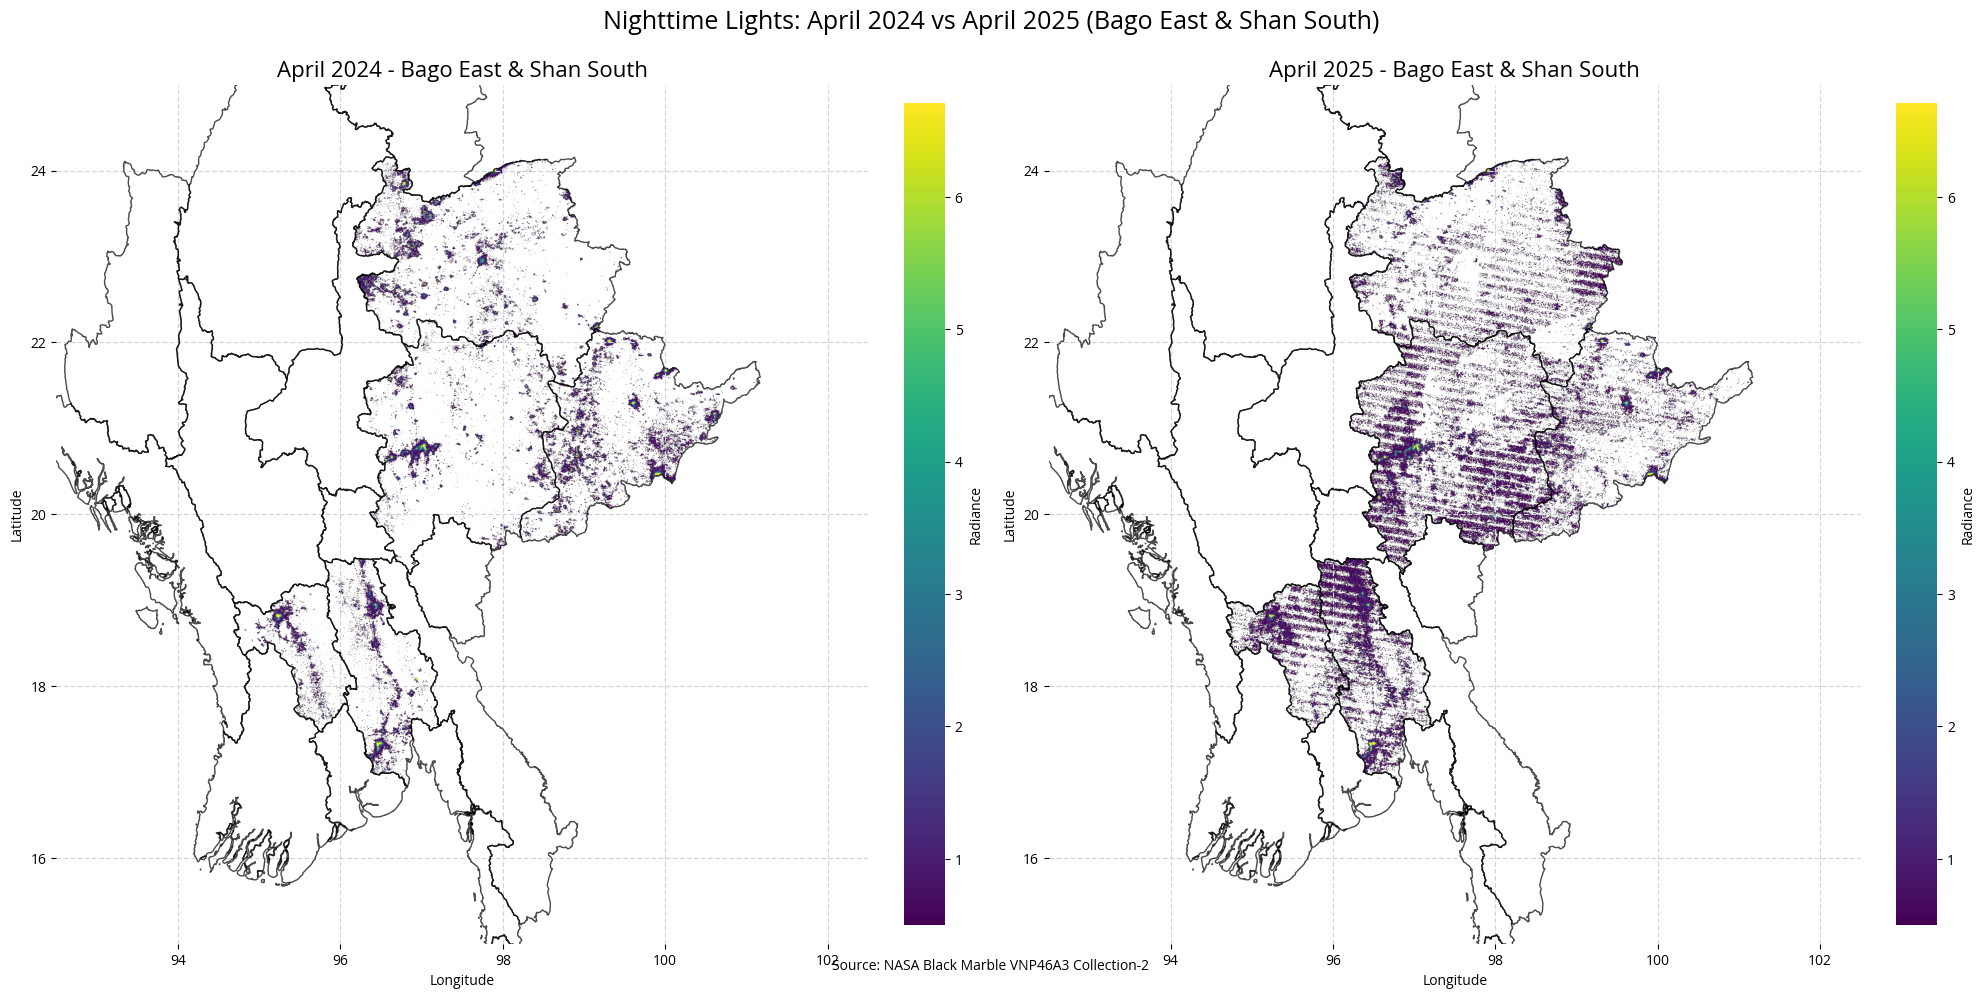
--- Statistics ---
April 2024: Mean=1.31, Max=450.42
April 2025: Mean=0.78, Max=295.77
Change: -40.77%

--- April Statistics (Bago East & Shan South) ---
April 2024: Mean=1.31, Max=450.42
April 2025: Mean=0.78, Max=295.77
Change: -40.77%
Change: -40.77%
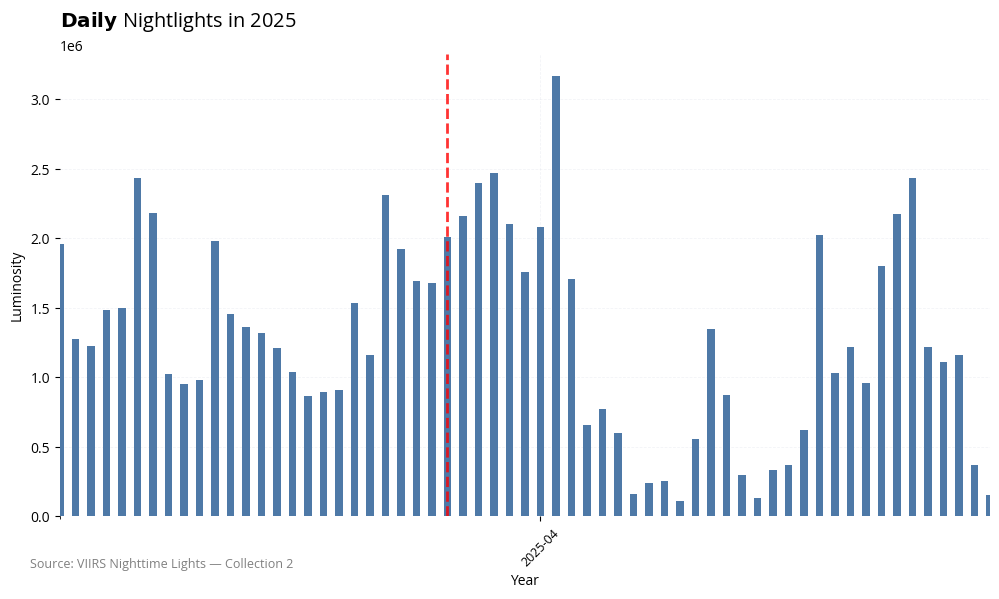
(<Figure size 1200x600 with 1 Axes>,
 <Axes: title={'center': '$\\mathbf{Daily}$ Nightlights in 2025'}, xlabel='Year', ylabel='Luminosity'>)