Greenhouse Gas Emissions Estimation#
This section attempts to estimate greenhouse gas emissions from maritime shipping. The objective is to document the percentage increase in CO2 emissions as a result of the Red Sea Crisis. Ships have embarked on longer routes across the Cape of Good Hope in order to avoid the Red Sea, resulting in longer distance traveled and increased fuel consumption (also from ships traveling at a higher speed*).
Given our team’s access to detailed ship location data (Automatic Identification System, hereafter AIS) from the UN Global Platform, we propose a simple but replicable methodology to extract AIS messages from port visits and critical crossing areas (also referred to as “chokepoints”), approximate travel routes using historical routes data, and estimate CO2 emissions from distance traveled using average emissions factors from previous research.
Methodology#
1. Data Extraction#
The AIS dataset is too large to query all movements for every vessel. In order to solve this issue, we extract AIS data only for key crossing chokepoints (Bab el-Mandeb Strait, Cape of Good Hope, Suez Canal) and all ports around the world. We rely on a global dataset of port boundaries referenced in previous research by the International Monetary Fund (Cerdeiro et al. [CKomaromiLS20]; Verschuur et al. [VKH21b]; Verschuur et al. [VKH21a]). For the chokepoint areas, we digitized them manually.
We retrieve all AIS data points within these areas between January 1st 2023 up to March 31st 2024. For reference, one month of raw AIS data filtered for these area results in about 25 million data rows.
The next step is to aggregate these AIS data points into port calls, or port visits, by grouping consecutive messages per unique vessel within each port boundary or chokepoint area. We implement this with a function developed by Cherryl Chico for the Asian Development Bank Bank [Ban23], distributed through the UN Task Team. We also aggregated key attributes per route (vessel type, port location, time in port, arrival and departure time). This results in a dataset of 12,757,788 port calls. Many of these are small movements or intra-country travel which are filtered out in step 3.
2. Sea Routes#
Since we don’t have the exact route trajectory for all vessels, our strategy is to match the origin-destination trajectories we extracted with a dataset of historical routes. We processed sea routes derived from AIS data by Mariquant (2019).
Their output data was released under a creative commons license for public use. Their method to create sea routes relies on AIS data from 2016 to 2018. In summary, they use a Random Forest Classifier to remove the noise in AIS data (signals where ships are anchoring and loitering around port harbors). Then, they clusterize trajectories based on their distances and select the “best” trajectory using the Edit Distance with real Penalty (ERP) algorithm.
We applied some additional filters to the routes to ensure they can be properly mapped and were realistic (not crossing land). The final resulting routes can be seen in the figure below.
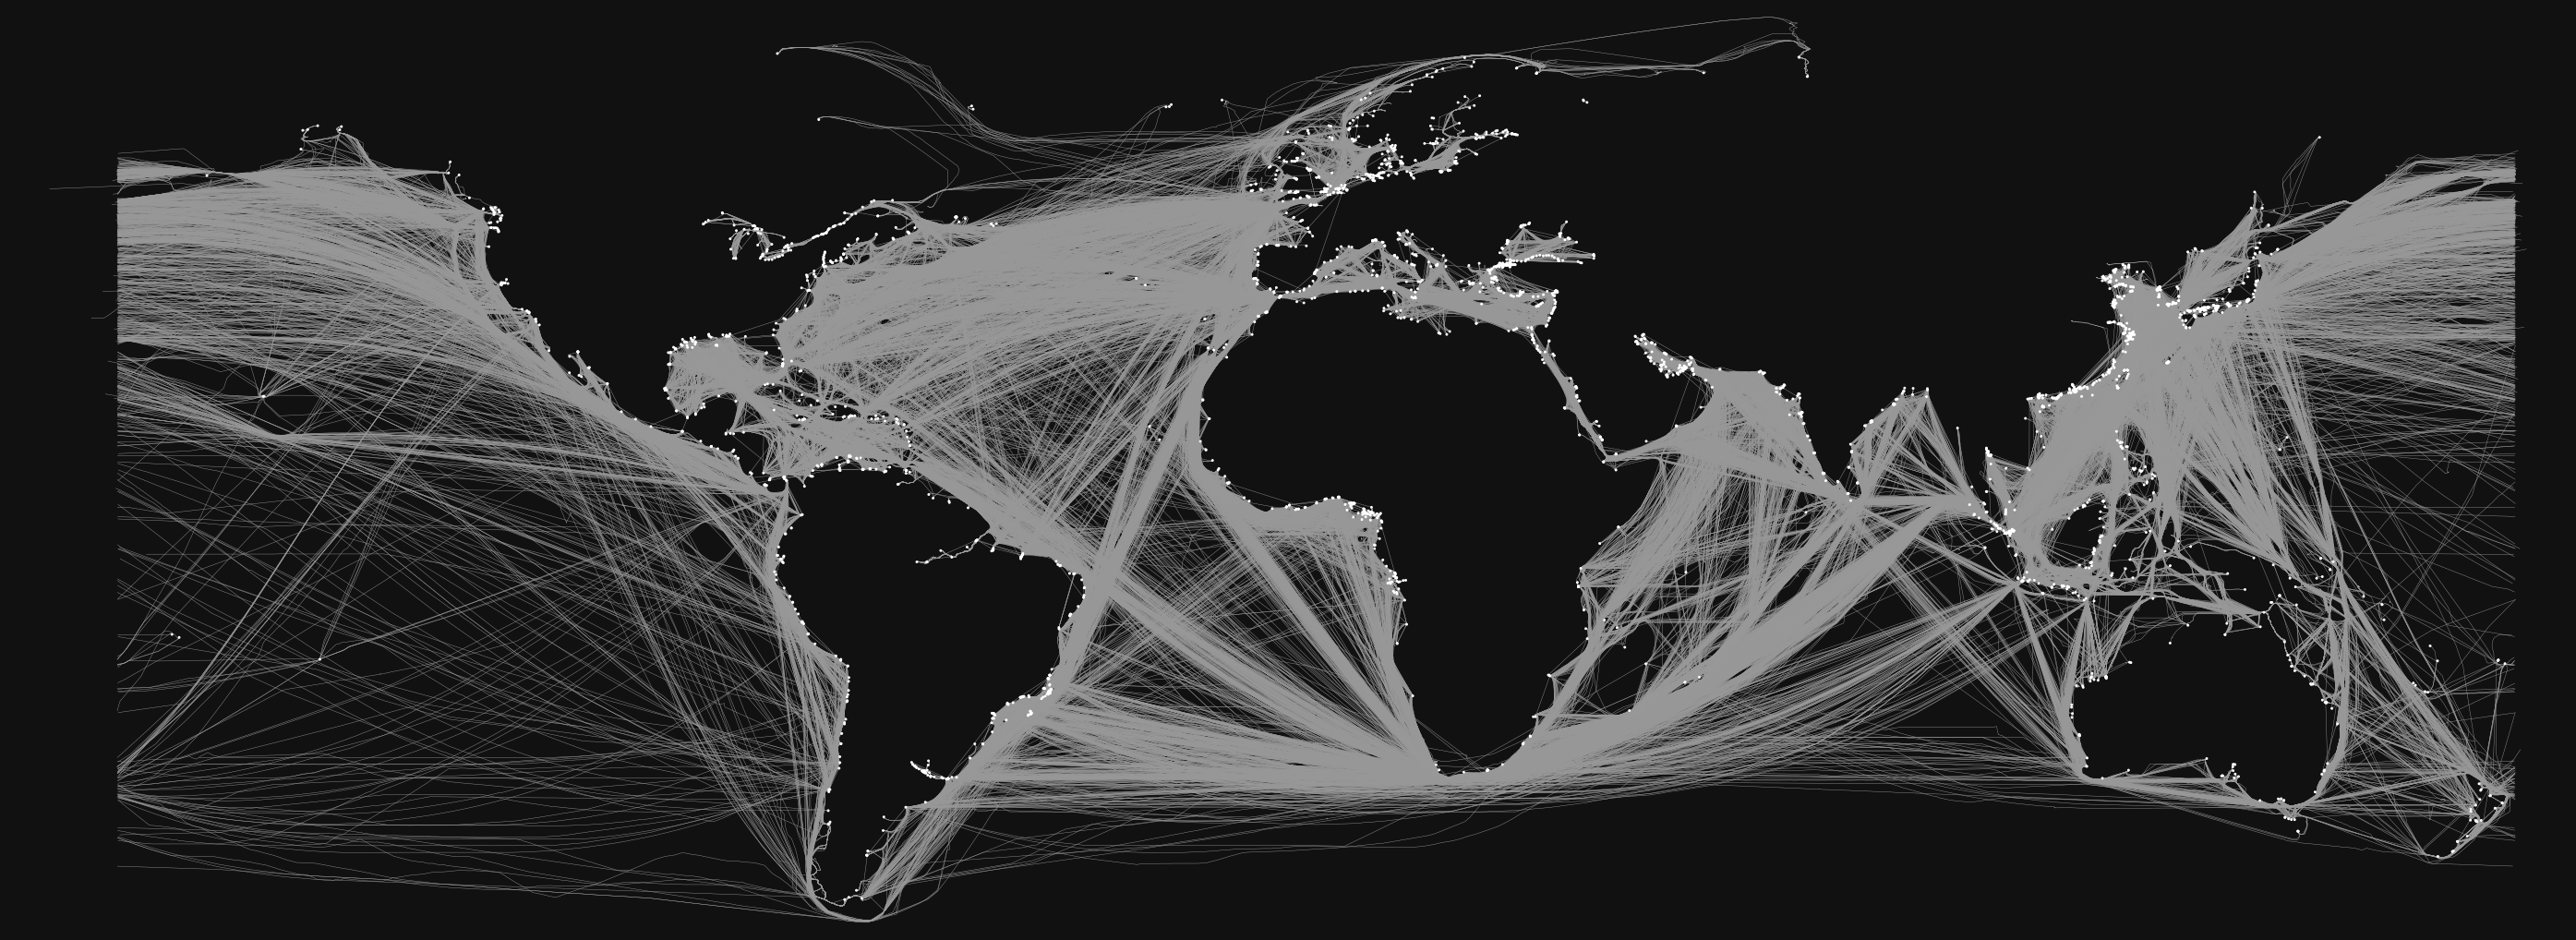
Fig. 10 Network of processed sea routes and ports#
3. Convert Port Calls to Trips#
We conduct multiple data cleaning and processing steps to identify international ship journeys from the AIS port calls data created in step 1.
Calculate Travel Time#
For each vessel port call, we identify the previous port call departure and estimate the time between arrival and previous departure.
Remove False Positives#
We remove trips that are errors from duplicate vessel names/identifiers. The maximum journey time allowed is 30 days, and the minimum is 1 hour. We remove vessels where travel time is less than 1 hour and distance between start port and end port is greater than 1000 km (duplicate vessels). We also remove vessels where the start port and end port are in the same country. The number of trips is reduced from 12,757,788 to 1,761,090.
Merge Sea Route from Step 2#
For each trip, we locate the closest start port and end port in our routes network from step 2, and extract the closest route between those points. In cases where the route between the exact start port and end port is not available (34% of routes: 615,584 out of 1,761,090), we use the network graph to solve for the shortest path from start port to end port. Below our two visual examples of each case of route matching.
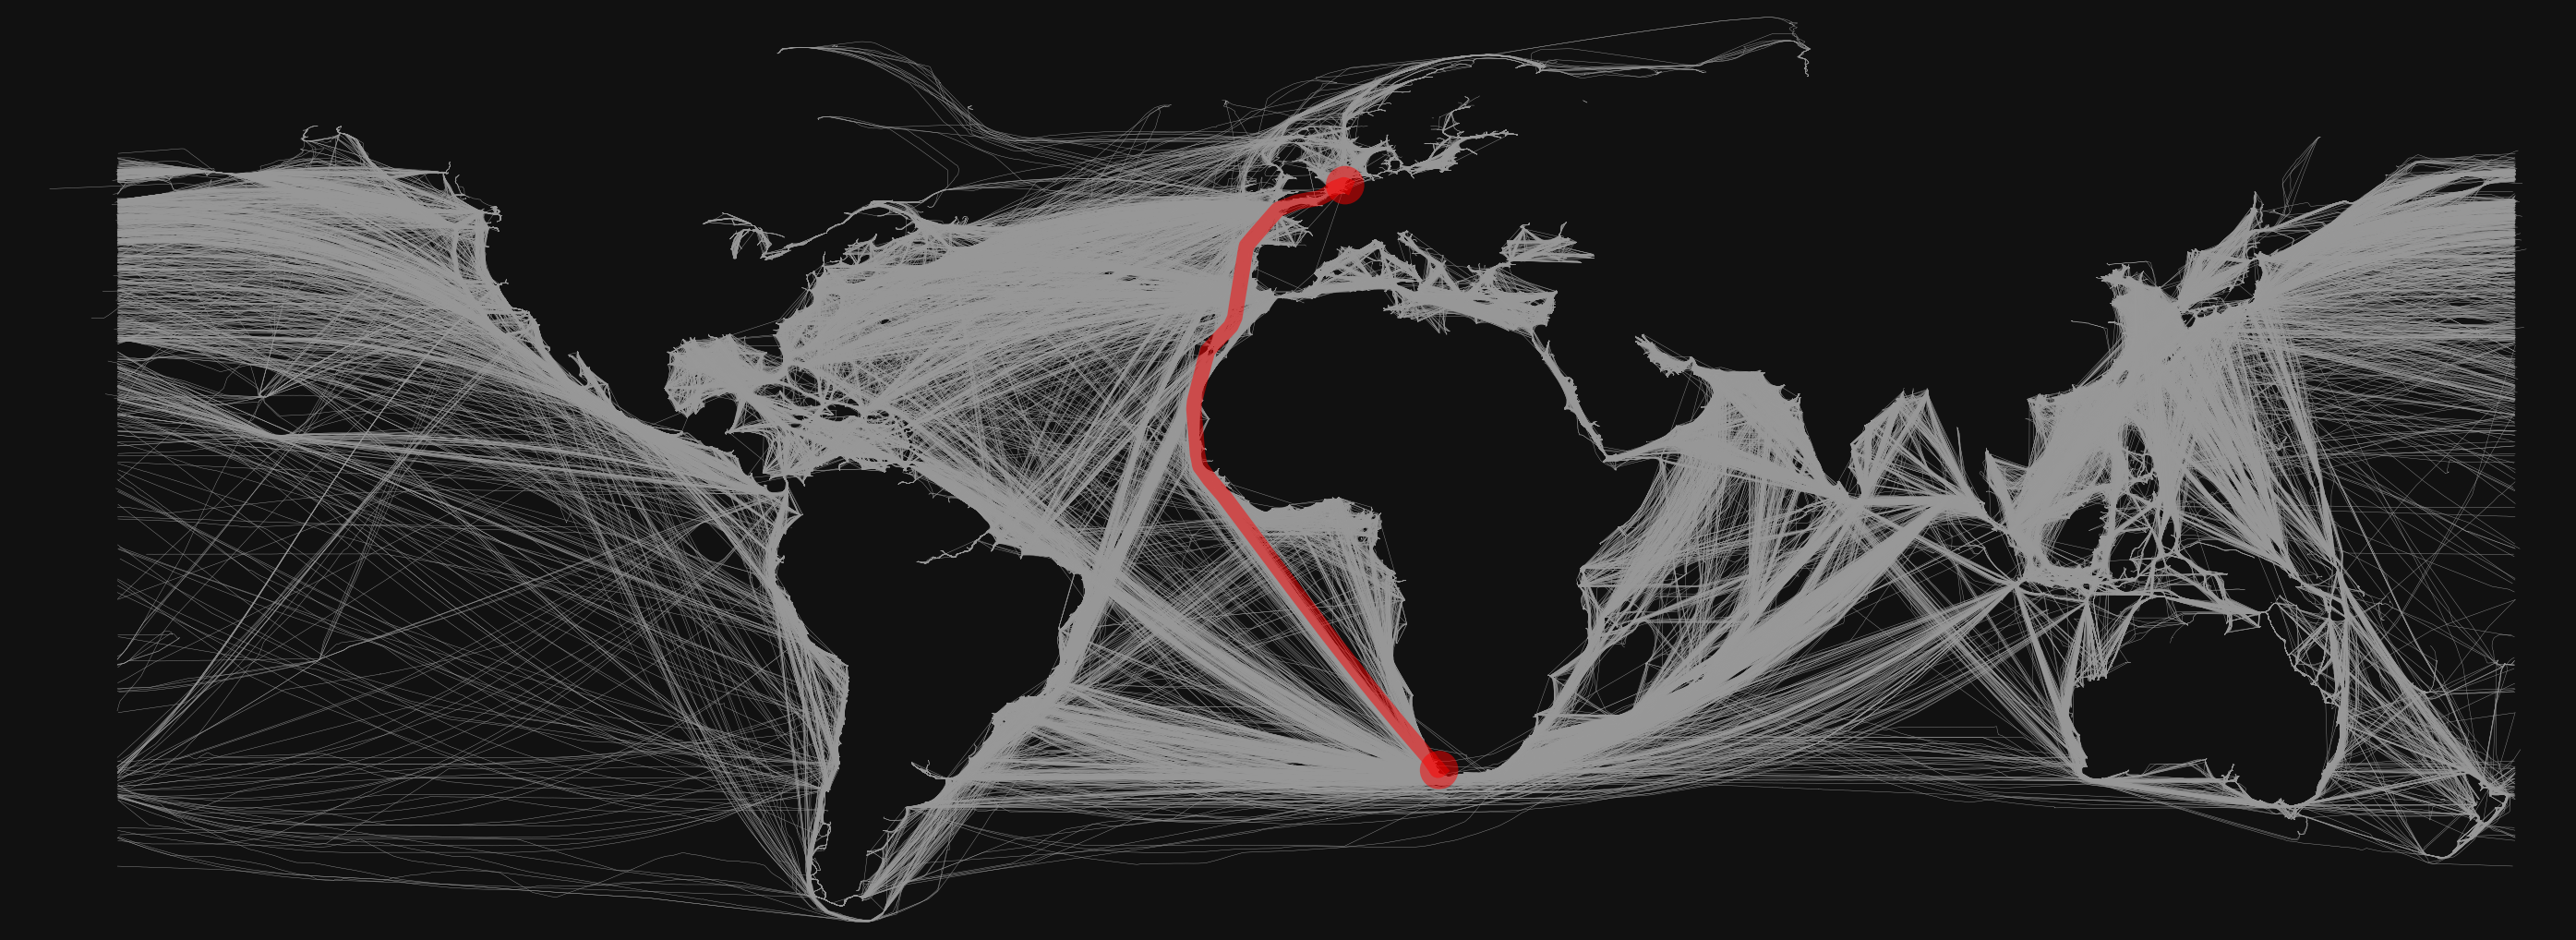
Fig. 11 Case A: Direct Route Between Ijmuiden, Netherlands and Cape of Good Hope#
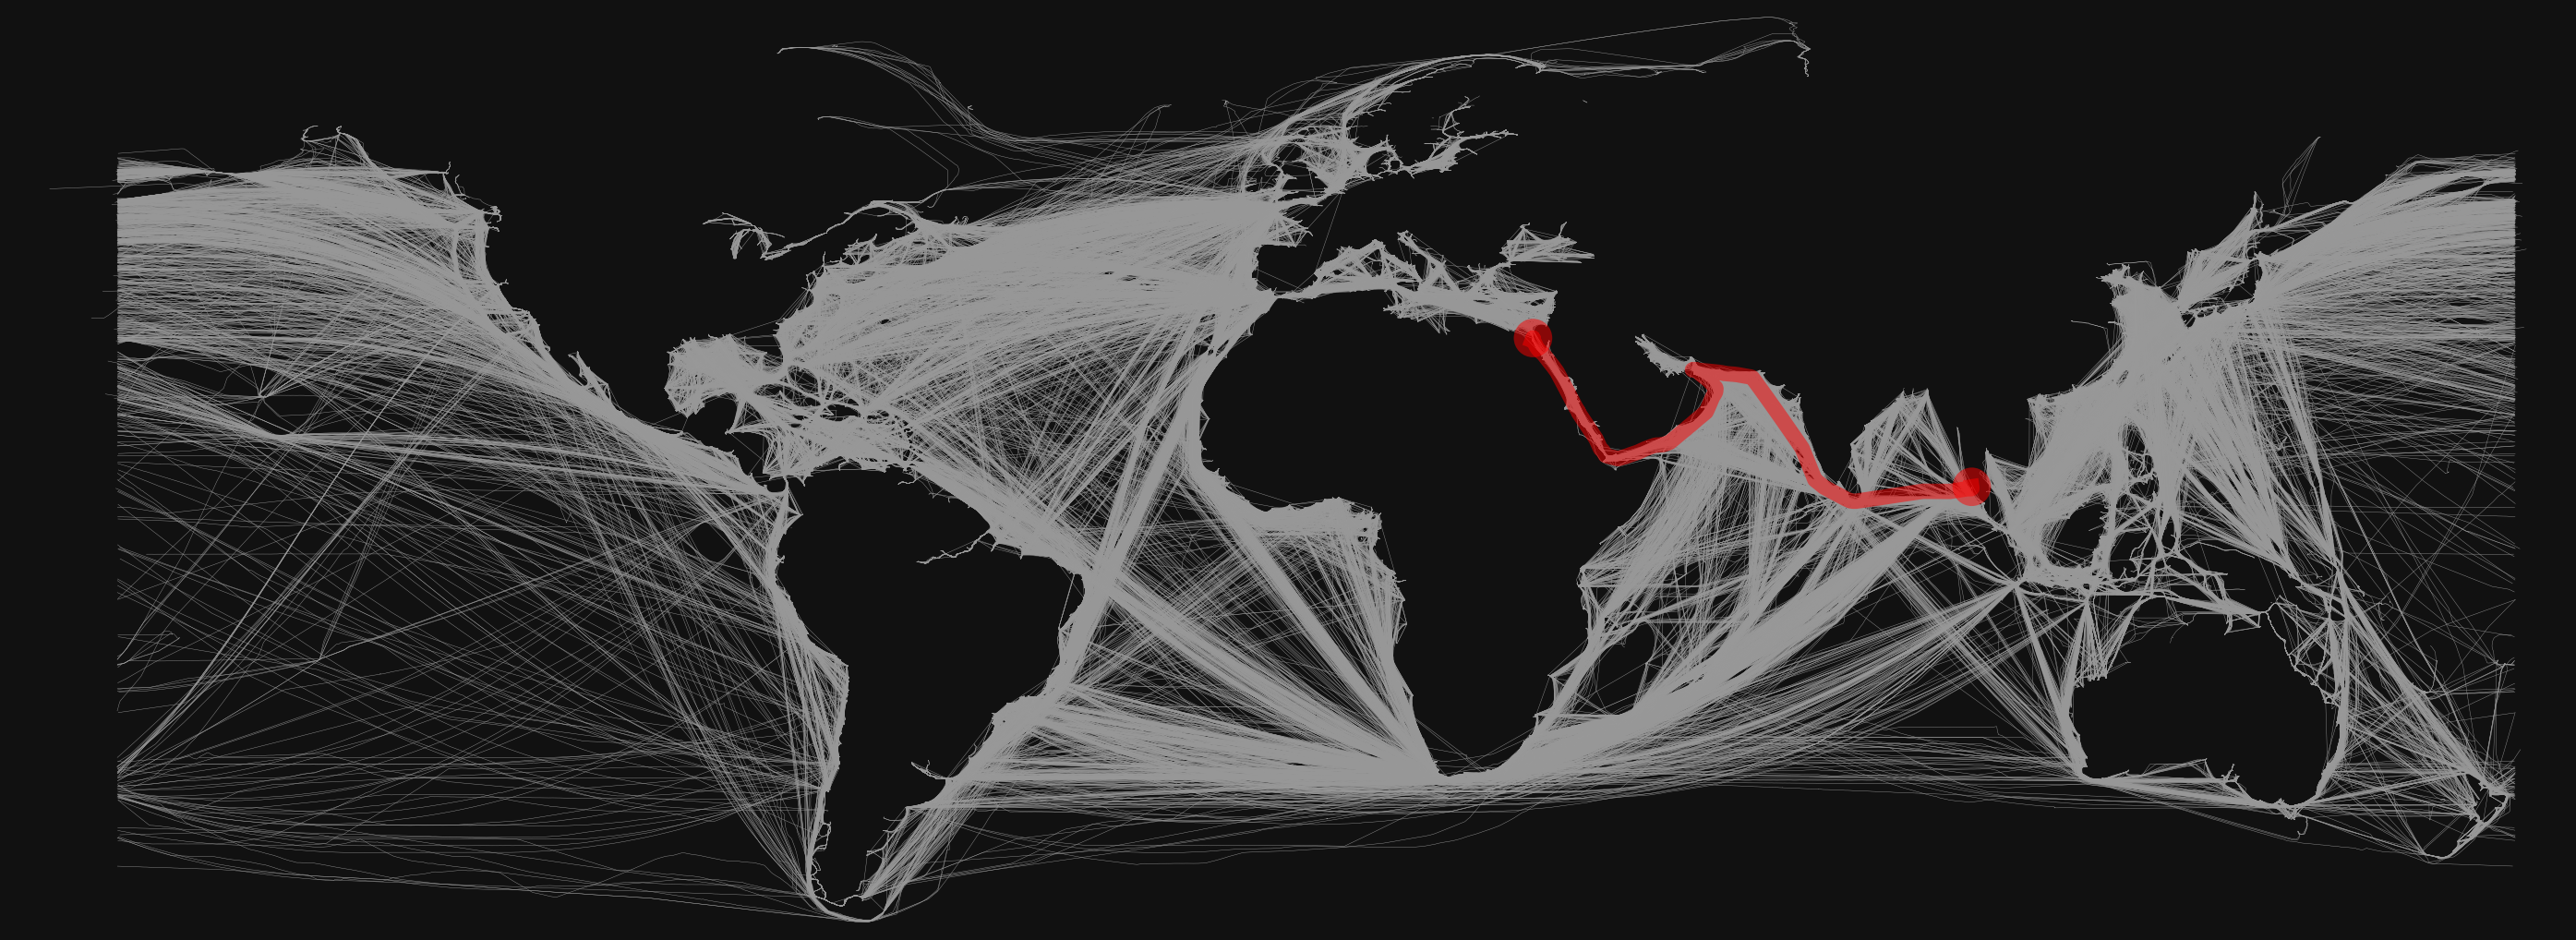
Fig. 12 Case A: Shortest Route Calculated Between Phuket, Thailand and Suez Canal#
4. Aggregation and Percent Change Calculation#
From our final dataset of 1,761,090 trips, we further select vessels who have crossed the Red Sea during a reference period (January 2023 through October 2023), and have crossed any of our chokepoints of interest (Red Sea or Cape of Good Hope). Critically, this represents only 15% of the 11,761,090 trips detected, and 12% of unique vessels in our dataset.
We then aggregate the total distance traveled (sum) and number of trips by origin-destination (ports) for each month. A sample of this aggregated data is shown below. The full table is available through the following Sharepoint link.
year |
month |
Vessel Type |
Previous Port |
Previous Country |
Country |
Port |
Total travel time (hrs.) |
Total distance (n. miles) |
No. of Vessels |
|
|---|---|---|---|---|---|---|---|---|---|---|
0 |
2023 |
2 |
Cargo |
Cape of Good Hope |
Chokepoint Cape of Good Hope |
Angola |
Luanda |
338.479 |
4844.86 |
3 |
1 |
2023 |
2 |
Cargo |
Cape of Good Hope |
Chokepoint Cape of Good Hope |
Argentina |
Campana |
1284.54 |
7704.48 |
2 |
2 |
2023 |
2 |
Cargo |
Cape of Good Hope |
Chokepoint Cape of Good Hope |
Argentina |
Puerto Ingeniero White |
435.671 |
4088.88 |
1 |
3 |
2023 |
2 |
Cargo |
Cape of Good Hope |
Chokepoint Cape of Good Hope |
Argentina |
Rosario |
2431.08 |
23643.1 |
6 |
4 |
2023 |
2 |
Cargo |
Cape of Good Hope |
Chokepoint Cape of Good Hope |
Argentina |
San Nicolas |
915.36 |
7837.1 |
2 |
Results#
Distance Traveled Estimation#
In the figures below, we present monthly sums of the data to examine aggregate changes in total distance traveled, as a proxy for emissions. We observe a sharp increase in distance traveled caused by the trade diversion starting in January 2024, and most prominently in March 2024.
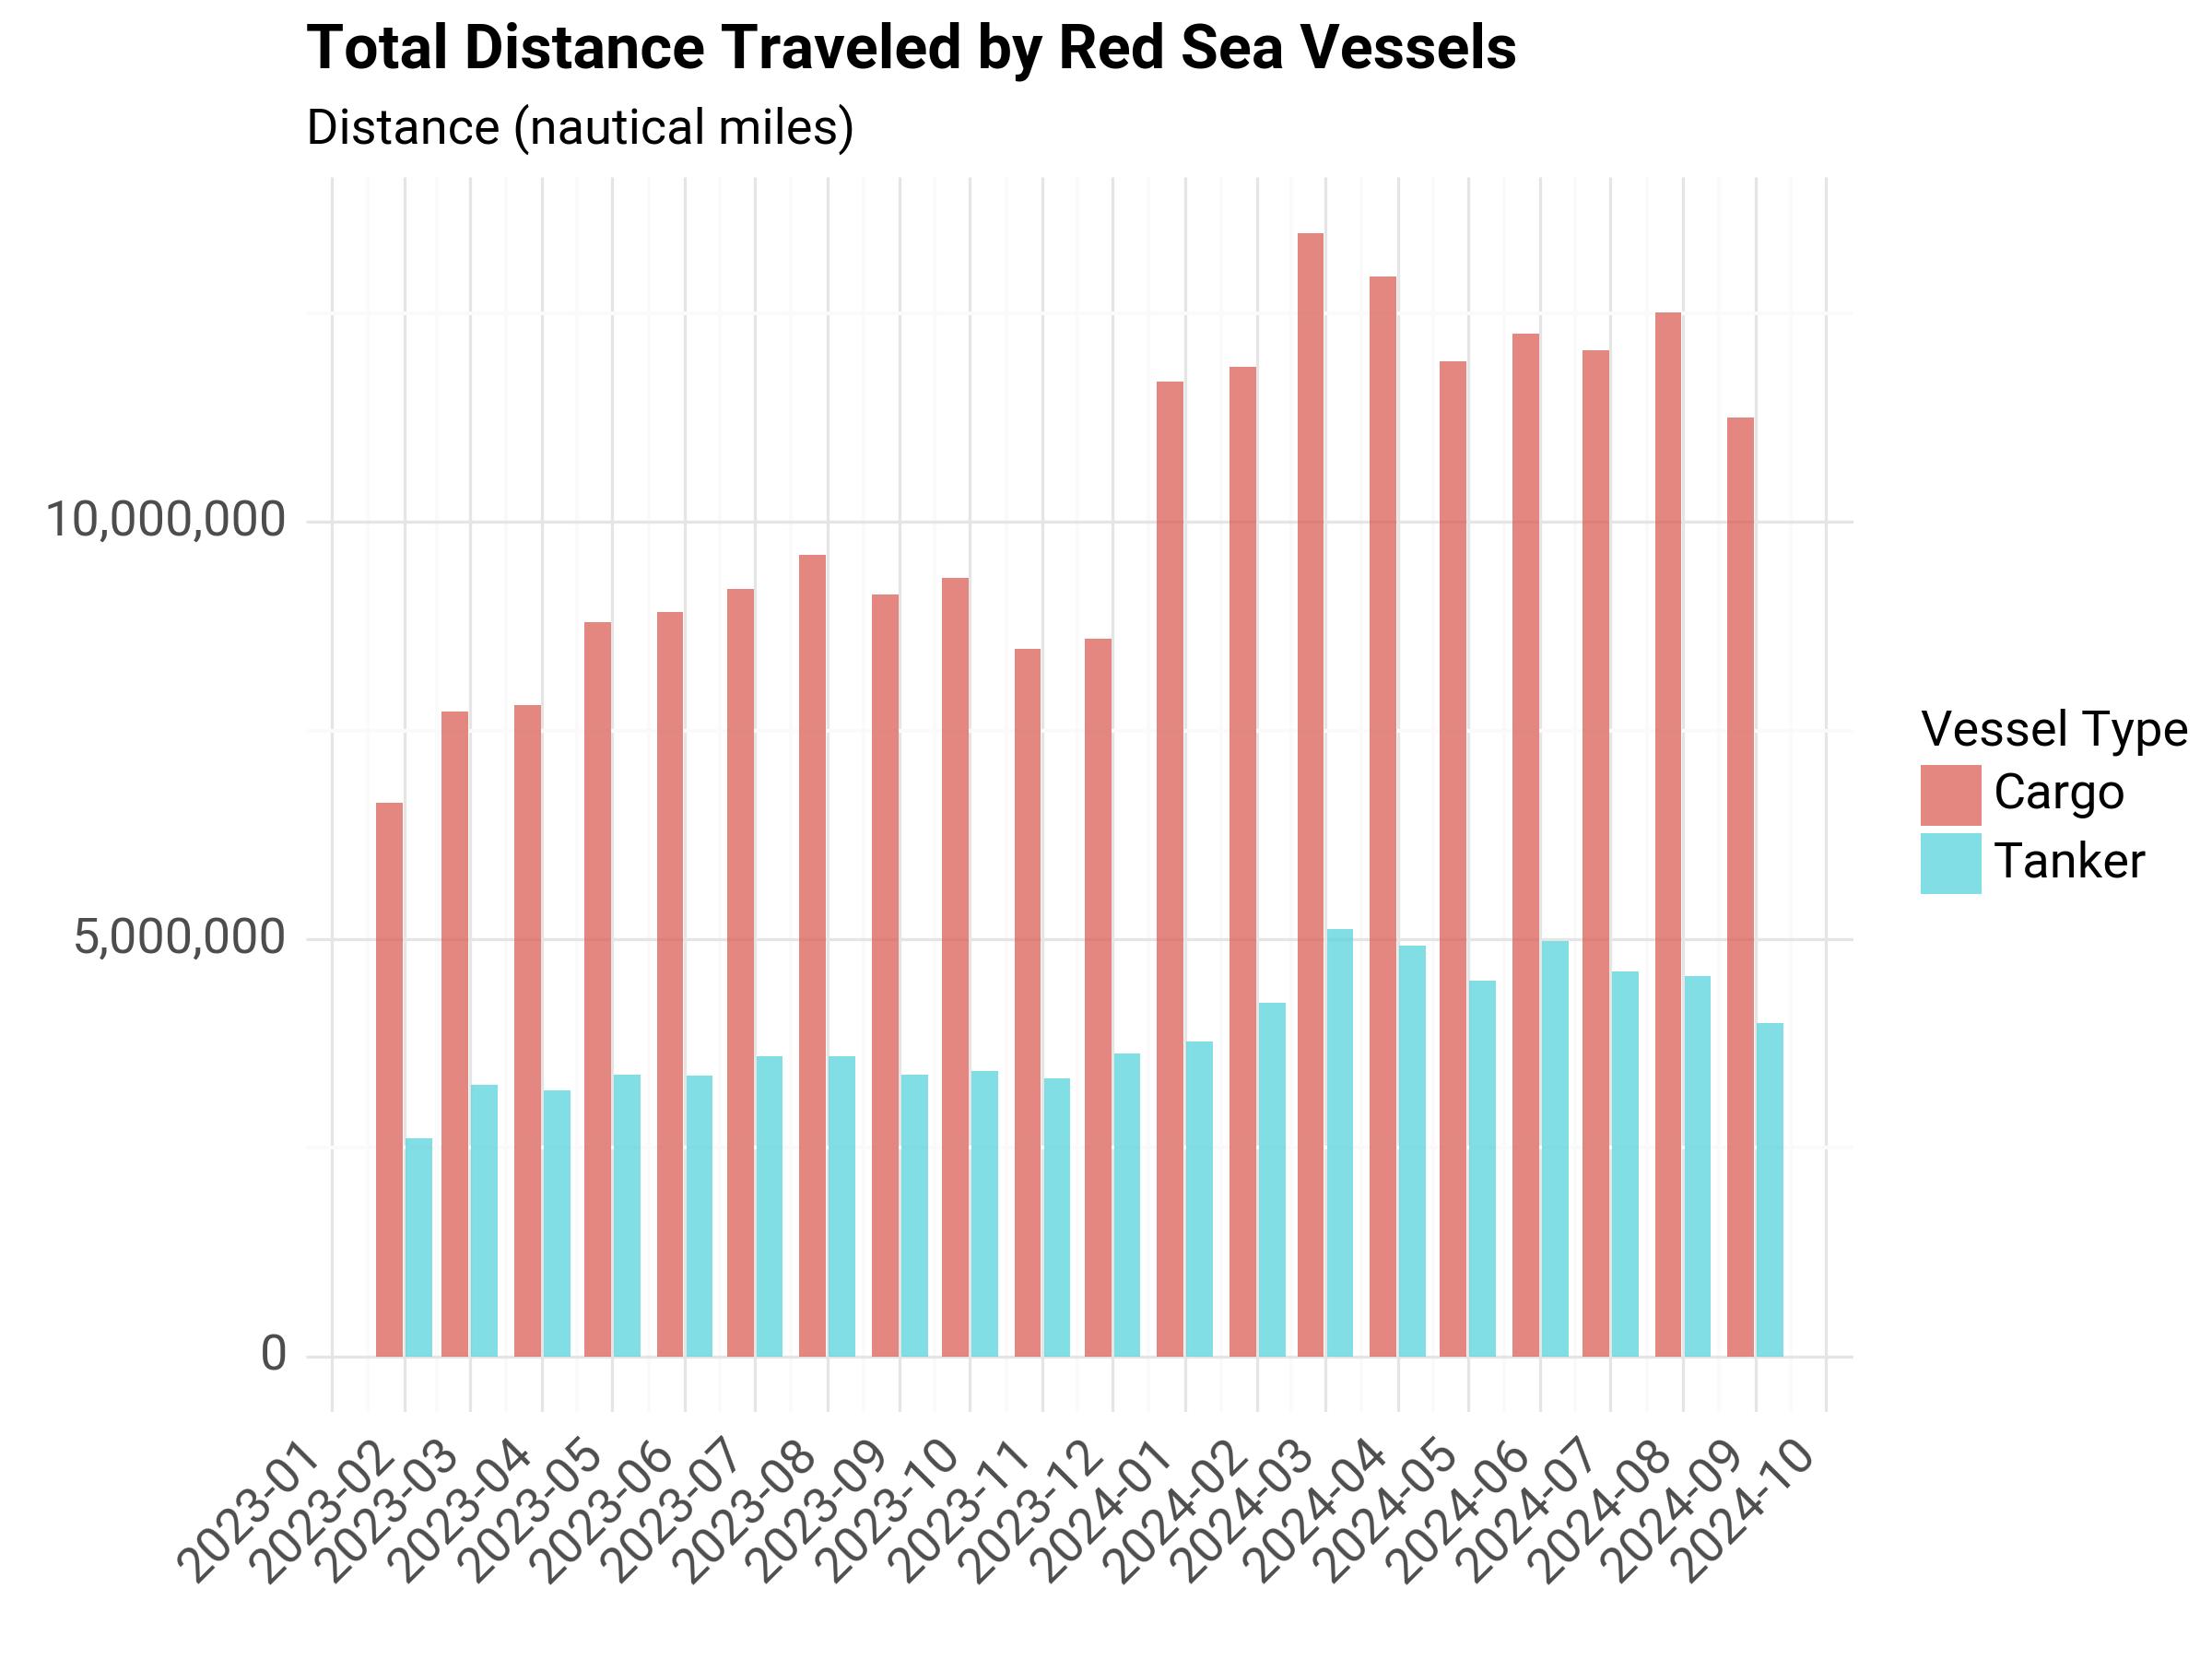
Fig. 13 Total Distance Traveled by Red Sea Vessels#
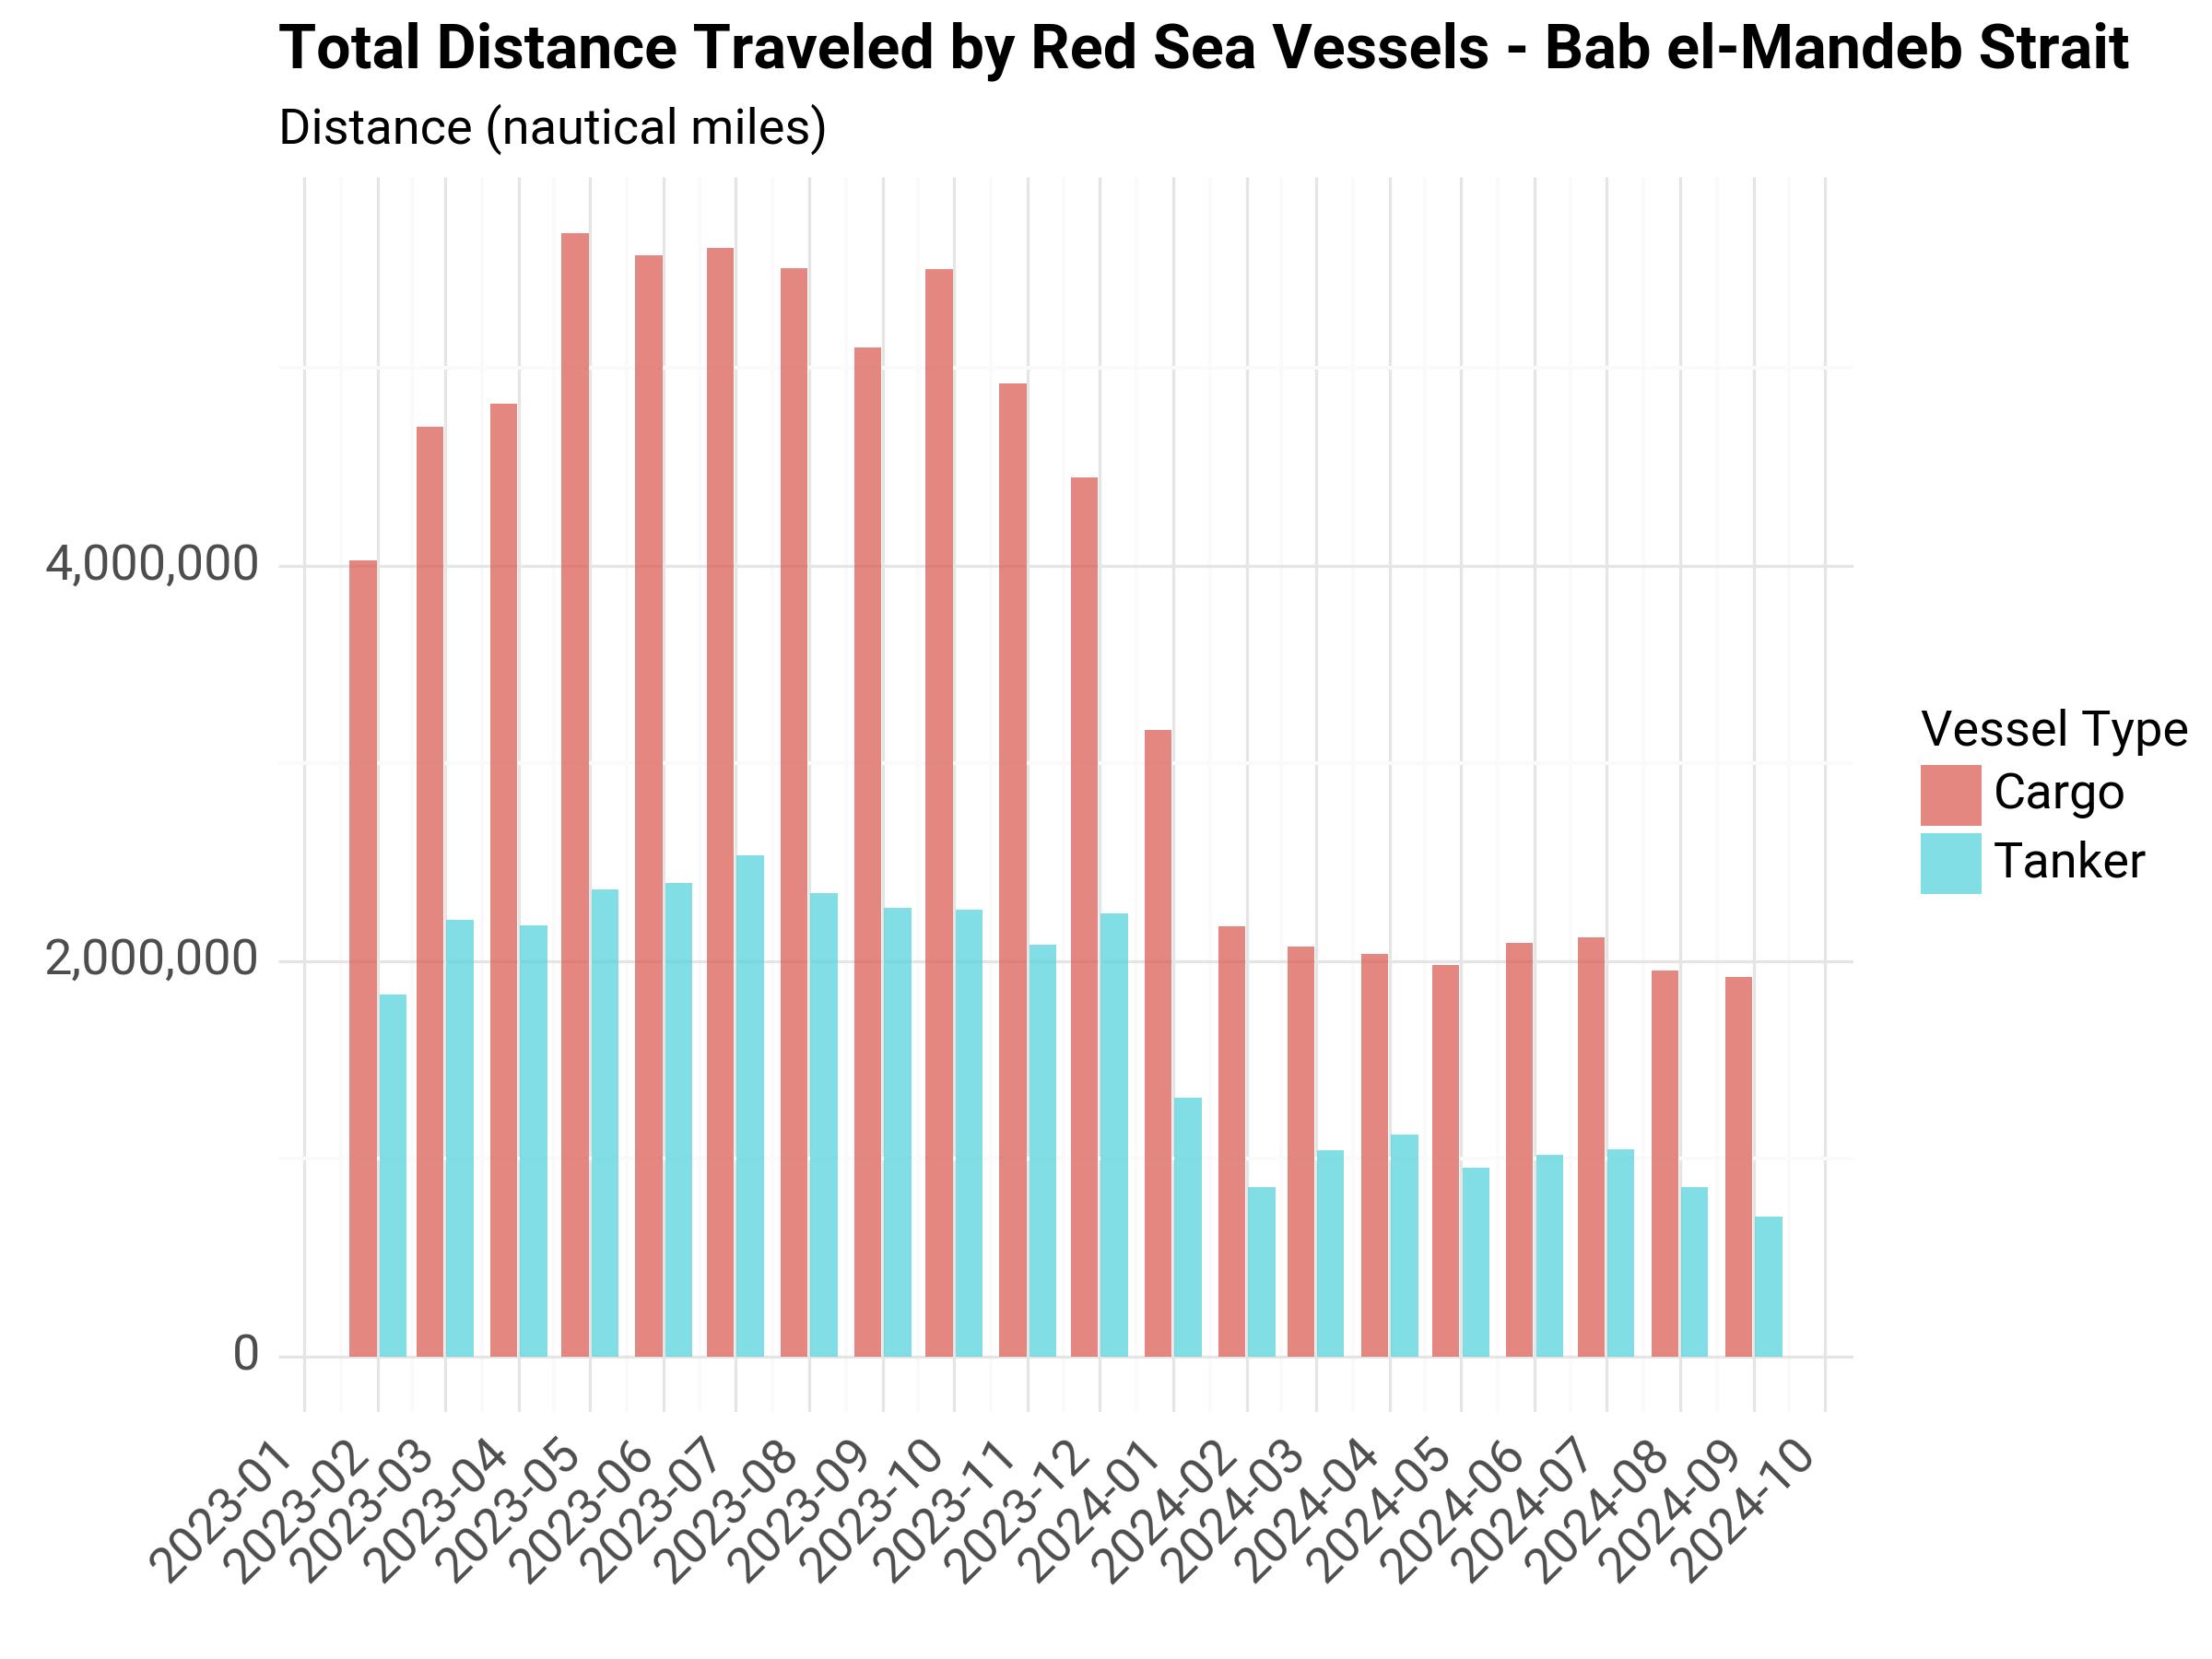
Fig. 14 Total Distance Traveled by Red Sea Vessels Crossing Bab el-Mandeb Strait#
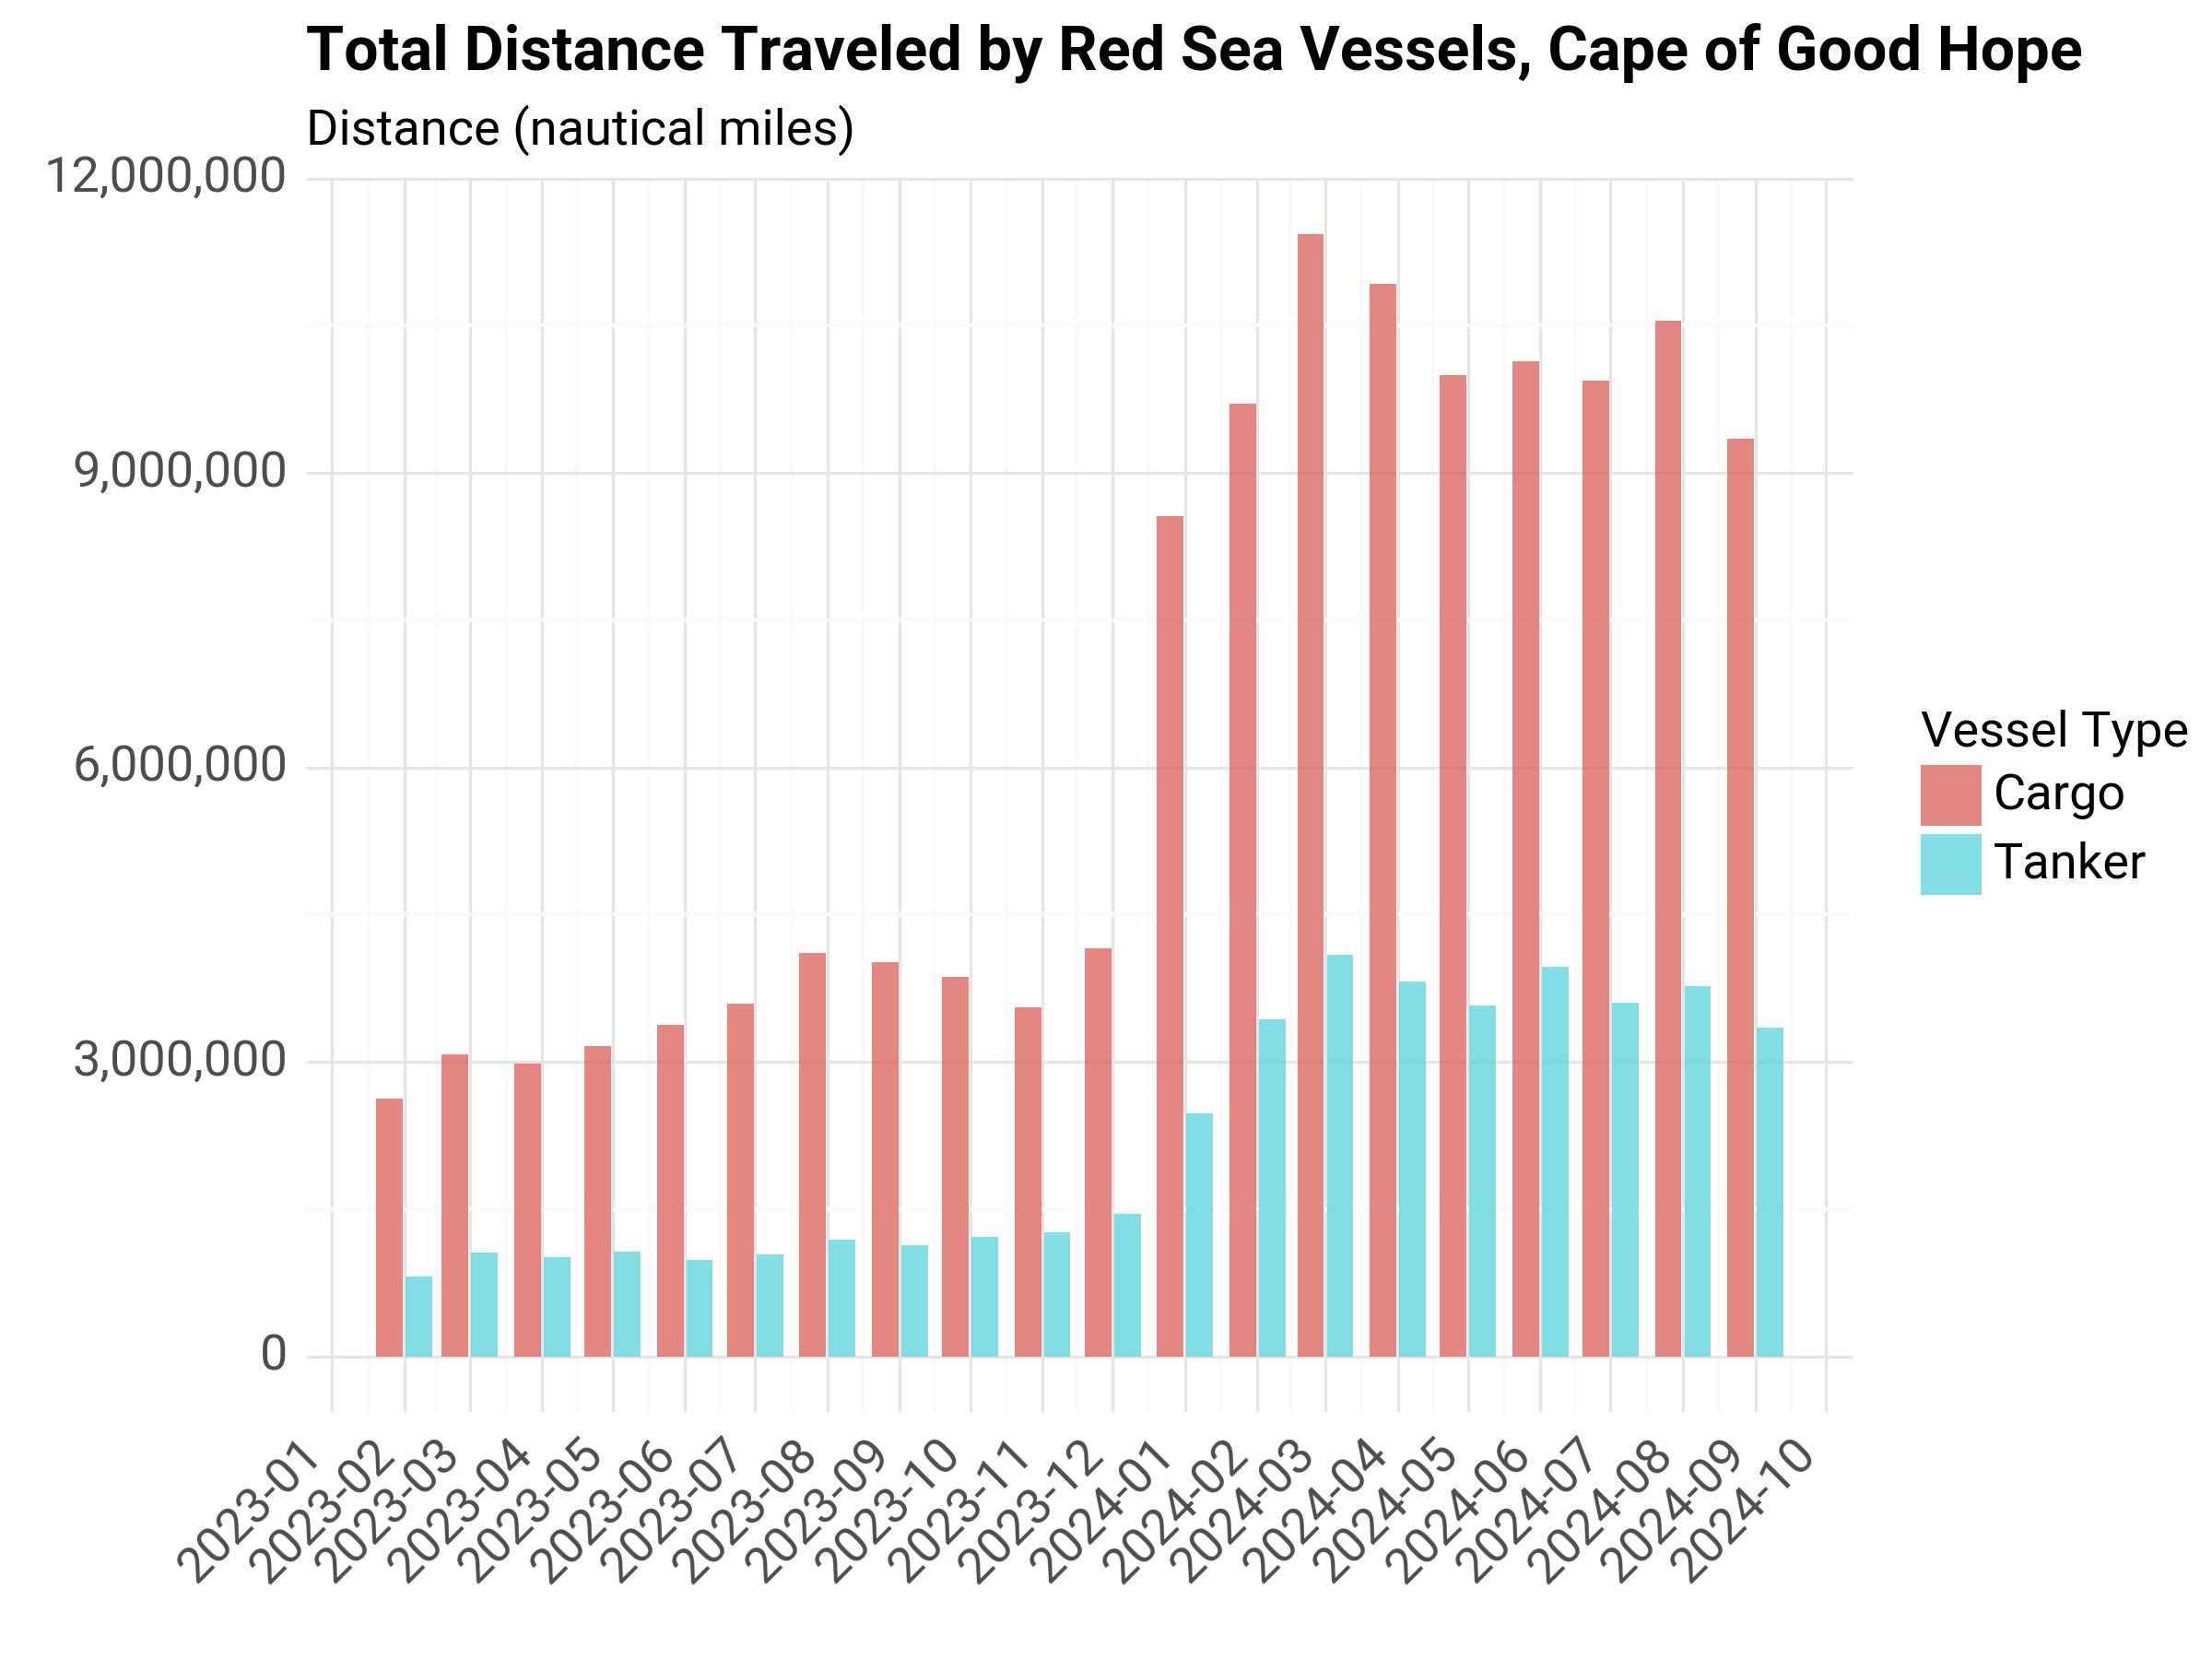
Fig. 15 Total Distance Traveled by Red Sea Vessels Crossing Cape of Good Hope#
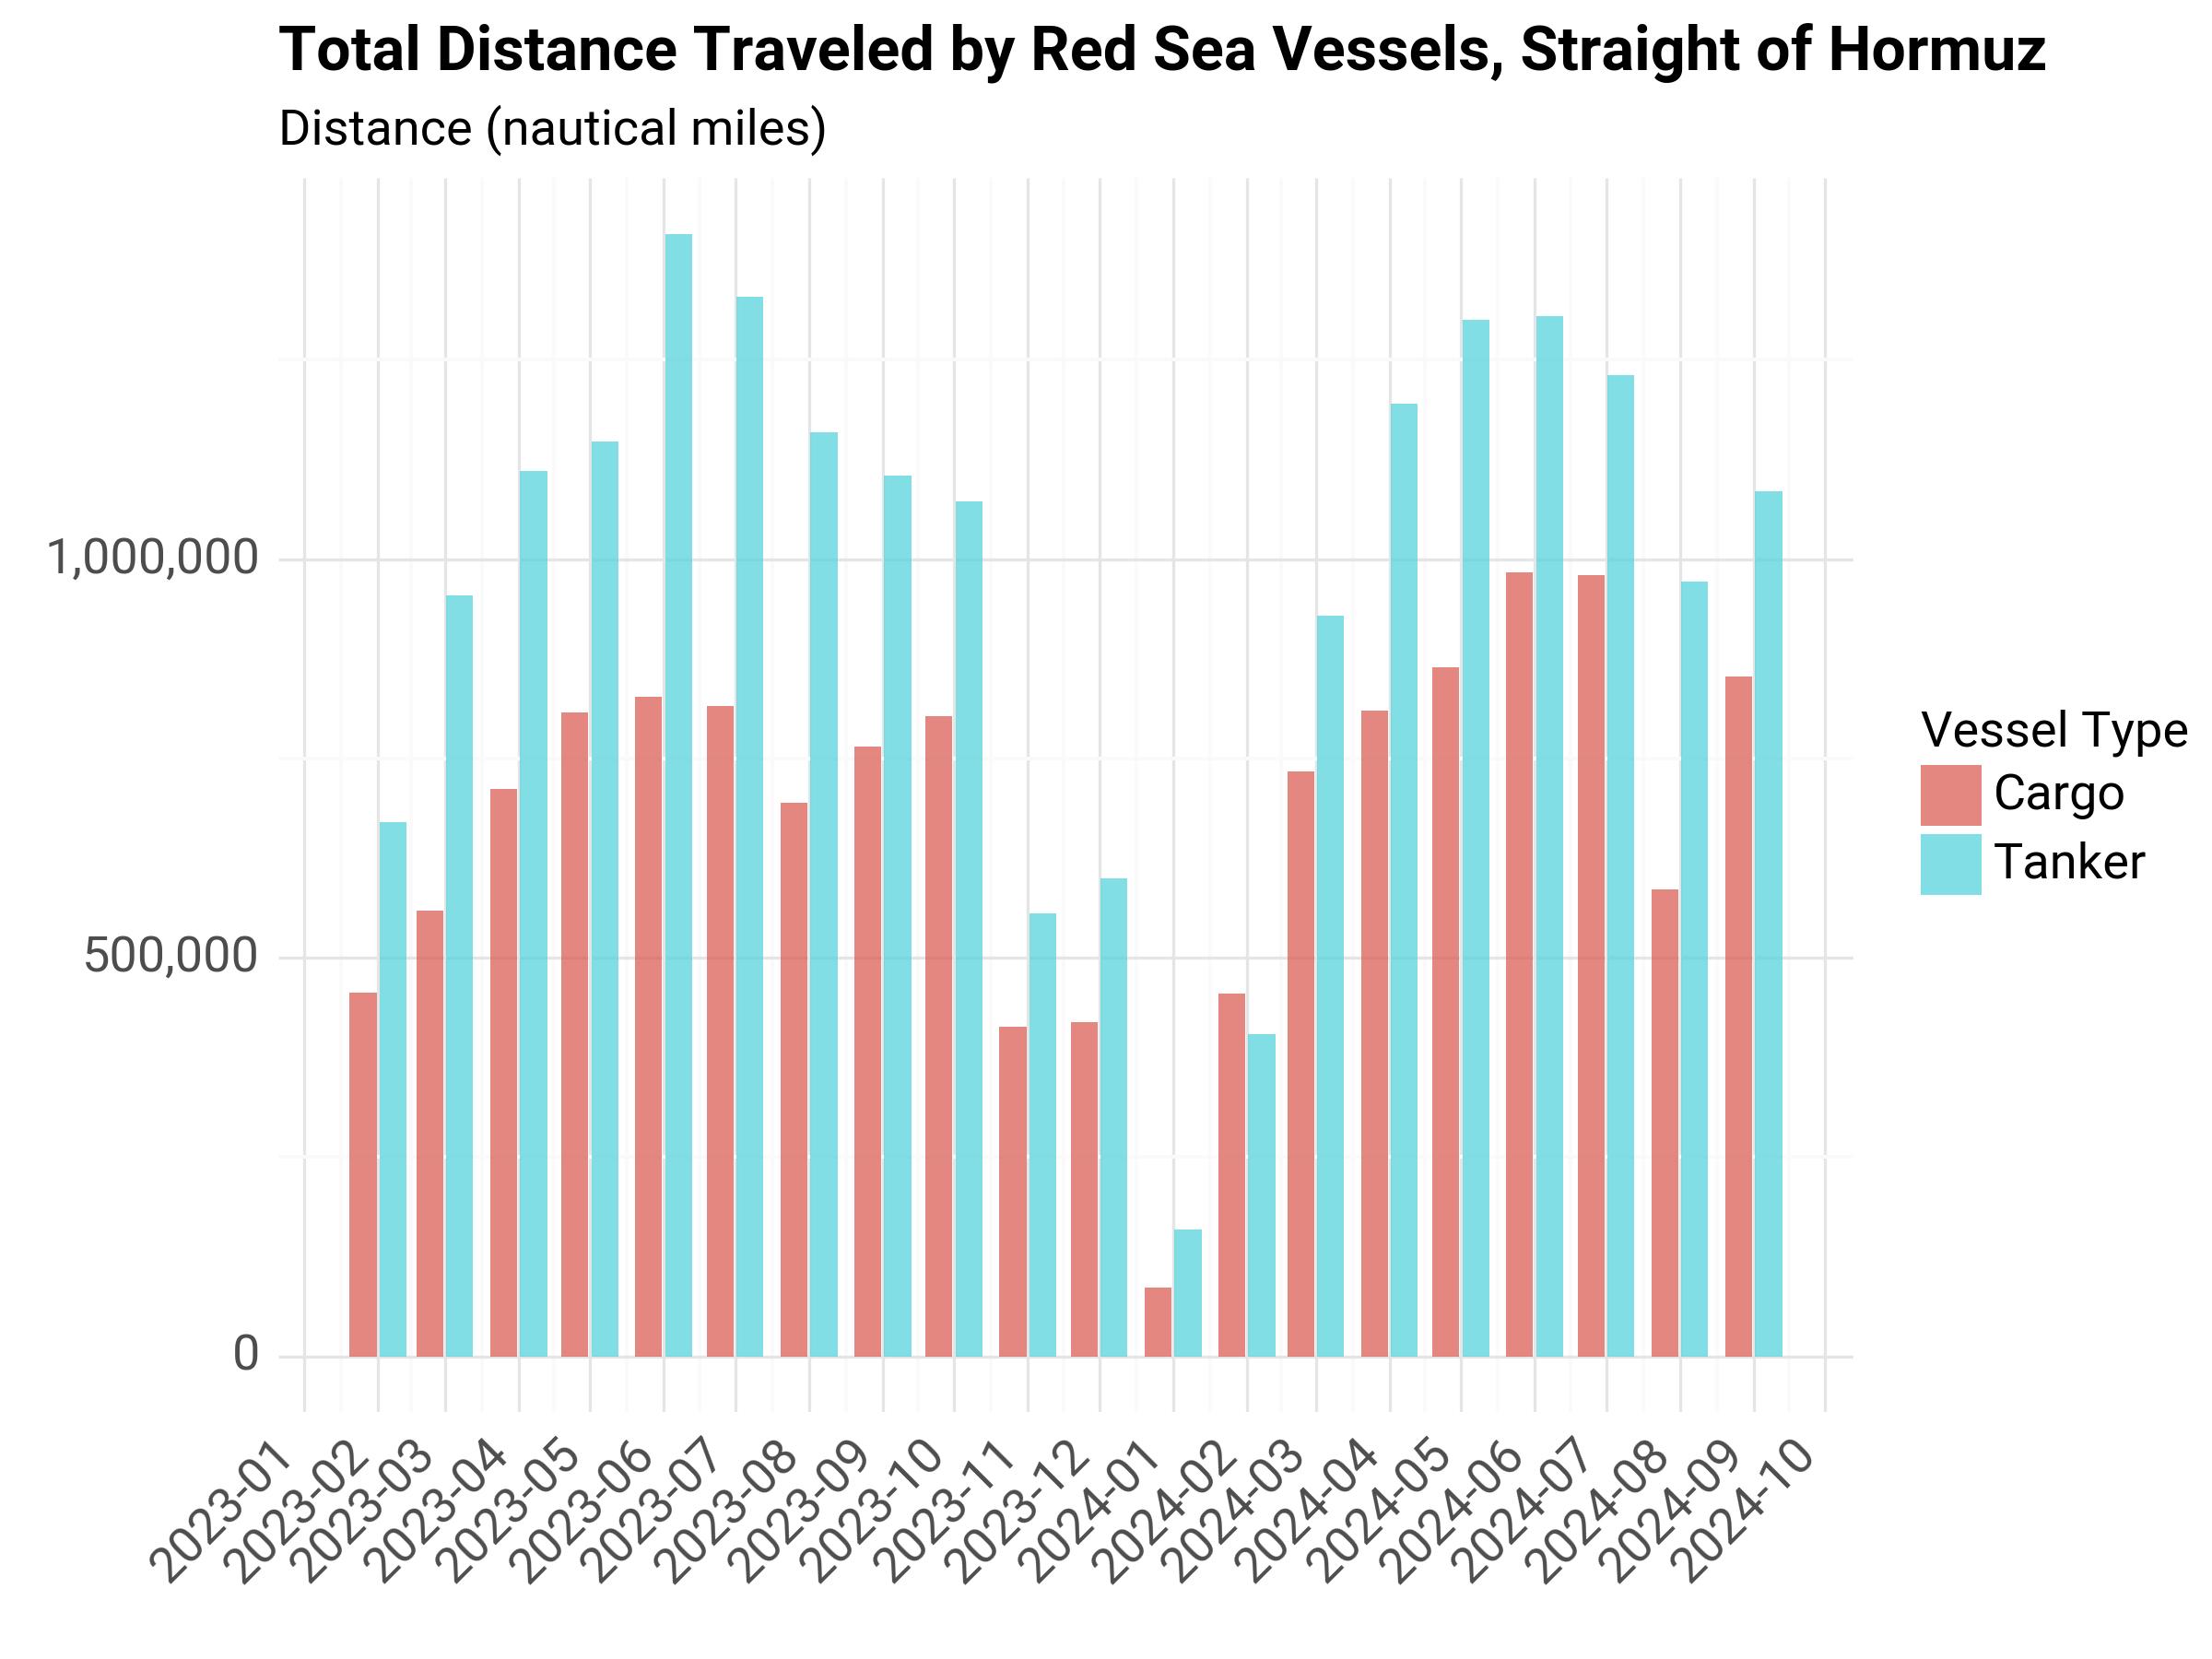
Fig. 16 Total Distance Traveled by Red Sea Vessels Crossing Straight of Hormuz#
CO2 Emissions Estimation#
We apply average fuel consumption factors to the shipping activity for a rough estimation of CO2 emitted. We multiply the number of estimated days of travel to a CO2 emission factor per fuel consumption. We follow the formulas identified in the IPCC report.
We use the emission factor from Table 7, CO2 for US ships, Ocean-going, and fuel consumption from Table 13, general cargo, assuming a fixed ship volume (average gross weight tonnage for cargo in 2000, (IUMI)[https://iumi.com/images/stories/IUMI/Pictures/Conferences/Genoa2001/Wednesday/05 statistics 5.pdf]).
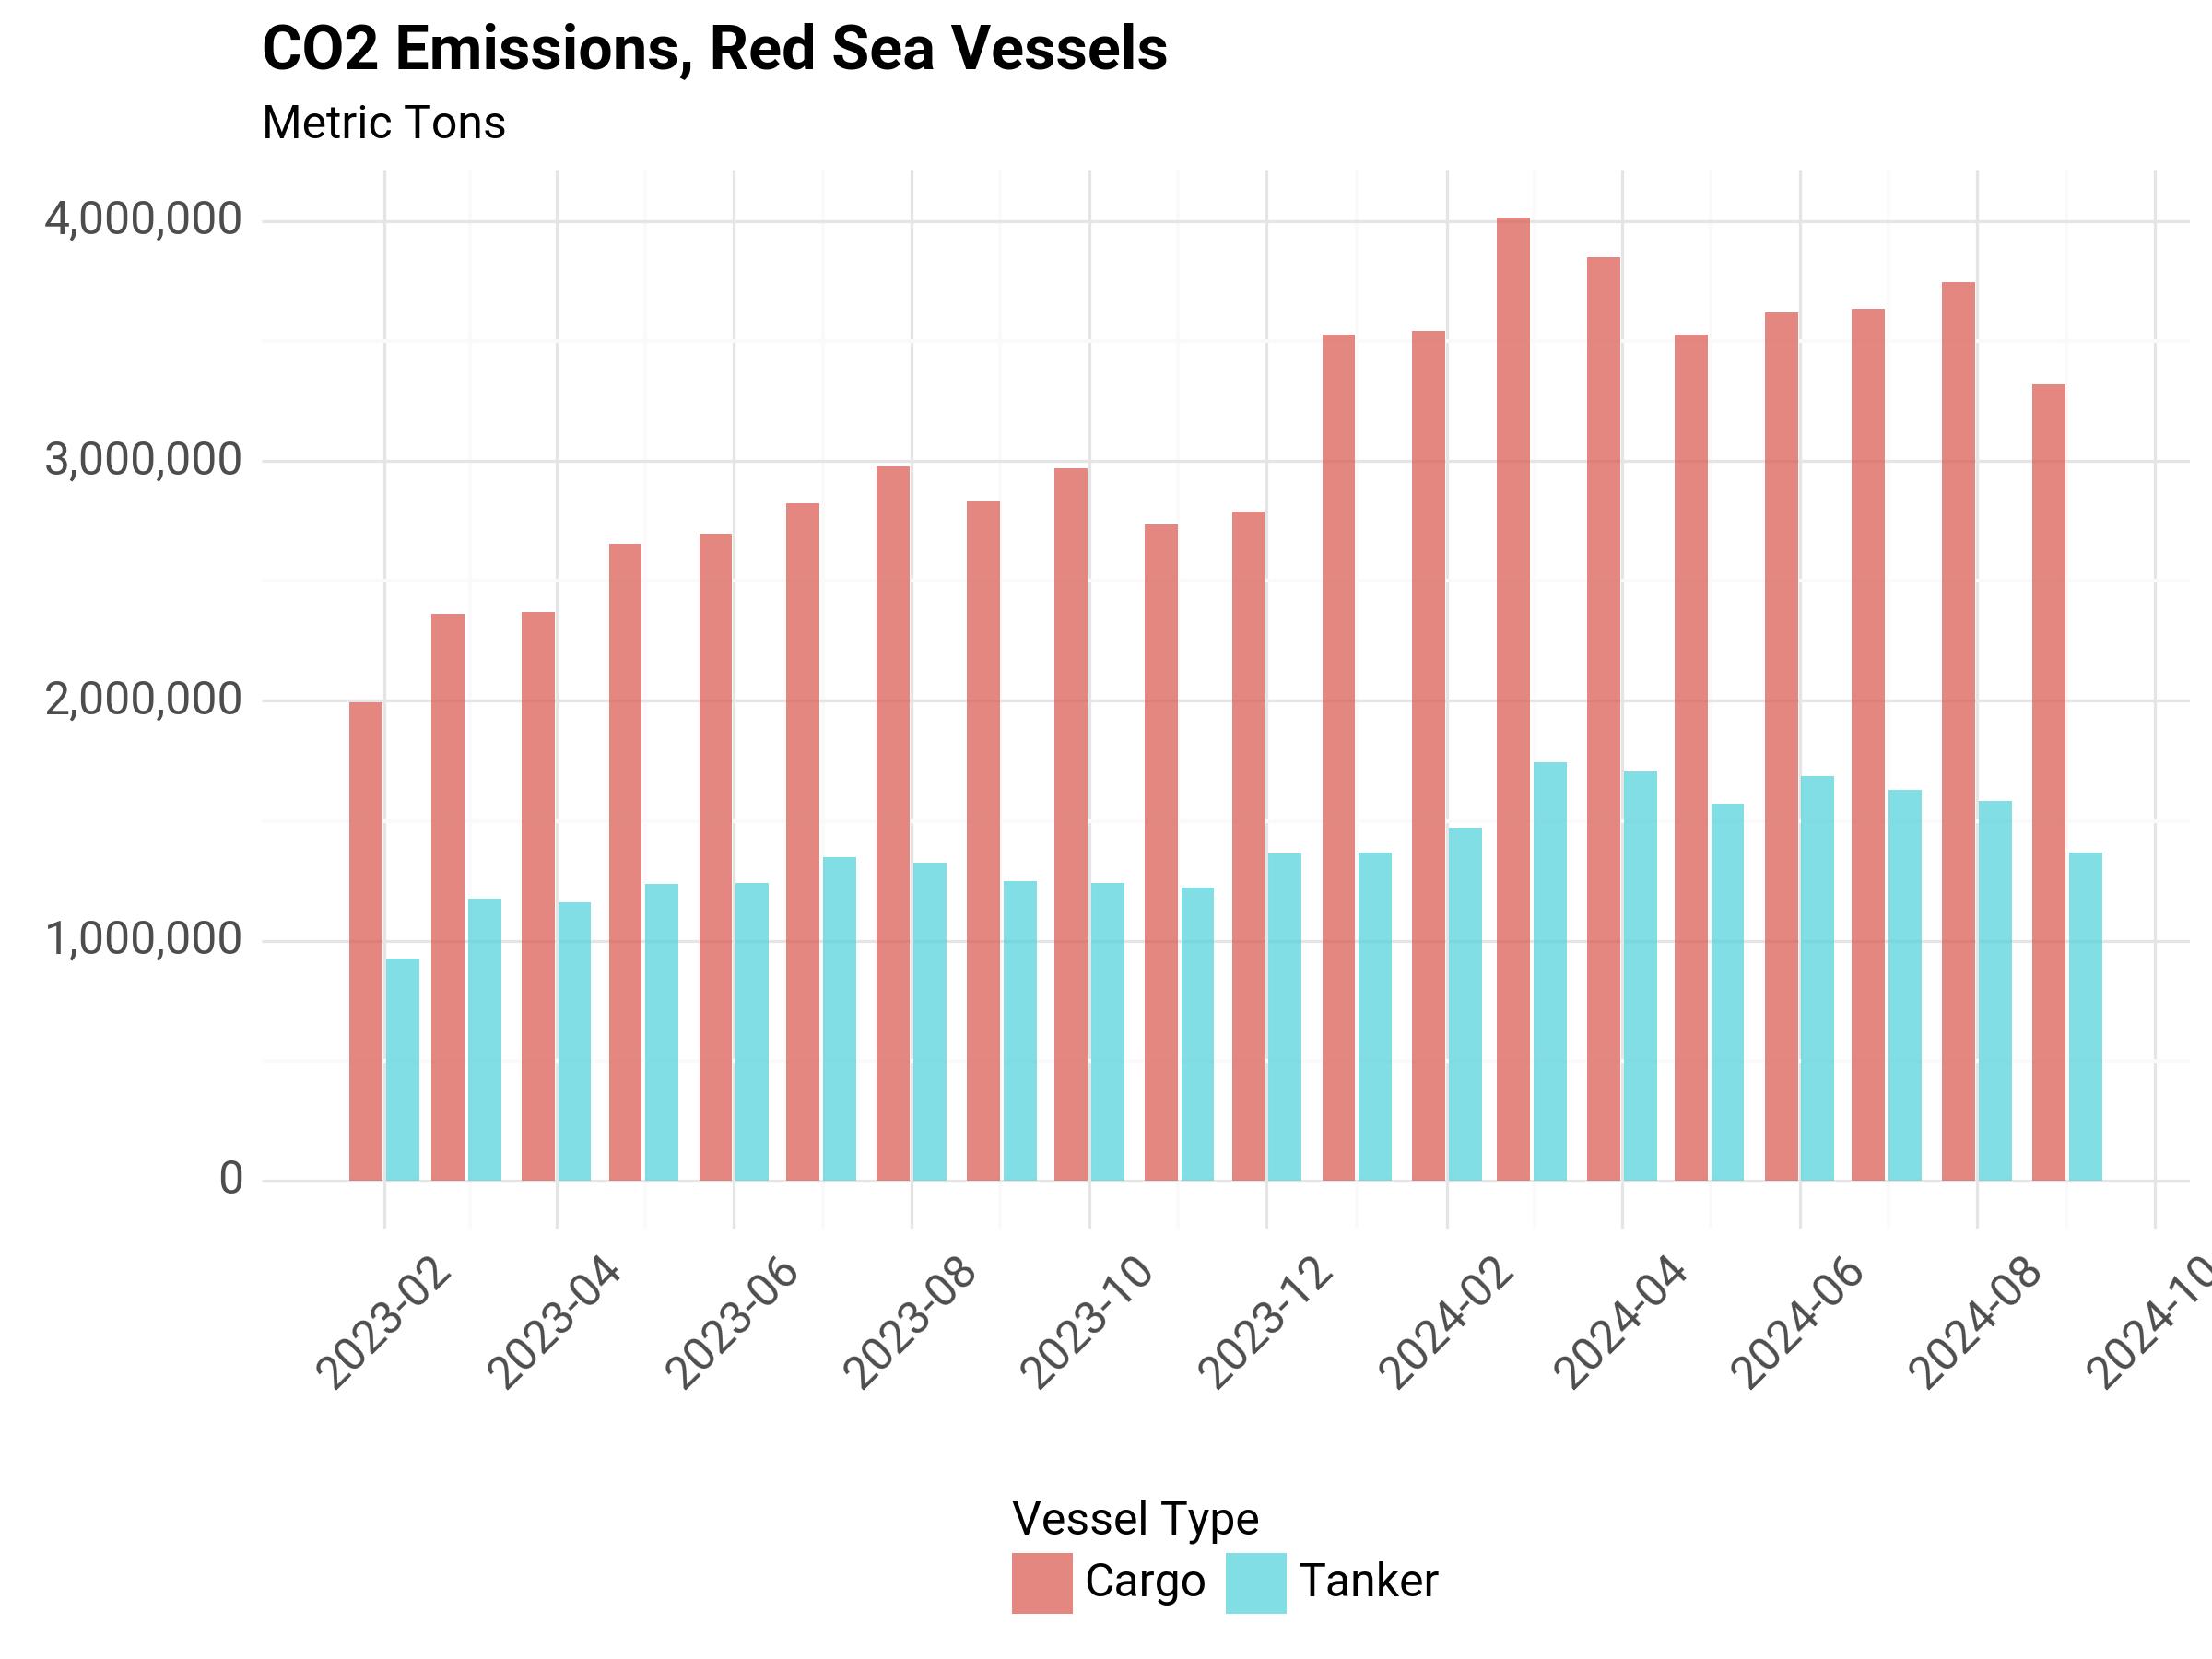
Fig. 17 Total Distance Traveled by Red Sea Vessels Crossing Bab el-Mandeb Strait#
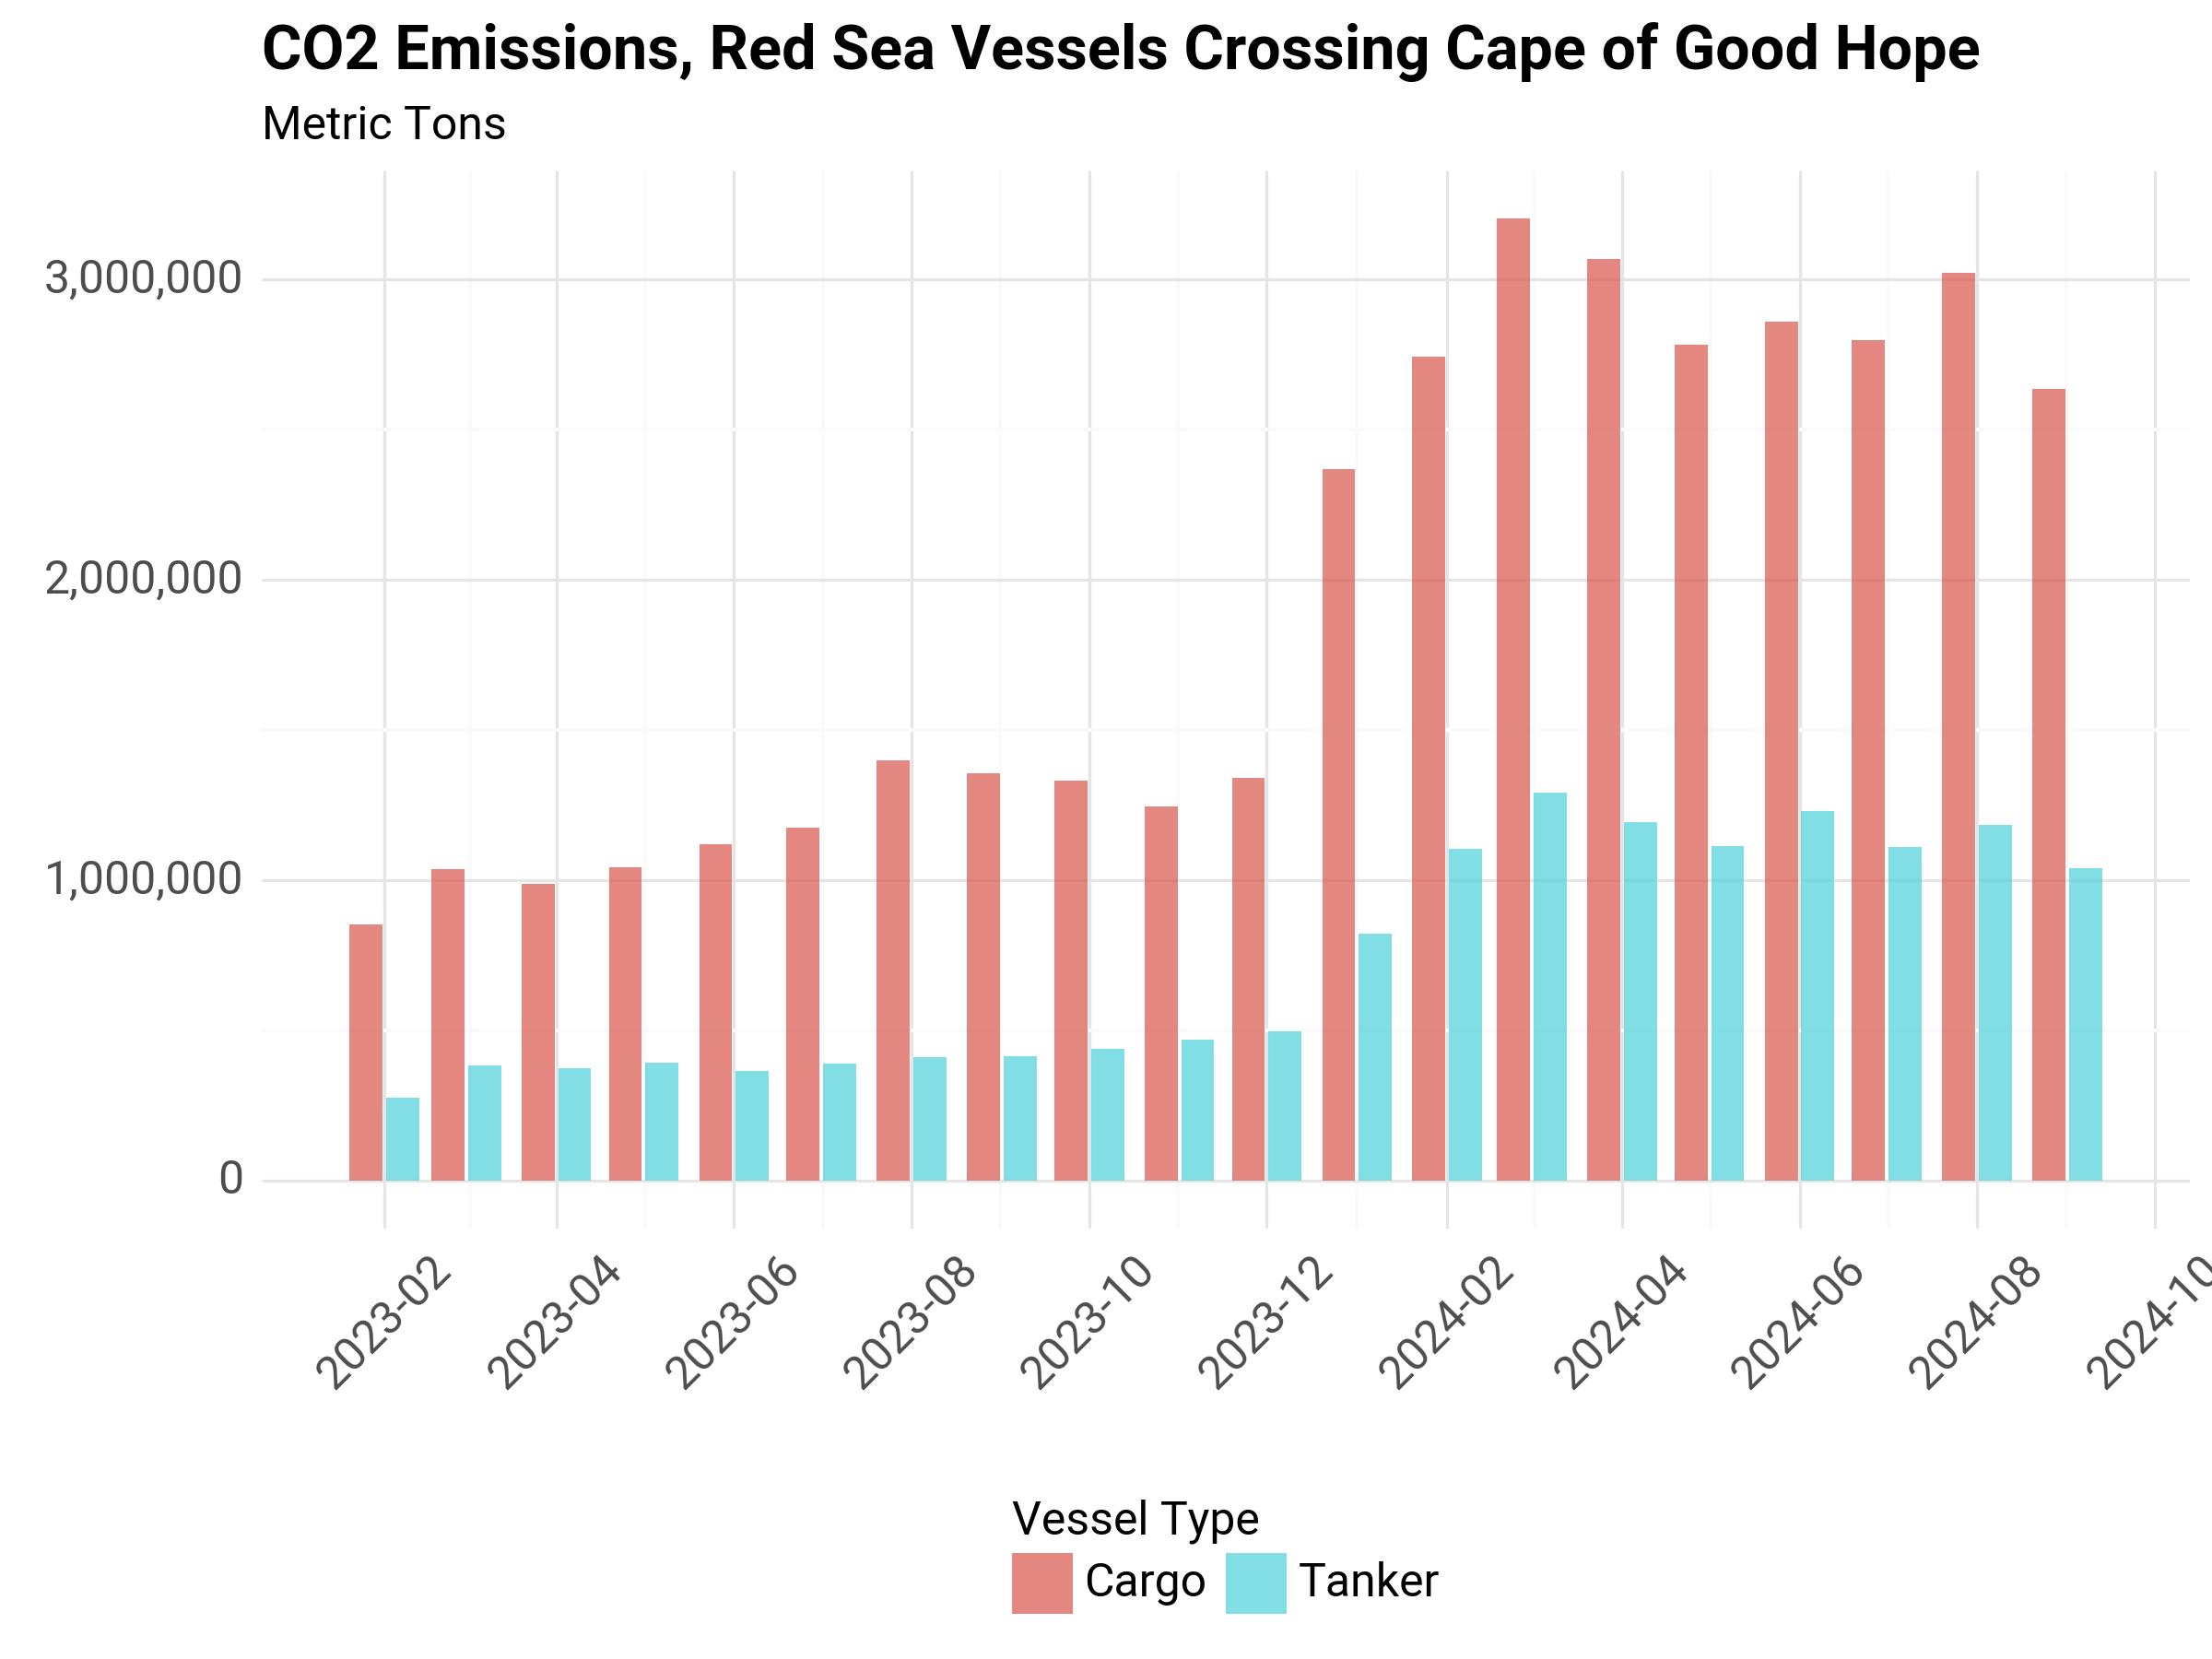
Fig. 18 Total Distance Traveled by Red Sea Vessels Crossing Cape of Good Hope#
Percentage Change from Baseline#
Using the same data, we define a baseline average pre-conflict (February 2023 through September 2023), and express the monthly value as a percent change from that baseline. Through this calculation, we find that emissions from an increase in distance traveled have raised up to 53% from a pre-conflict baseline for Cargo, and 28% for Tanker.
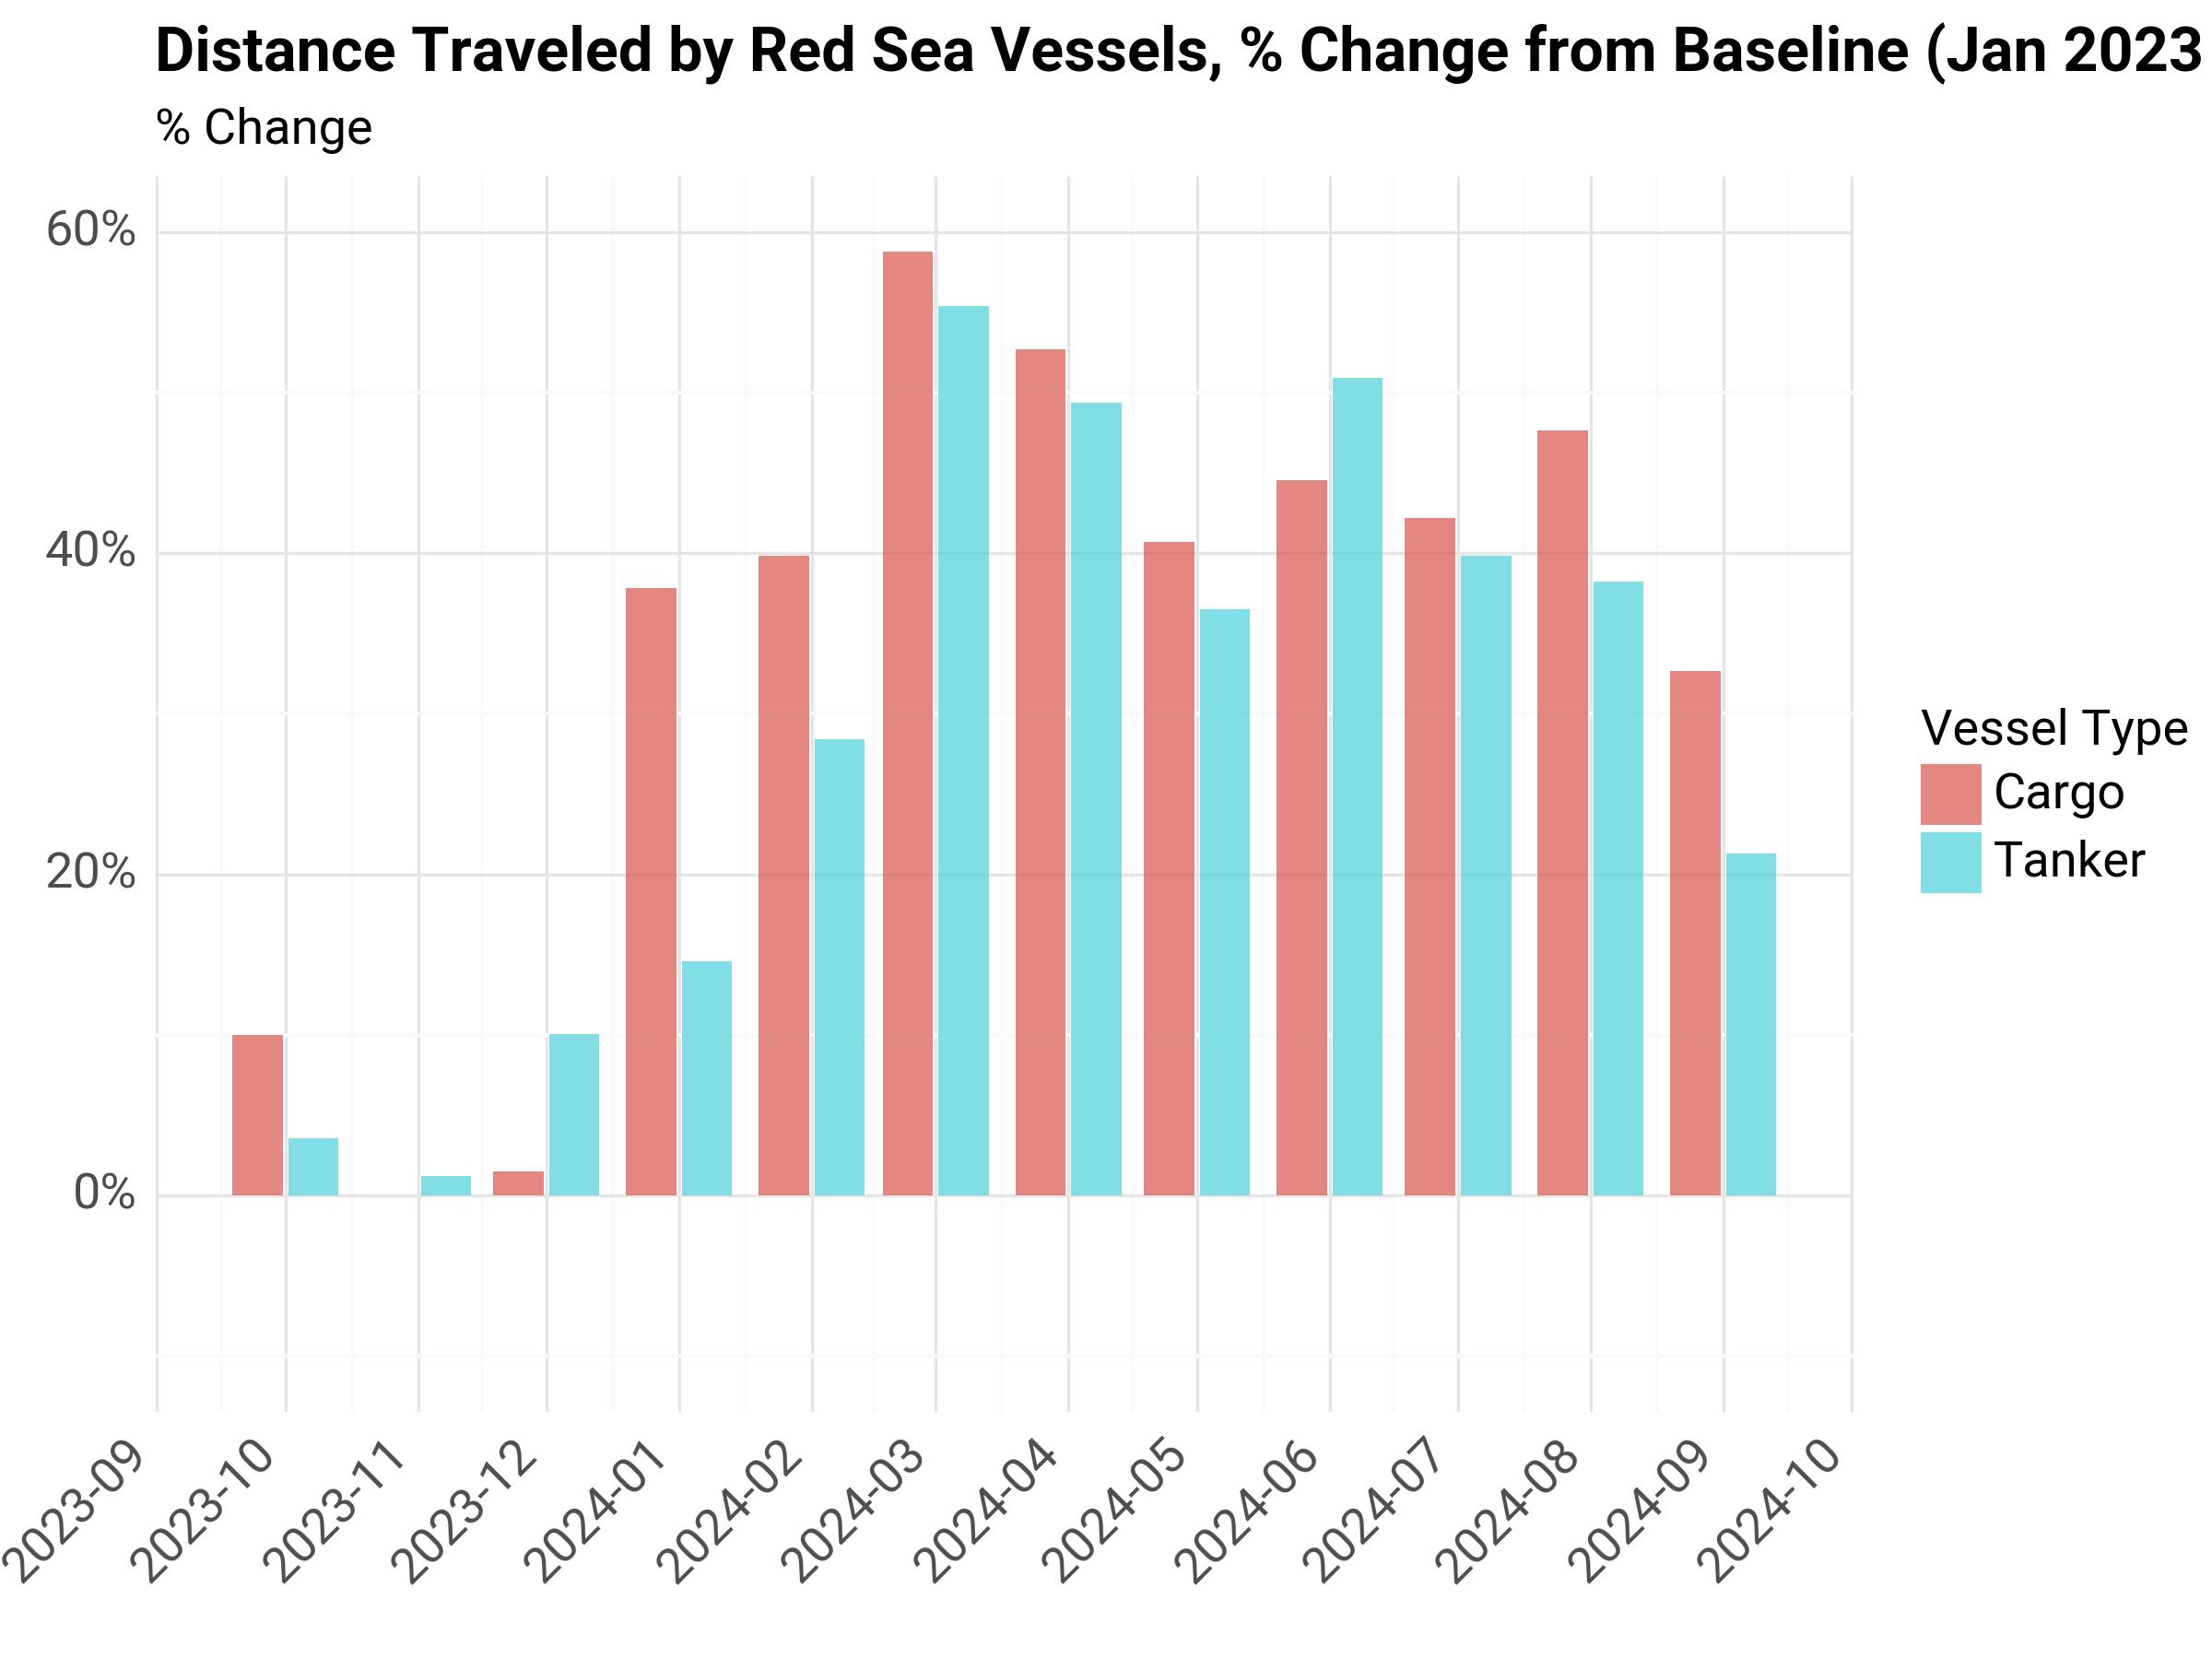
Fig. 19 Distance Traveled by Red Sea Vessels, % Change from Baseline#
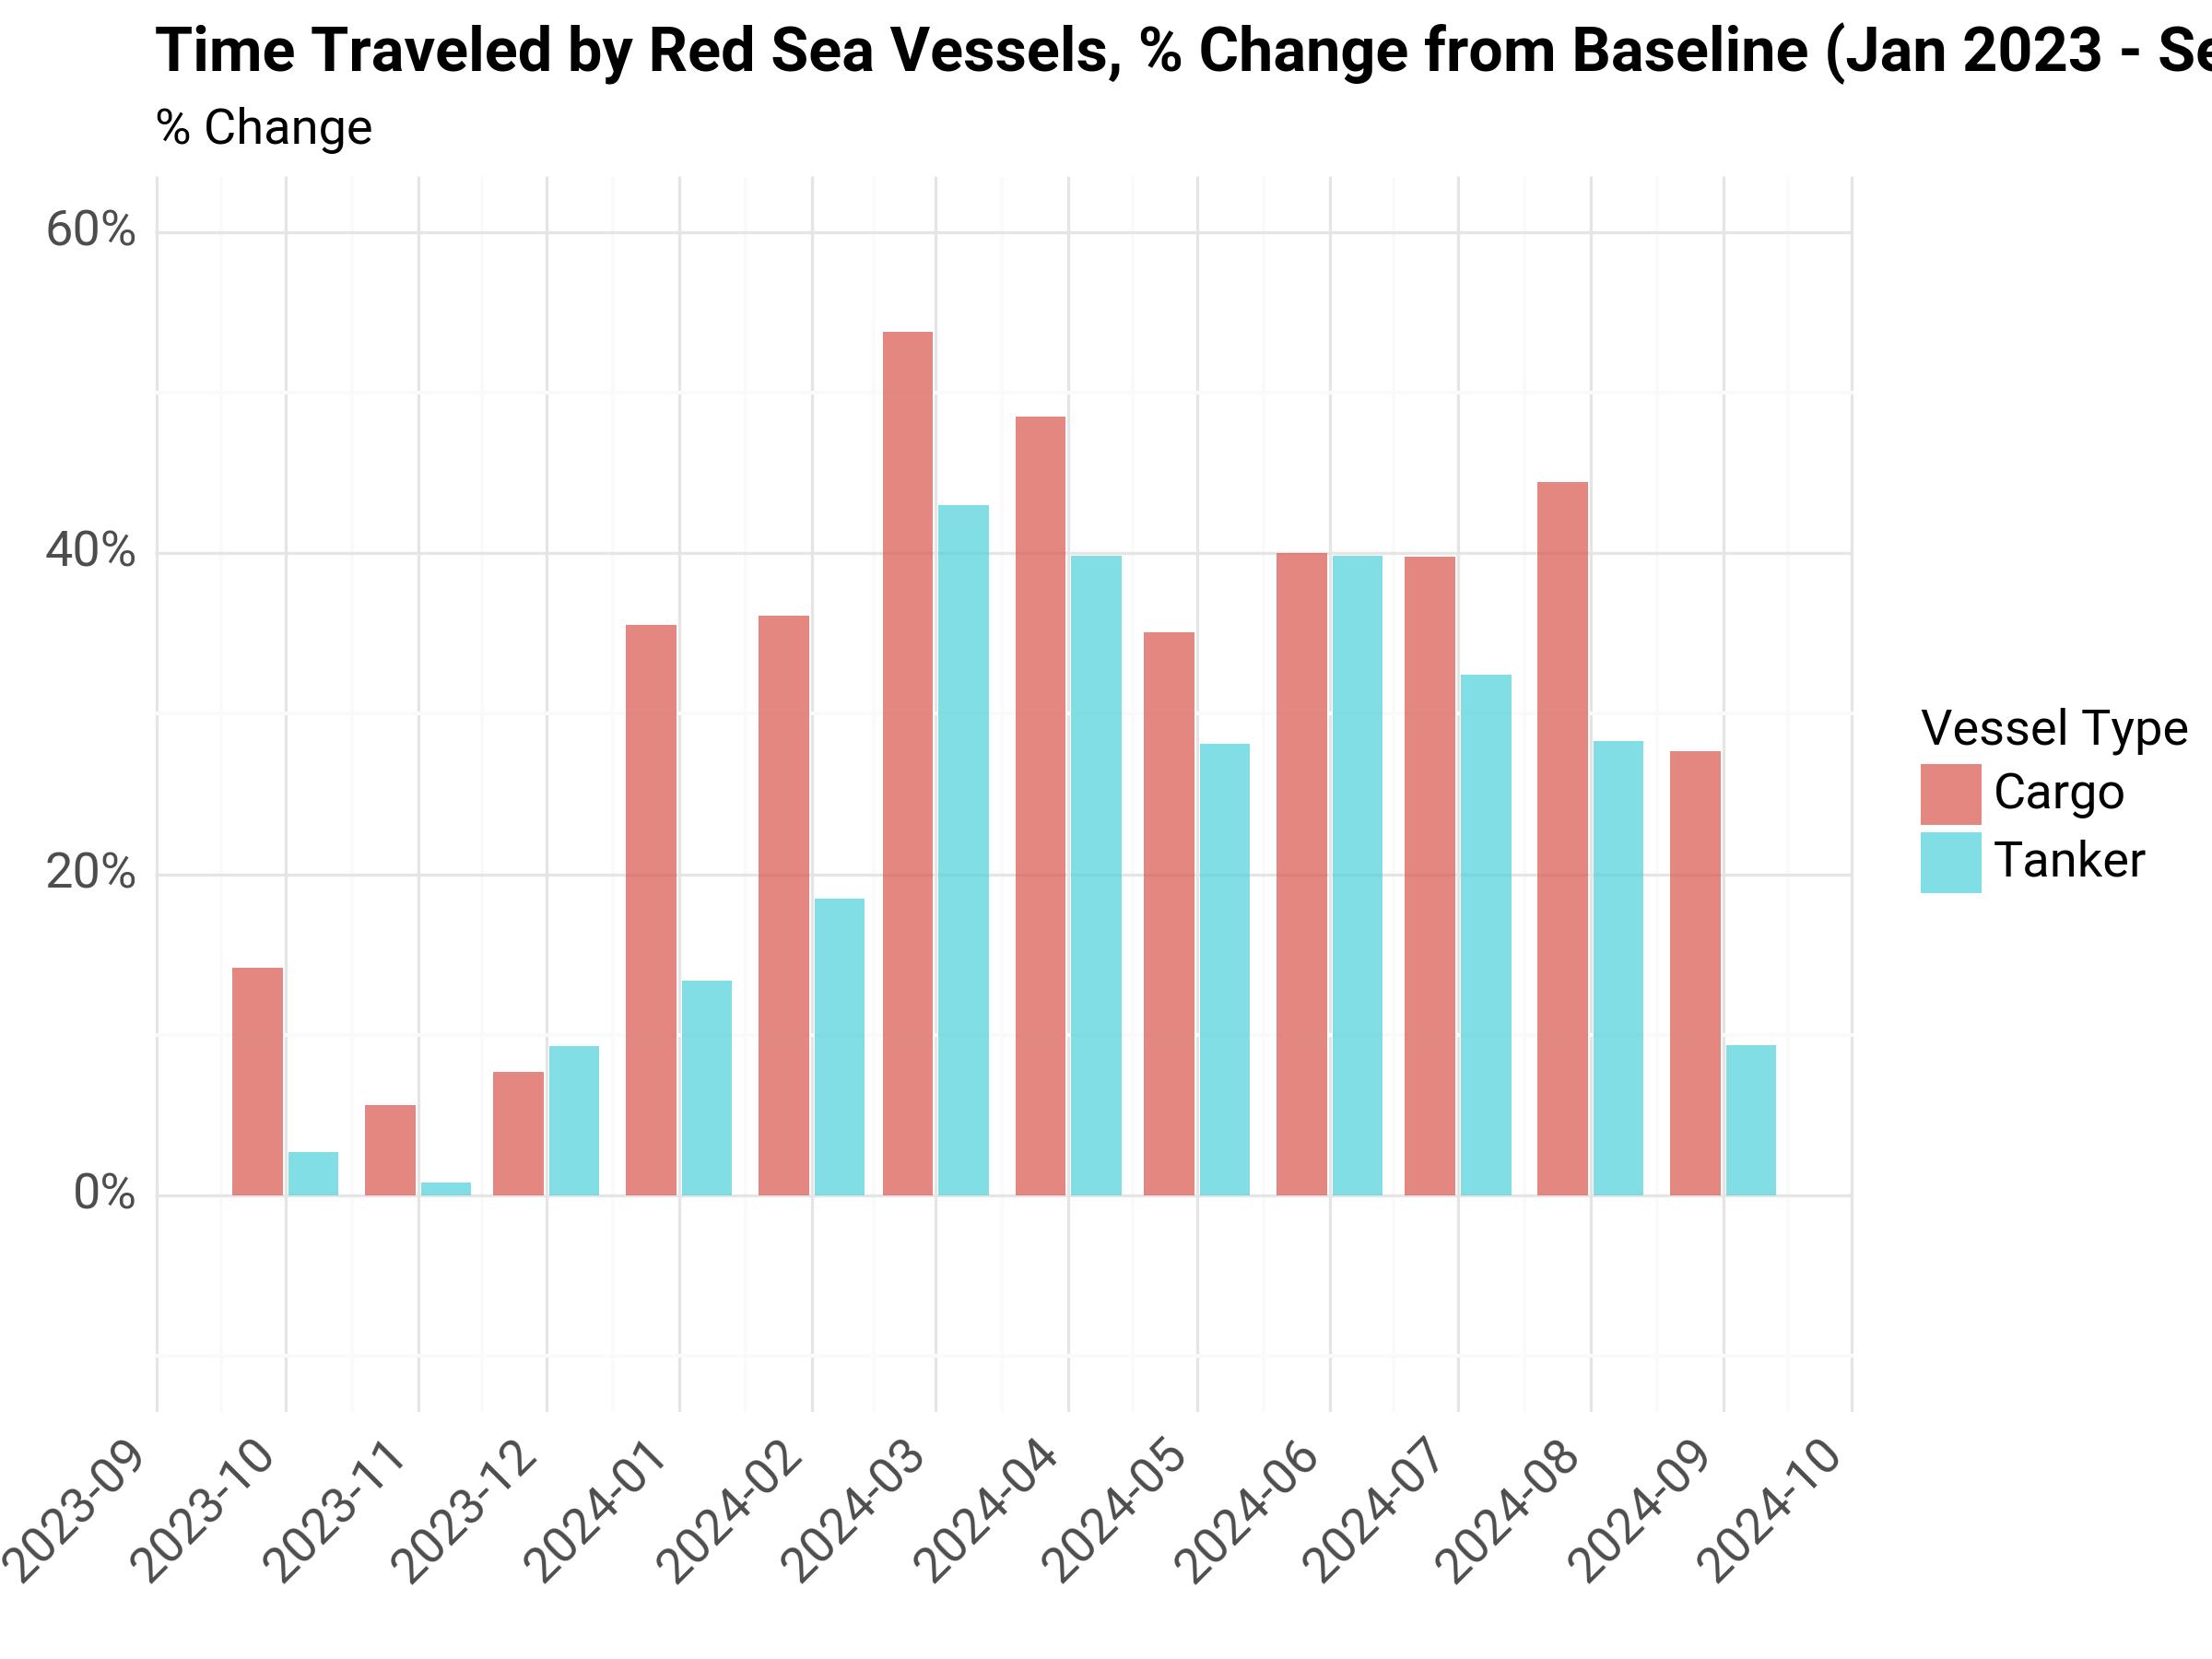
Fig. 20 Time Traveled by Red Sea Vessels, % Change from Baseline#
Cargo Vessels#
2024-01 |
2024-02 |
2024-03 |
2024-04 |
2024-05 |
2024-06 |
2024-07 |
2024-08 |
2024-09 |
|
|---|---|---|---|---|---|---|---|---|---|
% Change Distance Travel |
37.8% |
39.8% |
58.8% |
52.7% |
40.7% |
44.6% |
42.2% |
47.6% |
32.7% |
% Change Time Travel |
35.5% |
36.1% |
53.8% |
48.5% |
35.1% |
40.0% |
39.8% |
44.4% |
27.7% |
Tanker Vessels#
2024-01 |
2024-02 |
2024-03 |
2024-04 |
2024-05 |
2024-06 |
2024-07 |
2024-08 |
2024-09 |
|
|---|---|---|---|---|---|---|---|---|---|
% Change Distance Travel |
14.6% |
28.4% |
55.4% |
49.4% |
36.5% |
50.9% |
39.8% |
38.2% |
21.3% |
% Change Time Travel |
13.4% |
18.5% |
43.0% |
39.8% |
28.1% |
39.9% |
32.4% |
28.3% |
9.4% |
Global Emissions (OECD) Data#
The OECD has started reporting a monthly panel dataset of maritime transport CO2 emissions using the same AIS source data. We reviewed their dataset 2022 up to March 2024 and found that globally, emissions have remained constant despite the recent trade diversion caused by attacks in the red sea.
Allocation to countries is based on the residence of the companies that operate the ships. Vessel-level emissions estimates are linked to information on operators and aggregated for all countries or territories represented in the estimates. More information on their methodology can be obtained through the OECD Data Explorer website. Notably, they reference using information from the Fourth IMO Greenhouse Gas Study 2020.
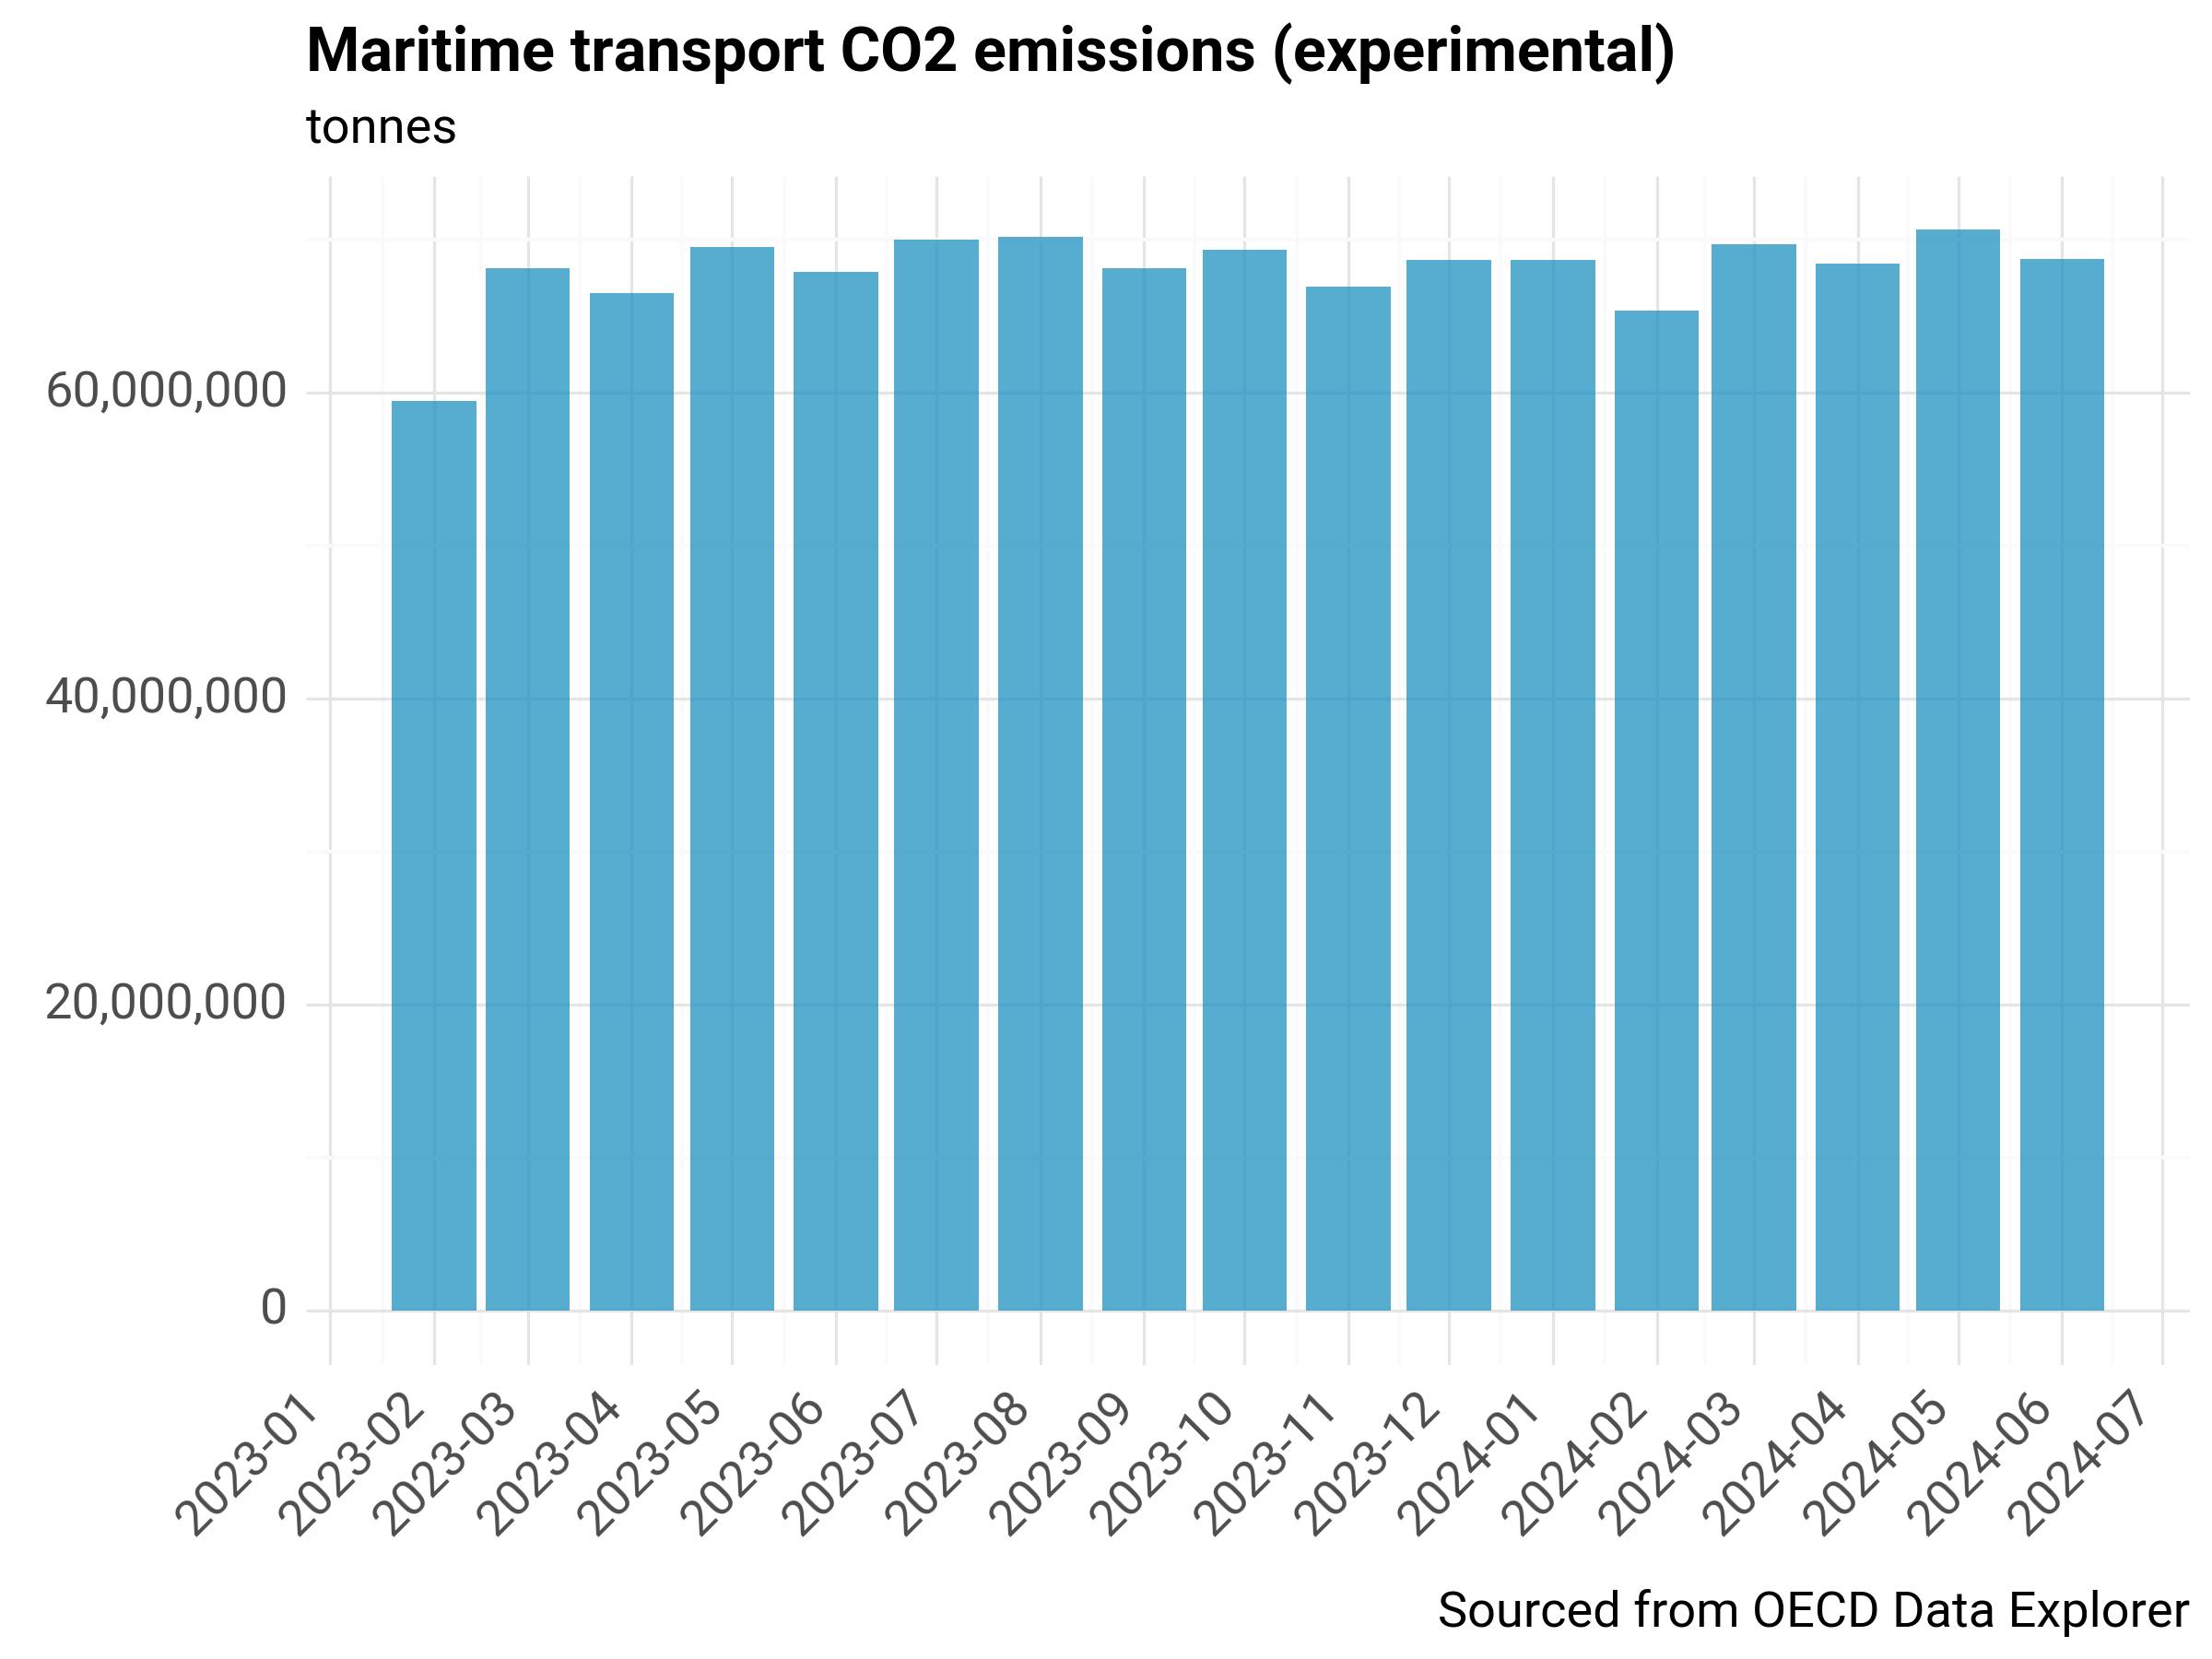
Fig. 21 Maritime transport CO2 emissions, OECD#
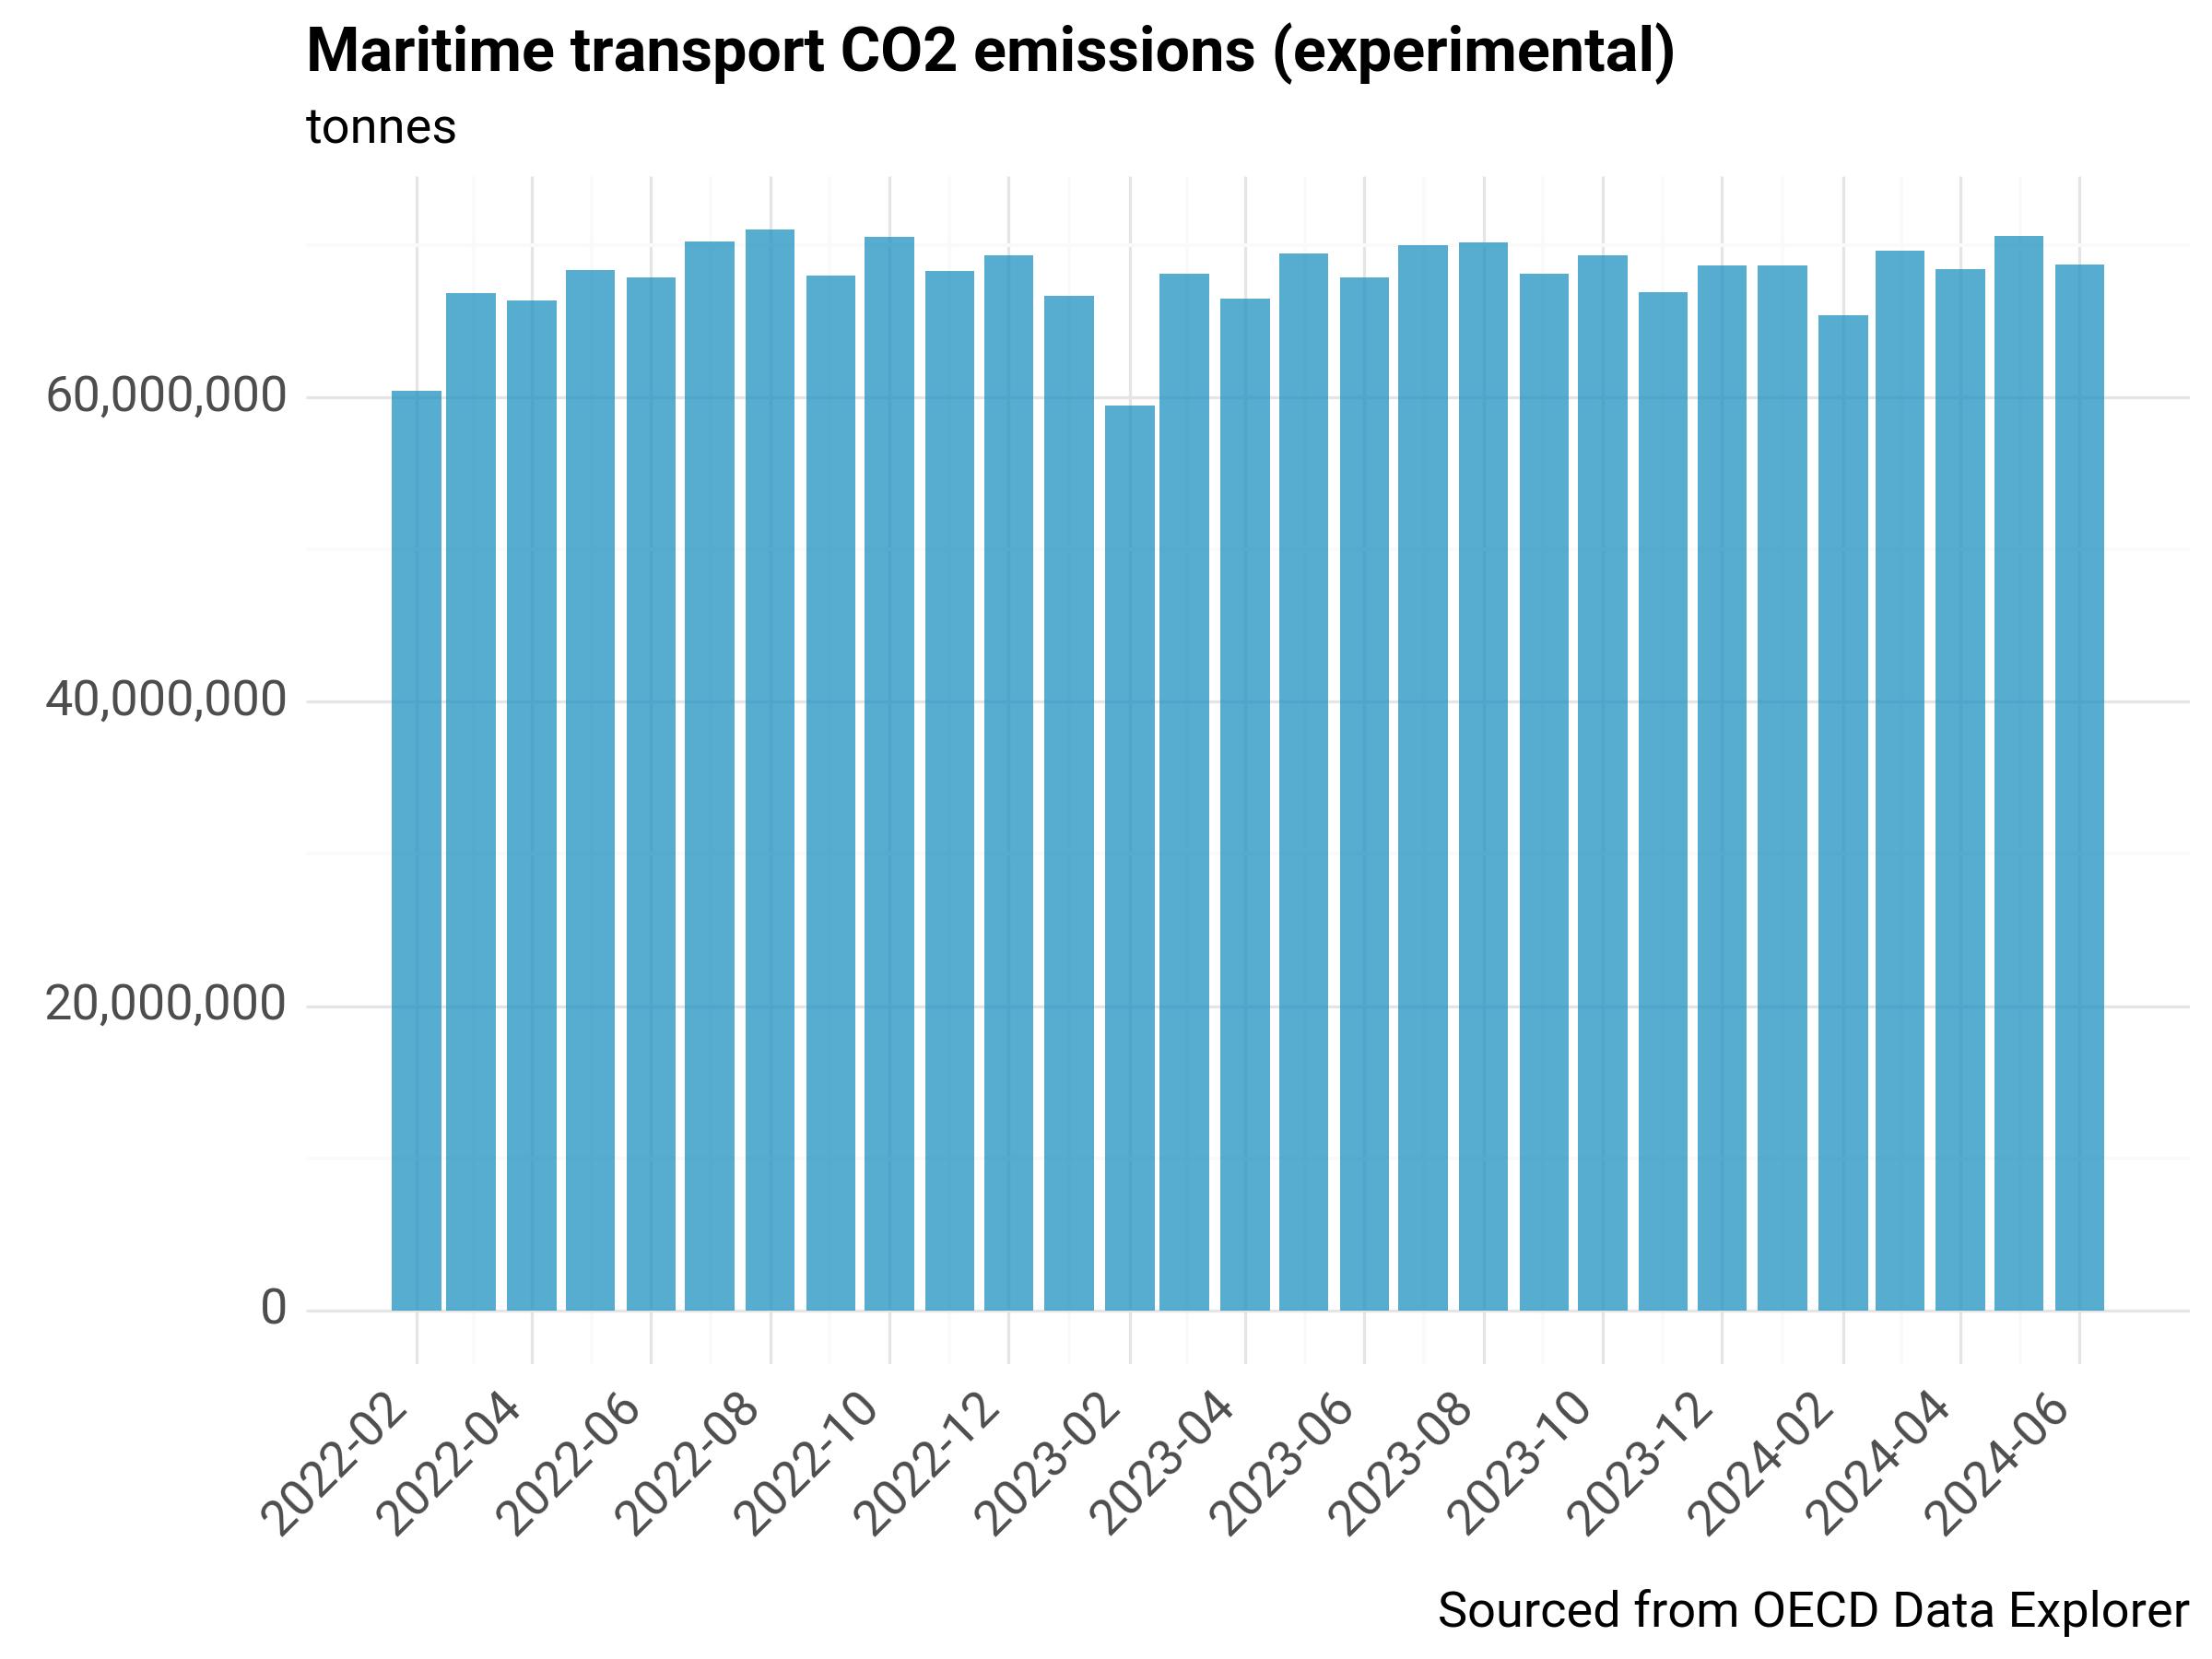
Fig. 22 Maritime transport CO2 emissions (historical from 2022), OECD#
Limitations#
The proxy for increase in emissions presented assumes a linear relationship between time distance traveled and emissions, which omits many factors which influence the amount of fuel consumed (speed, type of engine, amount of power required relative to cargo).
The distances and time travel calculated represent a best guess estimation of sea routes based on origin-destination ports, historical routes data, and an assumption that ships navigate through the shortest route available (with the restriction of having to traverse certain certain chokepoints). Thus, they may not represent the exact journeys that the ships followed.
References#
- Ban23
Asian Development Bank. Methodological framework for unlocking maritime insights using automatic identification system data: a special supplement of key indicators for asia and the pacific 2023. Asian Development Bank Publications, October 2023. doi:10.22617/FLS230401-2.
- CKomaromiLS20
Diego A. Cerdeiro, András Komáromi, Y. Liu, and Mamoon M. Saeed. World seaborne trade in real time: a proof of concept for building ais-based nowcasts from scratch. IMF Working Papers, 2020.
- VKH21a
Jasper Verschuur, Elco E Koks, and Jim W Hall. Global economic impacts of COVID-19 lockdown measures stand out in high-frequency shipping data. PLoS One, 16(4):e0248818, April 2021.
- VKH21b
Jasper Verschuur, Elco E. Koks, and Jim W. Hall. Observed impacts of the covid-19 pandemic on global trade. Nature Human Behaviour, 5(3):305–307, Mar 2021. doi:10.1038/s41562-021-01060-5.
