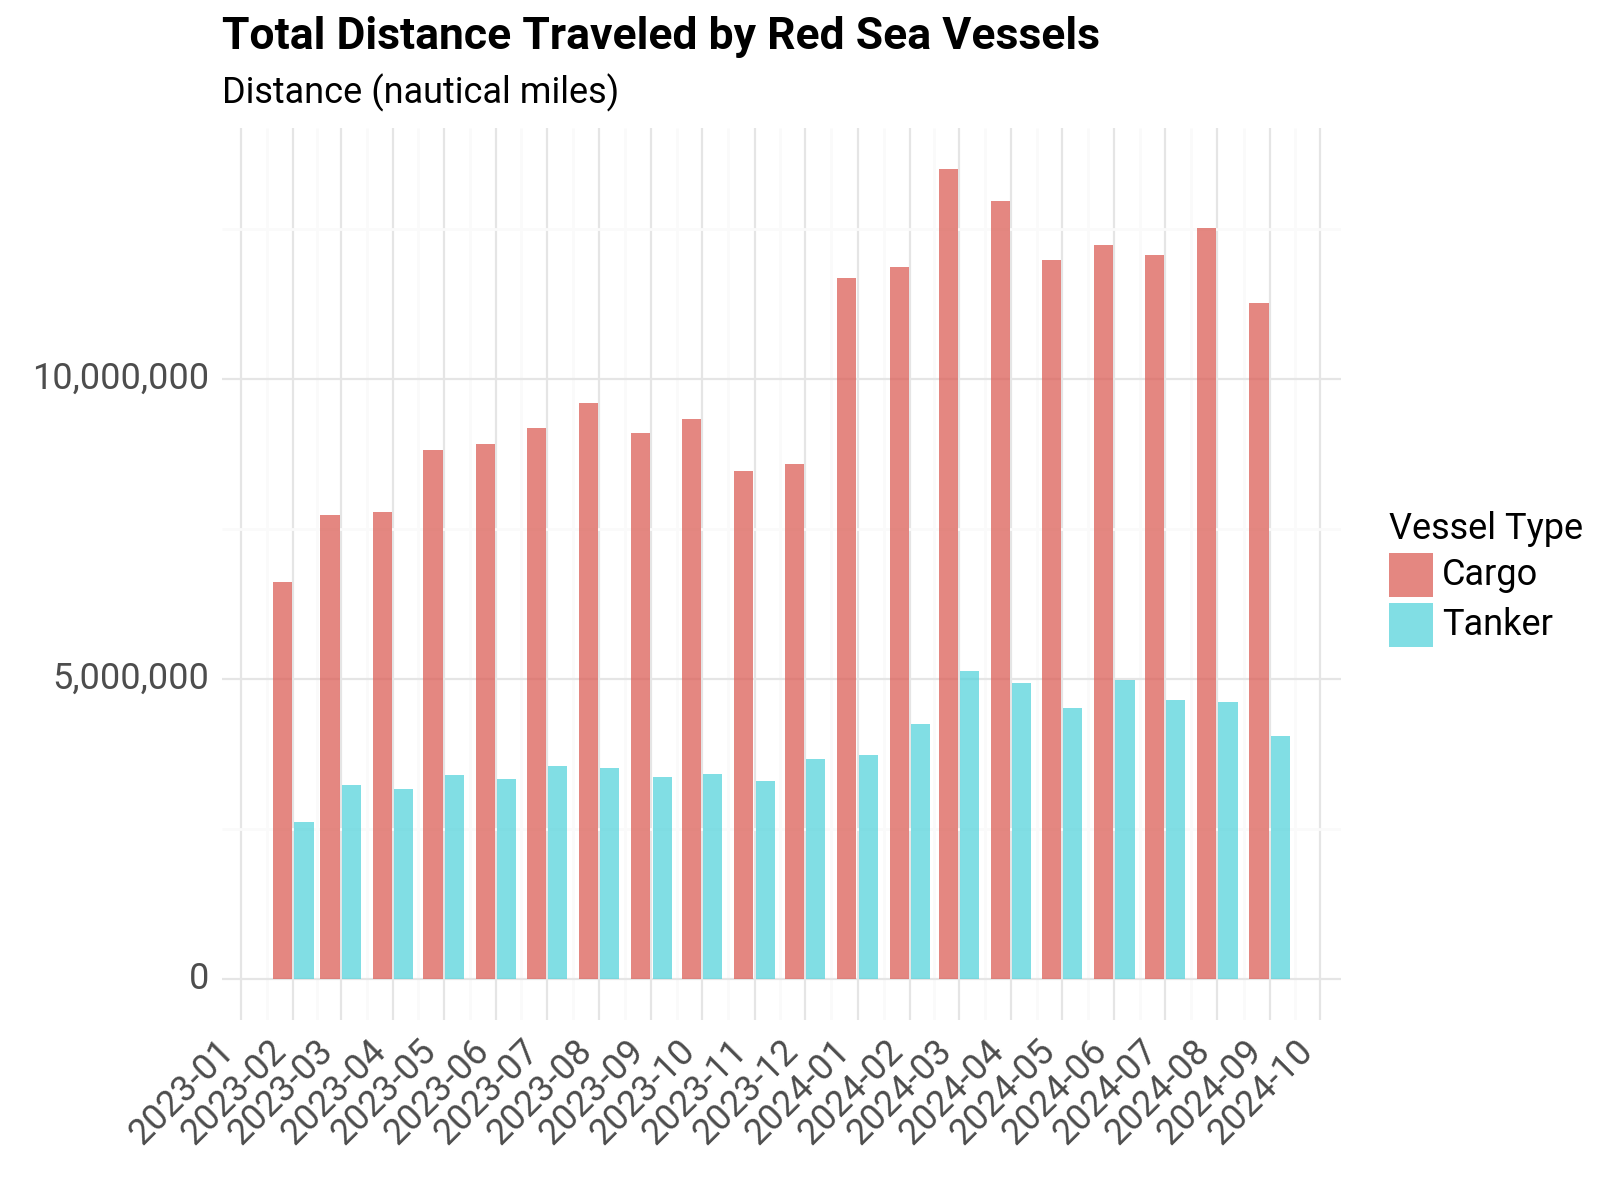
Data Analysis#
Setup#
import os
from os.path import join, expanduser
from datetime import datetime

import pandas as pd

import git

git_repo = git.Repo(os.getcwd(), search_parent_directories=True)
git_root = git_repo.git.rev_parse("--show-toplevel")

# For plotting
from plotnine import *
from mizani.breaks import date_breaks
from mizani.formatters import date_format, comma_format, percent_format
import plotnine

# plotnine.options.figure_size = (10, 8)
plotnine.options.figure_size = (5, 4)

output_dir = (
    r"C:\Users\WB514197\WBG\Development Data Partnership - Red Sea Maritime Monitoring"
)
charts_dir = join(git_root, "reports")
df = pd.read_parquet(
    join(expanduser("~"), "tmp", "ais", "hormuz", "portcalls_v5.parquet")
)
len(df)
2535792
df.arrival_dt_pos_utc = pd.to_datetime(df.arrival_dt_pos_utc)
df = df.loc[df.arrival_dt_pos_utc >= "2023-02-01"].copy()
df_ref = df.loc[df.arrival_dt_pos_utc < "2023-10-01"].copy()
# df = pd.read_csv(join(expanduser("~"), 'tmp', 'ais', 'G_sea_routes_edges.csv'), index_col=0)
# df.head(10).to_csv(join(expanduser("~"), 'tmp', 'ais', 'G_sea_routes_edges_sample.csv'))
Get Vessels that crossed Red Sea in Reference Period#
aois = ["Bab el-Mandeb Strait", "Suez Canal", "Straight of Hormuz"]
df_sel = df.loc[(df.prev_port.isin(aois)) | (df.Port.isin(aois))].copy()
# df2 = df.loc[(df.prev_port.isin(aois)) | (df.Port.isin(aois))].copy()
unique_vessels_red_sea = list(set(df_sel.unique_id))
unique_vessels = list(set(df.unique_id))
len(unique_vessels_red_sea) / len(unique_vessels)
0.13932403000725982
df2 = df.loc[df.unique_id.isin(unique_vessels_red_sea)].copy()
len(df2) / len(df)
1.0
Select only Cargo and Tanker for reporting
# df2.vessel_type.value_counts()
df2 = df.copy()
types_sel = ["Cargo", "Tanker"]
df2 = df2[df2["vessel_type"].isin(types_sel)].copy()
len(df2) / len(df)
0.7131265483948988
Filter out short trips
df2 = df2.loc[df2.time_travel > 1].copy()
df2.loc[:, "ymd"] = df2.apply(
    lambda x: datetime(year=x["year"], month=x["month"], day=1), axis=1
)
# 1. https://www.ipcc-nggip.iges.or.jp/public/gp/bgp/2_4_Water-borne_Navigation.pdf
# 2. https://iumi.com/images/stories/IUMI/Pictures/Conferences/Genoa2001/Wednesday/05%20statistics%205.pdf

Emissions_Factor = 3212  # (g/kg) - Table 7 (CO2 for US ships, Ocean-going)
Average_Gross_Tonnage = (
    12042  # Gigaton - Average gross weight tonnage for cargo in 2000, from link 2
)
Fuel_Consumption = 9.8197 + (
    0.00143 * Average_Gross_Tonnage
)  # (Mg/day) - Fuel consumption factor from Table 13 (general cargo)
days = 1  # This parameter will change depending on time traveled
Fuel_Consumption_Total = Fuel_Consumption * days
# Result is in micrograms per day, does it need to be converted to kg to multiply by emissions factor?
Fuel_Consumption_Total_kg = Fuel_Consumption_Total * 1000  # Kg per day
# convert megagrams to kilograms

# If so, results in a very small number, otherwise...
Emissions = Emissions_Factor * Fuel_Consumption_Total_kg
Emissions
86851709.12
def get_emissions(row):
    Fuel_Consumption_Total = Fuel_Consumption * row["days_travel2"]
    Fuel_Consumption_Total_kg = Fuel_Consumption_Total * 1000
    Emissions = Emissions_Factor * Fuel_Consumption_Total_kg
    Emissions_mt = Emissions / 1000000
    return Emissions_mt
df2["time_travel2"] = pd.to_timedelta(df["time_travel"], unit="H")
df2.loc[:, "days_travel2"] = df["time_travel"] / 24
df2.loc[:, "emissions"] = df2.apply(lambda x: get_emissions(x), axis=1)
group_cols = ["ymd", "vessel_type"]
data_cols = ["time_travel", "distance", "emissions", "days_travel2"]
df_horm = df2.loc[
    (df2.Port == "Straight of Hormuz") | (df2.prev_port == "Straight of Hormuz")
].copy()
df_agg_horm = df_horm.groupby(group_cols)[data_cols].sum().reset_index()
p4 = (
    ggplot(df_agg_horm, aes(x="ymd", y="distance", fill="vessel_type"))  #
    + geom_bar(
        alpha=3 / 4,
        stat="identity",
        position="dodge2",
    )
    + labs(
        x="",
        y="",
        subtitle="Distance (nautical miles)",
        fill="Vessel Type",
        title="Total Distance Traveled by all Vessels, Straight of Hormuz",
        # caption="This chart shows the monthly total distance traveled by a subset of vessels that were identified to cross the Red Sea in a reference period \n(January 2023 through October), and have crossed the Cape of Good Hope",
    )
    + theme_minimal()
    + scale_y_continuous(labels=comma_format())
    + scale_x_datetime(breaks=date_breaks("1 month"), labels=date_format("%Y-%m"))
    + theme(
        text=element_text(family="Roboto", size=13),
        plot_title=element_text(family="Roboto", size=16, weight="bold"),
        axis_text_x=element_text(rotation=45, hjust=1),
        legend_position="right",
    )
)
# display(p4)
p4.save(filename=join(charts_dir, "routes", "distance-traveled-horm-all.jpeg"), dpi=300)
c:\WBG\Anaconda3\envs\rtmis\Lib\site-packages\plotnine\ggplot.py:587: PlotnineWarning: Saving 8 x 6 in image.
c:\WBG\Anaconda3\envs\rtmis\Lib\site-packages\plotnine\ggplot.py:588: PlotnineWarning: Filename: C:/Users/WB514197/Repos/red-sea-monitoring\reports\routes\distance-traveled-horm-all.jpeg
df_cape = df2.loc[
    (df2.Port == "Cape of Good Hope") | (df2.prev_port == "Cape of Good Hope")
].copy()
df_bab = df2.loc[
    (df2.Port == "Bab el-Mandeb Strait") | (df2.prev_port == "Bab el-Mandeb Strait")
].copy()
df_horm = df2.loc[
    (df2.Port == "Straight of Hormuz") | (df2.prev_port == "Straight of Hormuz")
].copy()
df3 = pd.concat([df_cape, df_bab])
df3.reset_index(drop=False, inplace=True)
df3 = df3.loc[~df3.duplicated(subset="index")].copy()
group_cols = ["ymd", "vessel_type"]
data_cols = ["time_travel", "distance", "emissions", "days_travel2"]
df_agg = df3.groupby(group_cols)[data_cols].sum().reset_index()
df_agg_cape = df_cape.groupby(group_cols)[data_cols].sum().reset_index()
df_agg_bab = df_bab.groupby(group_cols)[data_cols].sum().reset_index()
df_agg_horm = df_horm.groupby(group_cols)[data_cols].sum().reset_index()
# plotnine.options.figure_size = (10, 8)
# plotnine.options.figure_size = (5, 4)
plotnine.options.figure_size = (8, 6)
p0 = (
    ggplot(df_agg, aes(x="ymd", y="distance", fill="vessel_type"))  #
    + geom_bar(
        alpha=3 / 4,
        stat="identity",
        position="dodge2",
    )
    + labs(
        x="",
        y="",
        subtitle="Distance (nautical miles)",
        title="Total Distance Traveled by Red Sea Vessels",
        # caption="This chart shows the monthly total distance traveled by a subset of vessels that were identified to cross the Red Sea in a reference period \n(January 2023 through October), and have either crossed the Bab el-Mandeb Strait or the Cape of Good Hope in the period of interest.",
        fill="Vessel Type",
    )
    + theme_minimal()
    + scale_y_continuous(labels=comma_format())
    + scale_x_datetime(breaks=date_breaks("1 month"), labels=date_format("%Y-%m"))
    + theme(
        text=element_text(family="Roboto", size=13),
        plot_title=element_text(family="Roboto", size=16, weight="bold"),
        axis_text_x=element_text(rotation=45, hjust=1),
        legend_position="right",
    )
)
display(p0)
# p0.save(filename=join(charts_dir, "routes", "distance-traveled.jpeg"), dpi=300)
p1 = (
    ggplot(df_agg_bab, aes(x="ymd", y="distance", fill="vessel_type"))  #
    + geom_bar(
        alpha=3 / 4,
        stat="identity",
        position="dodge2",
    )
    + labs(
        x="",
        y="",
        subtitle="Distance (nautical miles)",
        fill="Vessel Type",
        title="Total Distance Traveled by Red Sea Vessels - Bab el-Mandeb Strait",
        # caption="This chart shows the monthly total distance traveled by a subset of vessels that were identified to cross the Red Sea in a reference period \n(January 2023 through October), and have crossed the Bab el-Mandeb Strait",
    )
    + theme_minimal()
    + scale_y_continuous(labels=comma_format())
    + scale_x_datetime(breaks=date_breaks("1 month"), labels=date_format("%Y-%m"))
    + theme(
        text=element_text(family="Roboto", size=13),
        plot_title=element_text(family="Roboto", size=16, weight="bold"),
        axis_text_x=element_text(rotation=45, hjust=1),
        legend_position="right",
    )
)
display(p1)
p1.save(filename=join(charts_dir, "routes", "distance-traveled-bab.jpeg"), dpi=300)
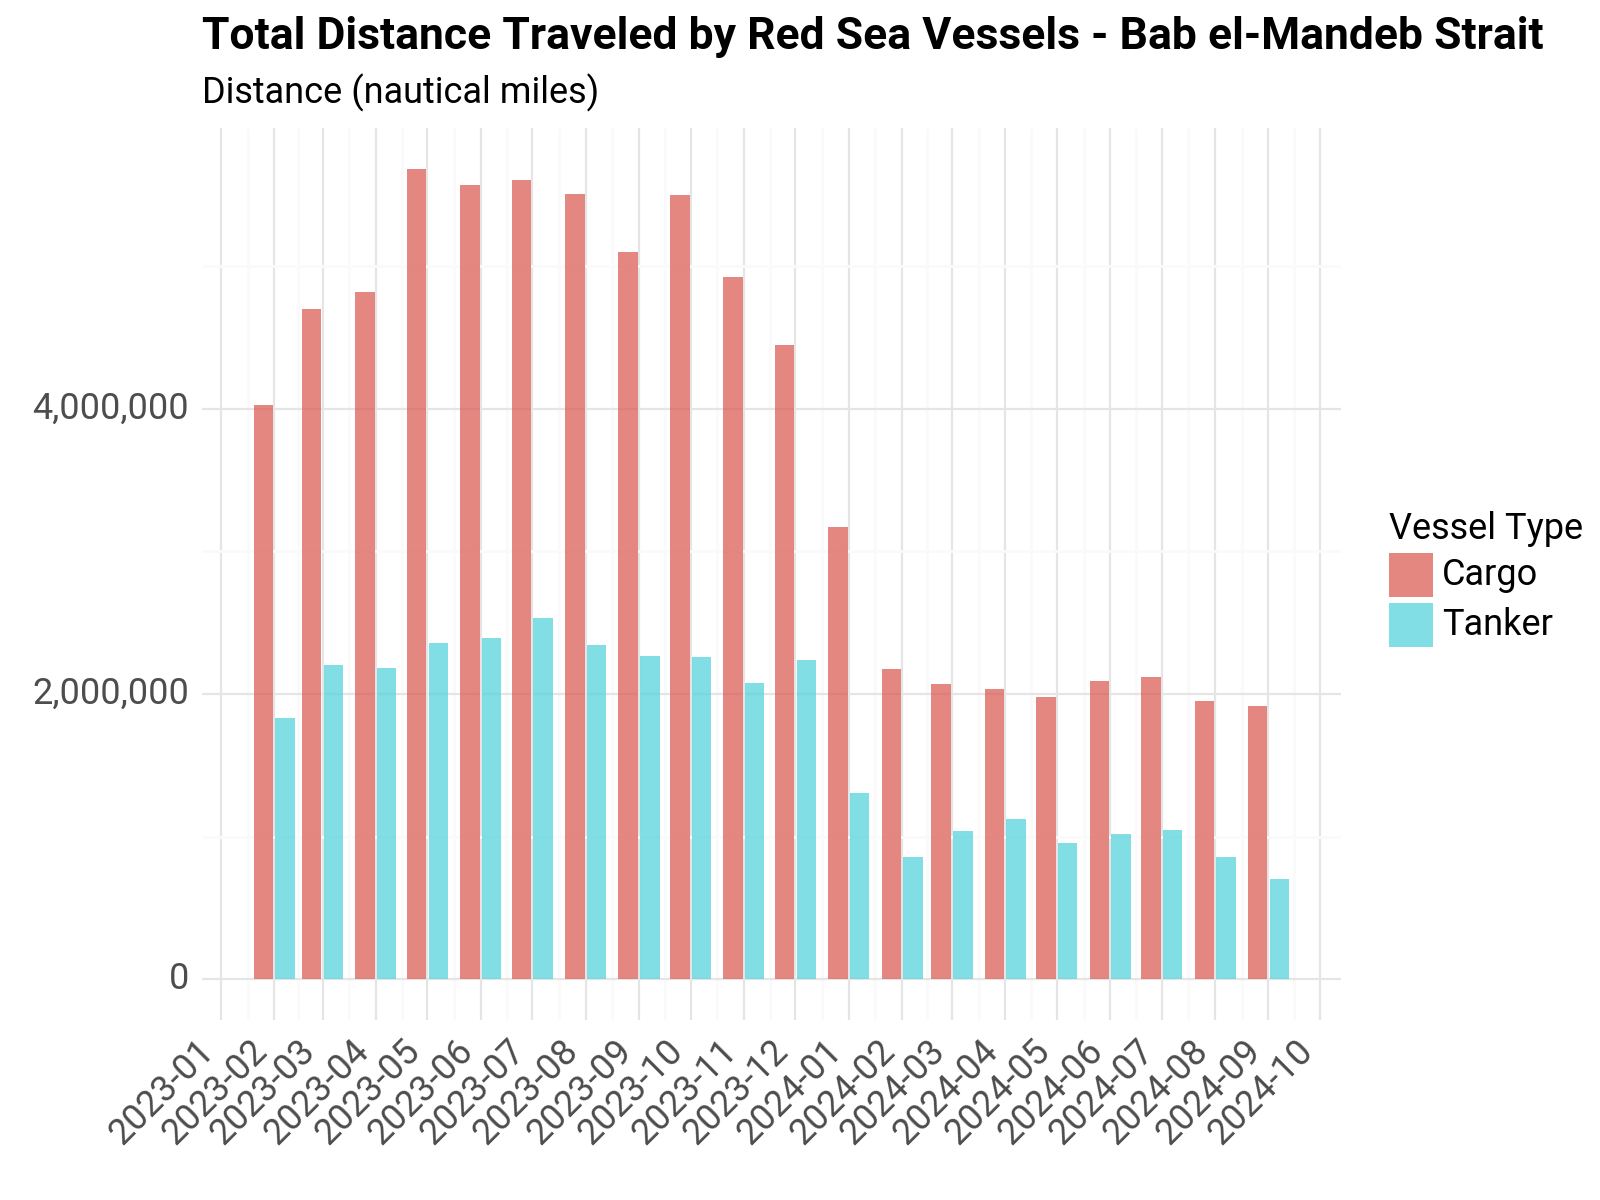
<Figure Size: (800 x 600)>
c:\WBG\Anaconda3\envs\rtmis\Lib\site-packages\plotnine\ggplot.py:587: PlotnineWarning: Saving 8 x 6 in image.
c:\WBG\Anaconda3\envs\rtmis\Lib\site-packages\plotnine\ggplot.py:588: PlotnineWarning: Filename: C:/Users/WB514197/Repos/red-sea-monitoring\reports\routes\distance-traveled-bab.jpeg
p3 = (
    ggplot(df_agg_cape, aes(x="ymd", y="distance", fill="vessel_type"))  #
    + geom_bar(
        alpha=3 / 4,
        stat="identity",
        position="dodge2",
    )
    + labs(
        x="",
        y="",
        subtitle="Distance (nautical miles)",
        fill="Vessel Type",
        title="Total Distance Traveled by Red Sea Vessels, Cape of Good Hope",
        # caption="This chart shows the monthly total distance traveled by a subset of vessels that were identified to cross the Red Sea in a reference period \n(January 2023 through October), and have crossed the Cape of Good Hope",
    )
    + theme_minimal()
    + scale_y_continuous(labels=comma_format())
    + scale_x_datetime(breaks=date_breaks("1 month"), labels=date_format("%Y-%m"))
    + theme(
        text=element_text(family="Roboto", size=13),
        plot_title=element_text(family="Roboto", size=16, weight="bold"),
        axis_text_x=element_text(rotation=45, hjust=1),
        legend_position="right",
    )
)
display(p3)
p3.save(filename=join(charts_dir, "routes", "distance-traveled-cape.jpeg"), dpi=300)
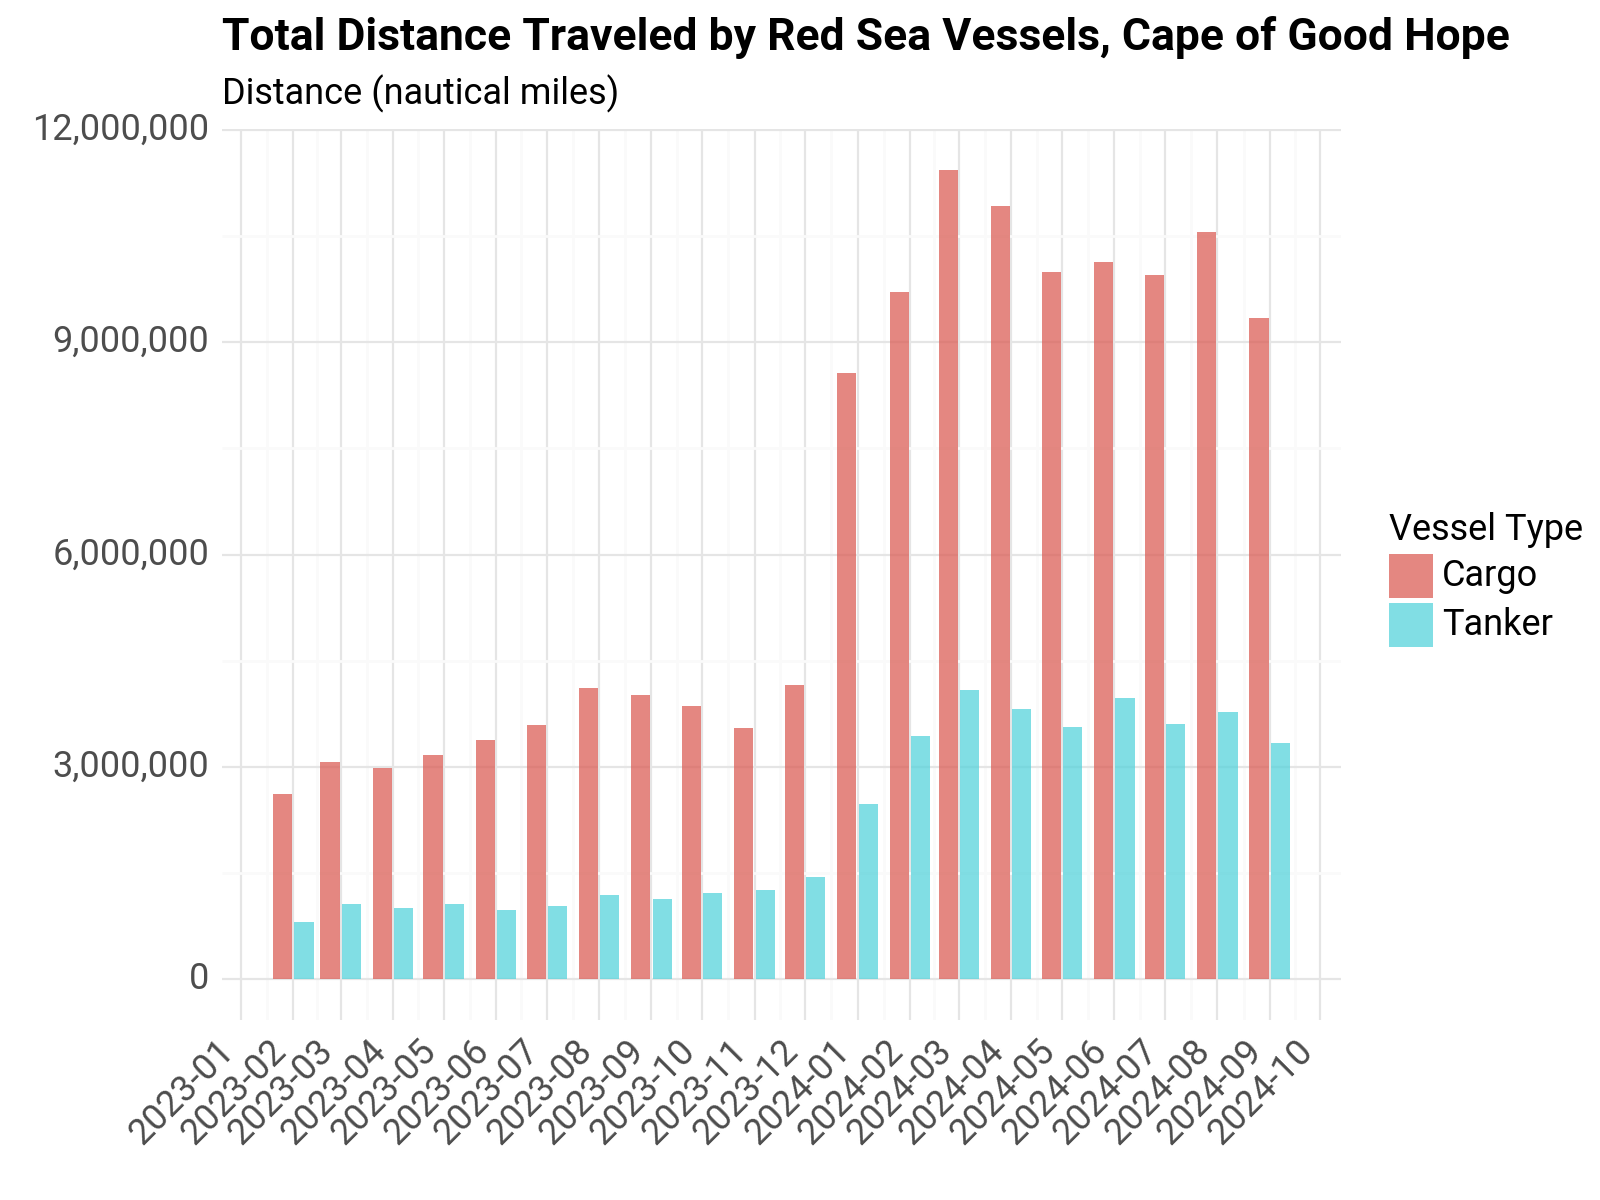
<Figure Size: (800 x 600)>
c:\WBG\Anaconda3\envs\rtmis\Lib\site-packages\plotnine\ggplot.py:587: PlotnineWarning: Saving 8 x 6 in image.
c:\WBG\Anaconda3\envs\rtmis\Lib\site-packages\plotnine\ggplot.py:588: PlotnineWarning: Filename: C:/Users/WB514197/Repos/red-sea-monitoring\reports\routes\distance-traveled-cape.jpeg
p4 = (
    ggplot(df_agg_horm, aes(x="ymd", y="distance", fill="vessel_type"))  #
    + geom_bar(
        alpha=3 / 4,
        stat="identity",
        position="dodge2",
    )
    + labs(
        x="",
        y="",
        subtitle="Distance (nautical miles)",
        fill="Vessel Type",
        title="Total Distance Traveled by Red Sea Vessels, Straight of Hormuz",
        # caption="This chart shows the monthly total distance traveled by a subset of vessels that were identified to cross the Red Sea in a reference period \n(January 2023 through October), and have crossed the Cape of Good Hope",
    )
    + theme_minimal()
    + scale_y_continuous(labels=comma_format())
    + scale_x_datetime(breaks=date_breaks("1 month"), labels=date_format("%Y-%m"))
    + theme(
        text=element_text(family="Roboto", size=13),
        plot_title=element_text(family="Roboto", size=16, weight="bold"),
        axis_text_x=element_text(rotation=45, hjust=1),
        legend_position="right",
    )
)
# display(p4)
p4.save(filename=join(charts_dir, "routes", "distance-traveled-horm.jpeg"), dpi=300)
c:\WBG\Anaconda3\envs\rtmis\Lib\site-packages\plotnine\ggplot.py:587: PlotnineWarning: Saving 8 x 6 in image.
c:\WBG\Anaconda3\envs\rtmis\Lib\site-packages\plotnine\ggplot.py:588: PlotnineWarning: Filename: C:/Users/WB514197/Repos/red-sea-monitoring\reports\routes\distance-traveled-horm.jpeg
charts_dir
'C:/Users/WB514197/Repos/red-sea-monitoring\\reports'
p0 = (
    ggplot(df_agg, aes(x="ymd", y="emissions", fill="vessel_type"))  #
    + geom_bar(
        alpha=3 / 4,
        stat="identity",
        position="dodge2",
    )
    + labs(
        x="",
        y="",
        subtitle="Metric Tons",
        title="CO2 Emissions, Red Sea Vessels",
        # caption="This chart shows the monthly total distance traveled by a subset of vessels that were identified to cross the Red Sea in a reference period \n(January 2023 through October), and have either crossed the Bab el-Mandeb Strait or the Cape of Good Hope in the period of interest.",
        fill="Vessel Type",
    )
    + theme_minimal()
    # + scale_y_continuous(labels=metric_tons_formatter)
    + scale_y_continuous(labels=comma_format())
    # + scale_y_continuous(labels = unit_format(unit = "M", scale = 1e-6))
    + scale_x_datetime(breaks=date_breaks("2 month"), labels=date_format("%Y-%m"))
    + theme(
        text=element_text(family="Roboto", size=12),
        plot_title=element_text(family="Roboto", size=16, weight="bold"),
        axis_text_x=element_text(rotation=45),  # , hjust=1
        legend_position="bottom",
    )
)
# display(p0)
p0.save(filename=join(charts_dir, "routes", "emissions-red-sea.jpeg"), dpi=300)
c:\WBG\Anaconda3\envs\rtmis\Lib\site-packages\plotnine\ggplot.py:587: PlotnineWarning: Saving 8 x 6 in image.
c:\WBG\Anaconda3\envs\rtmis\Lib\site-packages\plotnine\ggplot.py:588: PlotnineWarning: Filename: C:/Users/WB514197/Repos/red-sea-monitoring\reports\routes\emissions-red-sea.jpeg
p0 = (
    ggplot(df_agg_cape, aes(x="ymd", y="emissions", fill="vessel_type"))  #
    + geom_bar(
        alpha=3 / 4,
        stat="identity",
        position="dodge2",
    )
    + labs(
        x="",
        y="",
        subtitle="Metric Tons",
        title="CO2 Emissions, Red Sea Vessels Crossing Cape of Good Hope",
        # caption="This chart shows the monthly total distance traveled by a subset of vessels that were identified to cross the Red Sea in a reference period \n(January 2023 through October), and have either crossed the Bab el-Mandeb Strait or the Cape of Good Hope in the period of interest.",
        fill="Vessel Type",
    )
    + theme_minimal()
    # + scale_y_continuous(labels=metric_tons_formatter)
    + scale_y_continuous(labels=comma_format())
    # + scale_y_continuous(labels = unit_format(unit = "M", scale = 1e-6))
    + scale_x_datetime(breaks=date_breaks("2 month"), labels=date_format("%Y-%m"))
    + theme(
        text=element_text(family="Roboto", size=12),
        plot_title=element_text(family="Roboto", size=16, weight="bold"),
        axis_text_x=element_text(rotation=45),  # , hjust=1
        legend_position="bottom",
    )
)
# display(p0)
p0.save(filename=join(charts_dir, "routes", "emissions-cape.jpeg"), dpi=300)
c:\WBG\Anaconda3\envs\rtmis\Lib\site-packages\plotnine\ggplot.py:587: PlotnineWarning: Saving 8 x 6 in image.
c:\WBG\Anaconda3\envs\rtmis\Lib\site-packages\plotnine\ggplot.py:588: PlotnineWarning: Filename: C:/Users/WB514197/Repos/red-sea-monitoring\reports\routes\emissions-cape.jpeg
Data Table#
group_cols = [
    "year",
    "month",
    "vessel_type",
    "Country",
    "Port",
    "prev_country",
    "prev_port",
]
data_cols = ["time_travel", "distance"]
df_agg_od = (
    df3.groupby(group_cols)
    .aggregate({"time_travel": "sum", "distance": "sum", "unique_id": "count"})
    .reset_index()
)
df_agg_od.rename(
    columns={
        "unique_id": "No. of Vessels",
        "prev_port": "Previous Port",
        "prev_country": "Previous Country",
        "vessel_type": "Vessel Type",
        "time_travel": "Total travel time (hrs.)",
        "distance": "Total distance (n. miles)",
        "count_routes": "No. of Vessels",
    },
    inplace=True,
)
df_agg_od = df_agg_od[
    [
        "year",
        "month",
        "Vessel Type",
        "Previous Port",
        "Previous Country",
        "Country",
        "Port",
        "Total travel time (hrs.)",
        "Total distance (n. miles)",
        "No. of Vessels",
    ]
].copy()
df_agg_od.head()
| year | month | Vessel Type | Previous Port | Previous Country | Country | Port | Total travel time (hrs.) | Total distance (n. miles) | No. of Vessels | |
|---|---|---|---|---|---|---|---|---|---|---|
| 0 | 2023 | 2 | Cargo | Cape of Good Hope | Chokepoint Cape of Good Hope | Angola | Luanda | 338.479167 | 4844.855522 | 3 |
| 1 | 2023 | 2 | Cargo | Cape of Good Hope | Chokepoint Cape of Good Hope | Argentina | Campana | 1284.538333 | 7714.825095 | 2 |
| 2 | 2023 | 2 | Cargo | Cape of Good Hope | Chokepoint Cape of Good Hope | Argentina | Puerto Ingeniero White | 435.671389 | 4088.880729 | 1 |
| 3 | 2023 | 2 | Cargo | Cape of Good Hope | Chokepoint Cape of Good Hope | Argentina | Rosario | 2431.078889 | 23688.201240 | 6 |
| 4 | 2023 | 2 | Cargo | Cape of Good Hope | Chokepoint Cape of Good Hope | Argentina | San Nicolas | 915.360000 | 7878.375107 | 2 |
print(df_agg_od.head().to_markdown())
|    |   year |   month | Vessel Type   | Previous Port     | Previous Country             | Country   | Port                   |   Total travel time (hrs.) |   Total distance (n. miles) |   No. of Vessels |
|---:|-------:|--------:|:--------------|:------------------|:-----------------------------|:----------|:-----------------------|---------------------------:|----------------------------:|-----------------:|
|  0 |   2023 |       2 | Cargo         | Cape of Good Hope | Chokepoint Cape of Good Hope | Angola    | Luanda                 |                    338.479 |                     4844.86 |                3 |
|  1 |   2023 |       2 | Cargo         | Cape of Good Hope | Chokepoint Cape of Good Hope | Argentina | Campana                |                   1284.54  |                     7714.83 |                2 |
|  2 |   2023 |       2 | Cargo         | Cape of Good Hope | Chokepoint Cape of Good Hope | Argentina | Puerto Ingeniero White |                    435.671 |                     4088.88 |                1 |
|  3 |   2023 |       2 | Cargo         | Cape of Good Hope | Chokepoint Cape of Good Hope | Argentina | Rosario                |                   2431.08  |                    23688.2  |                6 |
|  4 |   2023 |       2 | Cargo         | Cape of Good Hope | Chokepoint Cape of Good Hope | Argentina | San Nicolas            |                    915.36  |                     7878.38 |                2 |
df_agg_od.to_csv(
    join(output_dir, "tables", "red-sea-distance-summary-10-03-2024.csv"), index=False
)
Calculate % Change from Baseline#
conflict_date = "2023-10-07"
crisis_date = "2023-11-17"
df_baseline = df_agg.loc[df_agg.ymd < "2023-10-01"].copy()
df_baseline = df_baseline.groupby(["vessel_type"])[["time_travel", "distance"]].mean()
df_baseline.reset_index(inplace=True)
df_baseline.rename(
    columns={"time_travel": "time_travel_ref", "distance": "distance_ref"}, inplace=True
)
df_crisis = df_agg.loc[df_agg.ymd >= "2023-10-01"].copy()
df_crisis = df_crisis.merge(df_baseline, on="vessel_type", how="left")
df_crisis.loc[:, "distance_pct"] = (
    df_crisis.distance - df_crisis.distance_ref
) / df_crisis.distance_ref
df_crisis.loc[:, "time_pct"] = (
    df_crisis.time_travel - df_crisis.time_travel_ref
) / df_crisis.time_travel_ref
# df_crisis = df_crisis.loc[df_crisis.ymd>='2024-01-01'].copy()
p4 = (
    ggplot(df_crisis, aes(x="ymd", y="distance_pct", fill="vessel_type"))  #
    + geom_bar(
        alpha=3 / 4,
        stat="identity",
        position="dodge2",
    )
    + labs(
        x="",
        y="",
        subtitle="% Change",
        fill="Vessel Type",
        title="Distance Traveled by Red Sea Vessels, % Change from Baseline (Jan 2023 - Sep 2023)",
        # caption="This chart shows the monthly total distance traveled by a subset of vessels that were identified to cross the Red Sea in a reference period \n(January 2023 through October), and have crossed the Cape of Good Hope",
    )
    + theme_minimal()
    + scale_y_continuous(labels=percent_format(), limits=(-0.1, 0.6))
    + scale_x_datetime(breaks=date_breaks("1 month"), labels=date_format("%Y-%m"))
    + theme(
        text=element_text(family="Roboto", size=13),
        plot_title=element_text(family="Roboto", size=16, weight="bold"),
        axis_text_x=element_text(rotation=45, hjust=1),
        legend_position="right",
    )
)
display(p4)
p4.save(filename=join(charts_dir, "routes", "distance-traveled-pct.jpeg"), dpi=300)
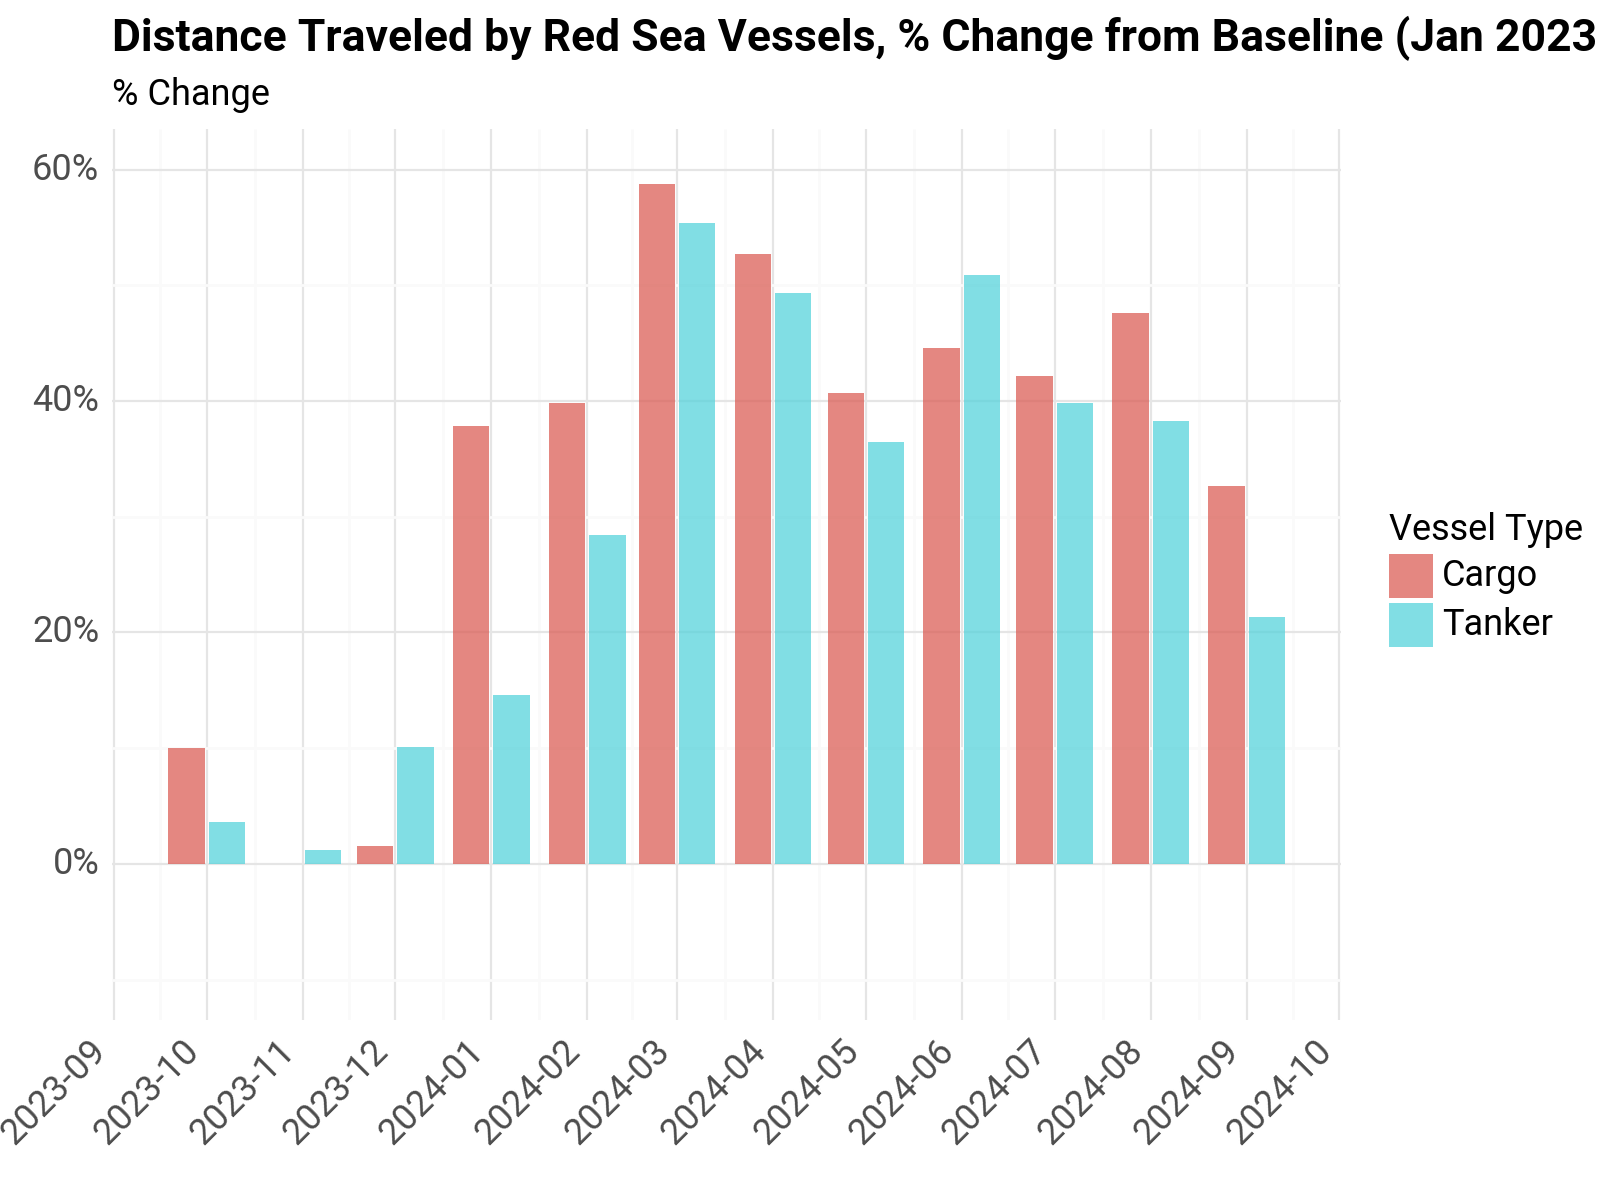
<Figure Size: (800 x 600)>
c:\WBG\Anaconda3\envs\rtmis\Lib\site-packages\plotnine\ggplot.py:587: PlotnineWarning: Saving 8 x 6 in image.
c:\WBG\Anaconda3\envs\rtmis\Lib\site-packages\plotnine\ggplot.py:588: PlotnineWarning: Filename: C:/Users/WB514197/Repos/red-sea-monitoring\reports\routes\distance-traveled-pct.jpeg
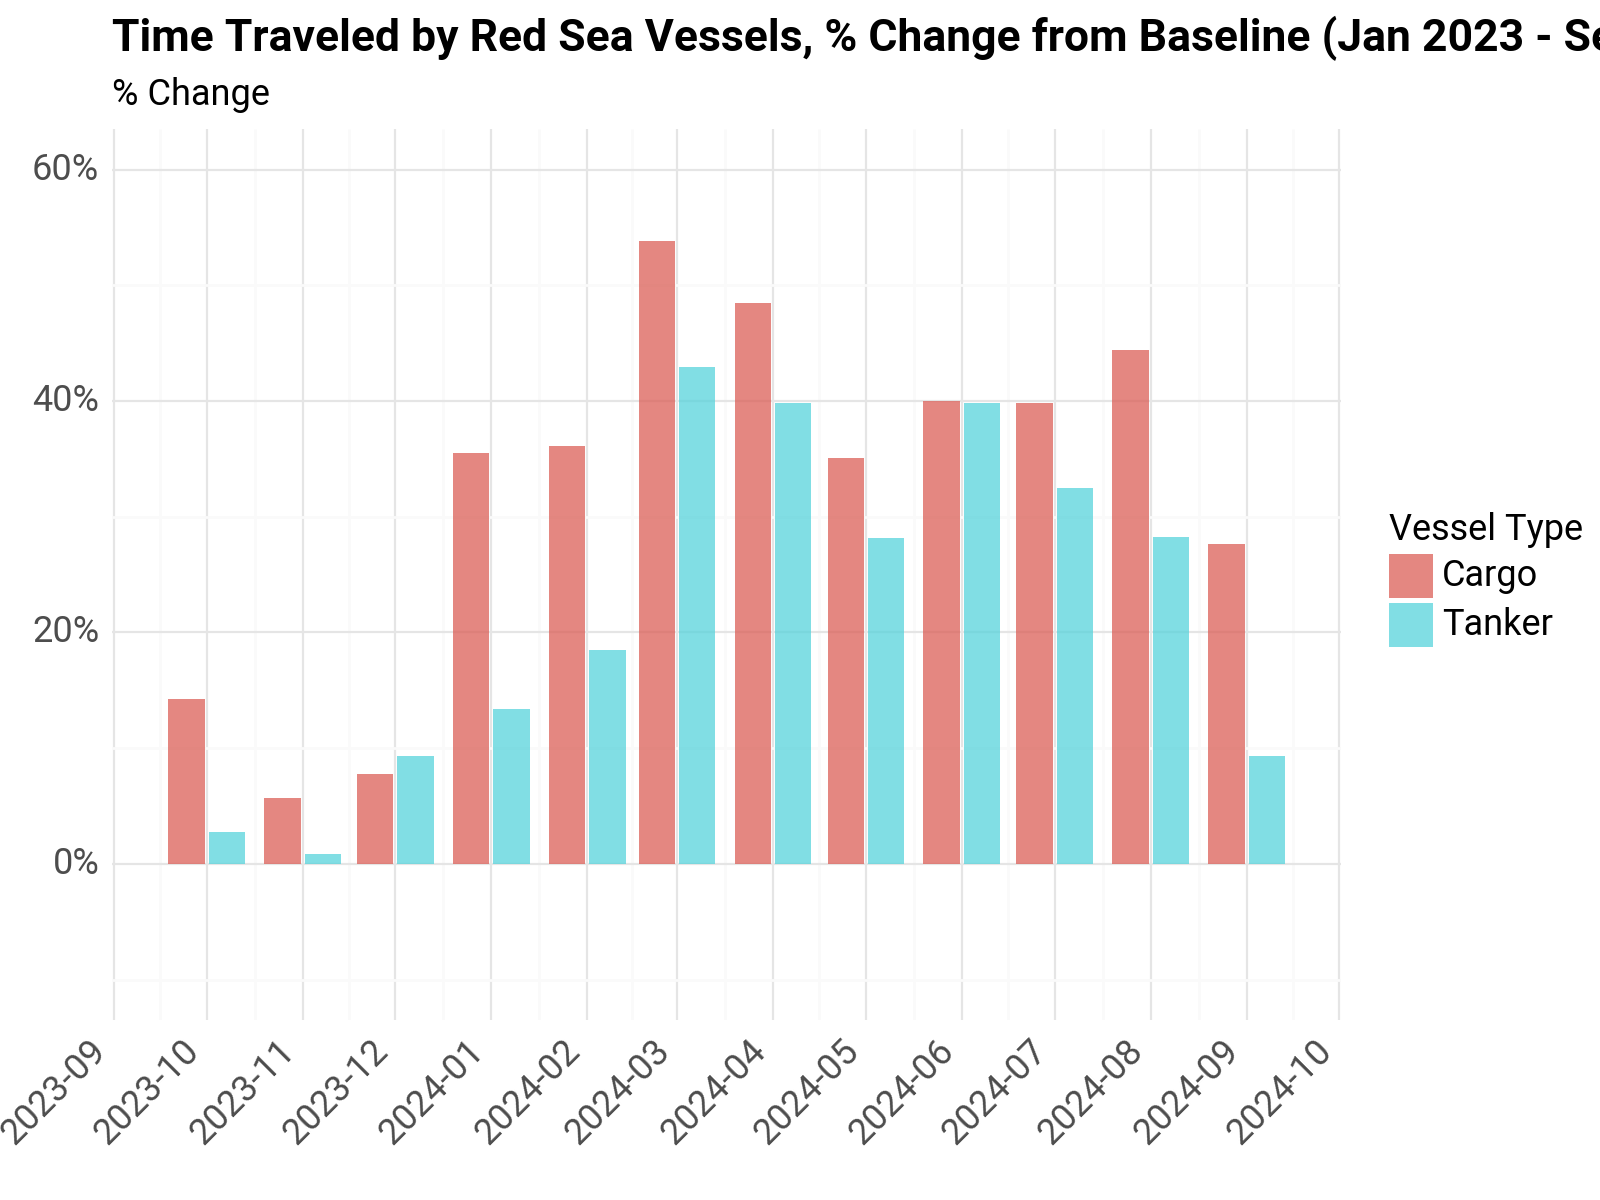
p5 = (
    ggplot(df_crisis, aes(x="ymd", y="time_pct", fill="vessel_type"))  #
    + geom_bar(
        alpha=3 / 4,
        stat="identity",
        position="dodge2",
    )
    + labs(
        x="",
        y="",
        subtitle="% Change",
        fill="Vessel Type",
        title="Time Traveled by Red Sea Vessels, % Change from Baseline (Jan 2023 - Sep 2023)",
        # caption="This chart shows the monthly total distance traveled by a subset of vessels that were identified to cross the Red Sea in a reference period \n(January 2023 through October), and have crossed the Cape of Good Hope",
    )
    + theme_minimal()
    + scale_y_continuous(labels=percent_format(), limits=(-0.1, 0.6))
    + scale_x_datetime(breaks=date_breaks("1 month"), labels=date_format("%Y-%m"))
    + theme(
        text=element_text(family="Roboto", size=13),
        plot_title=element_text(family="Roboto", size=16, weight="bold"),
        axis_text_x=element_text(rotation=45, hjust=1),
        legend_position="right",
    )
)
display(p5)
p5.save(filename=join(charts_dir, "routes", "time-traveled-pct.jpeg"), dpi=300)
<Figure Size: (800 x 600)>
c:\WBG\Anaconda3\envs\rtmis\Lib\site-packages\plotnine\ggplot.py:587: PlotnineWarning: Saving 8 x 6 in image.
c:\WBG\Anaconda3\envs\rtmis\Lib\site-packages\plotnine\ggplot.py:588: PlotnineWarning: Filename: C:/Users/WB514197/Repos/red-sea-monitoring\reports\routes\time-traveled-pct.jpeg
df_crisis_sel = df_crisis.loc[df_crisis.ymd >= "2024-01-01"].copy()
df_crisis_sel.ymd
6    2024-01-01
7    2024-01-01
8    2024-02-01
9    2024-02-01
10   2024-03-01
11   2024-03-01
12   2024-04-01
13   2024-04-01
14   2024-05-01
15   2024-05-01
16   2024-06-01
17   2024-06-01
18   2024-07-01
19   2024-07-01
20   2024-08-01
21   2024-08-01
22   2024-09-01
23   2024-09-01
Name: ymd, dtype: datetime64[ns]
df_crisis_sel.loc[:, "year_month"] = df_crisis_sel.ymd.dt.strftime("%Y-%m")
pct_table = df_crisis_sel.groupby(["year_month", "vessel_type"])[
    ["distance_pct", "time_pct"]
].mean()  # .transpose()
pct_table.reset_index(inplace=True)
cargo_table = pct_table.loc[pct_table.vessel_type == "Cargo"].copy()
tanker_table = pct_table.loc[pct_table.vessel_type == "Tanker"].copy()

cargo_table.drop(columns=["vessel_type"], inplace=True)
tanker_table.drop(columns=["vessel_type"], inplace=True)
cargo_table.set_index("year_month", inplace=True)
tanker_table.set_index("year_month", inplace=True)

cargo_table = cargo_table.transpose()
tanker_table = tanker_table.transpose()
cargo_table.index = ["% Change Distance Travel", "% Change Time Travel"]
tanker_table.index = ["% Change Distance Travel", "% Change Time Travel"]
cargo_table = cargo_table.applymap(lambda x: f"{x:.1%}")
tanker_table = tanker_table.applymap(lambda x: f"{x:.1%}")
C:\Users\WB514197\AppData\Local\Temp\ipykernel_12956\1012980847.py:1: FutureWarning: DataFrame.applymap has been deprecated. Use DataFrame.map instead.
C:\Users\WB514197\AppData\Local\Temp\ipykernel_12956\1012980847.py:2: FutureWarning: DataFrame.applymap has been deprecated. Use DataFrame.map instead.
print(cargo_table.to_markdown())
|                          | 2024-01   | 2024-02   | 2024-03   | 2024-04   | 2024-05   | 2024-06   | 2024-07   | 2024-08   | 2024-09   |
|:-------------------------|:----------|:----------|:----------|:----------|:----------|:----------|:----------|:----------|:----------|
| % Change Distance Travel | 37.8%     | 39.8%     | 58.8%     | 52.7%     | 40.7%     | 44.6%     | 42.2%     | 47.6%     | 32.7%     |
| % Change Time Travel     | 35.5%     | 36.1%     | 53.8%     | 48.5%     | 35.1%     | 40.0%     | 39.8%     | 44.4%     | 27.7%     |
print(tanker_table.to_markdown())
|                          | 2024-01   | 2024-02   | 2024-03   | 2024-04   | 2024-05   | 2024-06   | 2024-07   | 2024-08   | 2024-09   |
|:-------------------------|:----------|:----------|:----------|:----------|:----------|:----------|:----------|:----------|:----------|
| % Change Distance Travel | 14.6%     | 28.4%     | 55.4%     | 49.4%     | 36.5%     | 50.9%     | 39.8%     | 38.2%     | 21.3%     |
| % Change Time Travel     | 13.4%     | 18.5%     | 43.0%     | 39.8%     | 28.1%     | 39.9%     | 32.4%     | 28.3%     | 9.4%      |
OECD Data#
# df = pd.read_csv(join(expanduser("~"), 'tmp', 'ais', 'OECD.SDD.NAD.SEEA,DSD_MARITIME_TRANSPORT@DF_MARITIME_TRANSPORT,1.0+all.csv'))
df = pd.read_csv(
    join(
        expanduser("~"),
        "tmp",
        "ais",
        "OECD.SDD.NAD.SEEA,DSD_MARITIME_TRANSPORT@DF_MARITIME_TRANSPORT,1.0+.M.EMISSIONS.....ALL_VESSELS_10-03-2024.csv",
    )
)  # latest
df.Vessel.value_counts()
Vessel
All vessels    3423
Name: count, dtype: int64
df = df.loc[df.FREQ == "M"].copy()
drop_areas = ["W", "OECD", "W_O"]
df = df.loc[~df.REF_AREA.isin(drop_areas)].copy()
df = df[["TIME_PERIOD", "OBS_VALUE", "REF_AREA", "Vessel"]].copy()
df.loc[:, "ymd"] = pd.to_datetime(df["TIME_PERIOD"])
df = df.loc[df.ymd > "2022-01-01"].copy()
df.groupby("REF_AREA").size()
REF_AREA
AGO    29
ALB    29
ARE    29
ARG    29
ATG    15
       ..
VIR    18
VNM    29
VUT    29
WSM    29
ZAF    29
Length: 116, dtype: int64
df = df.groupby(["TIME_PERIOD", "ymd"])["OBS_VALUE"].sum().reset_index().copy()
df.loc[:, "year_month"] = df.ymd.dt.strftime("%Y-%m")
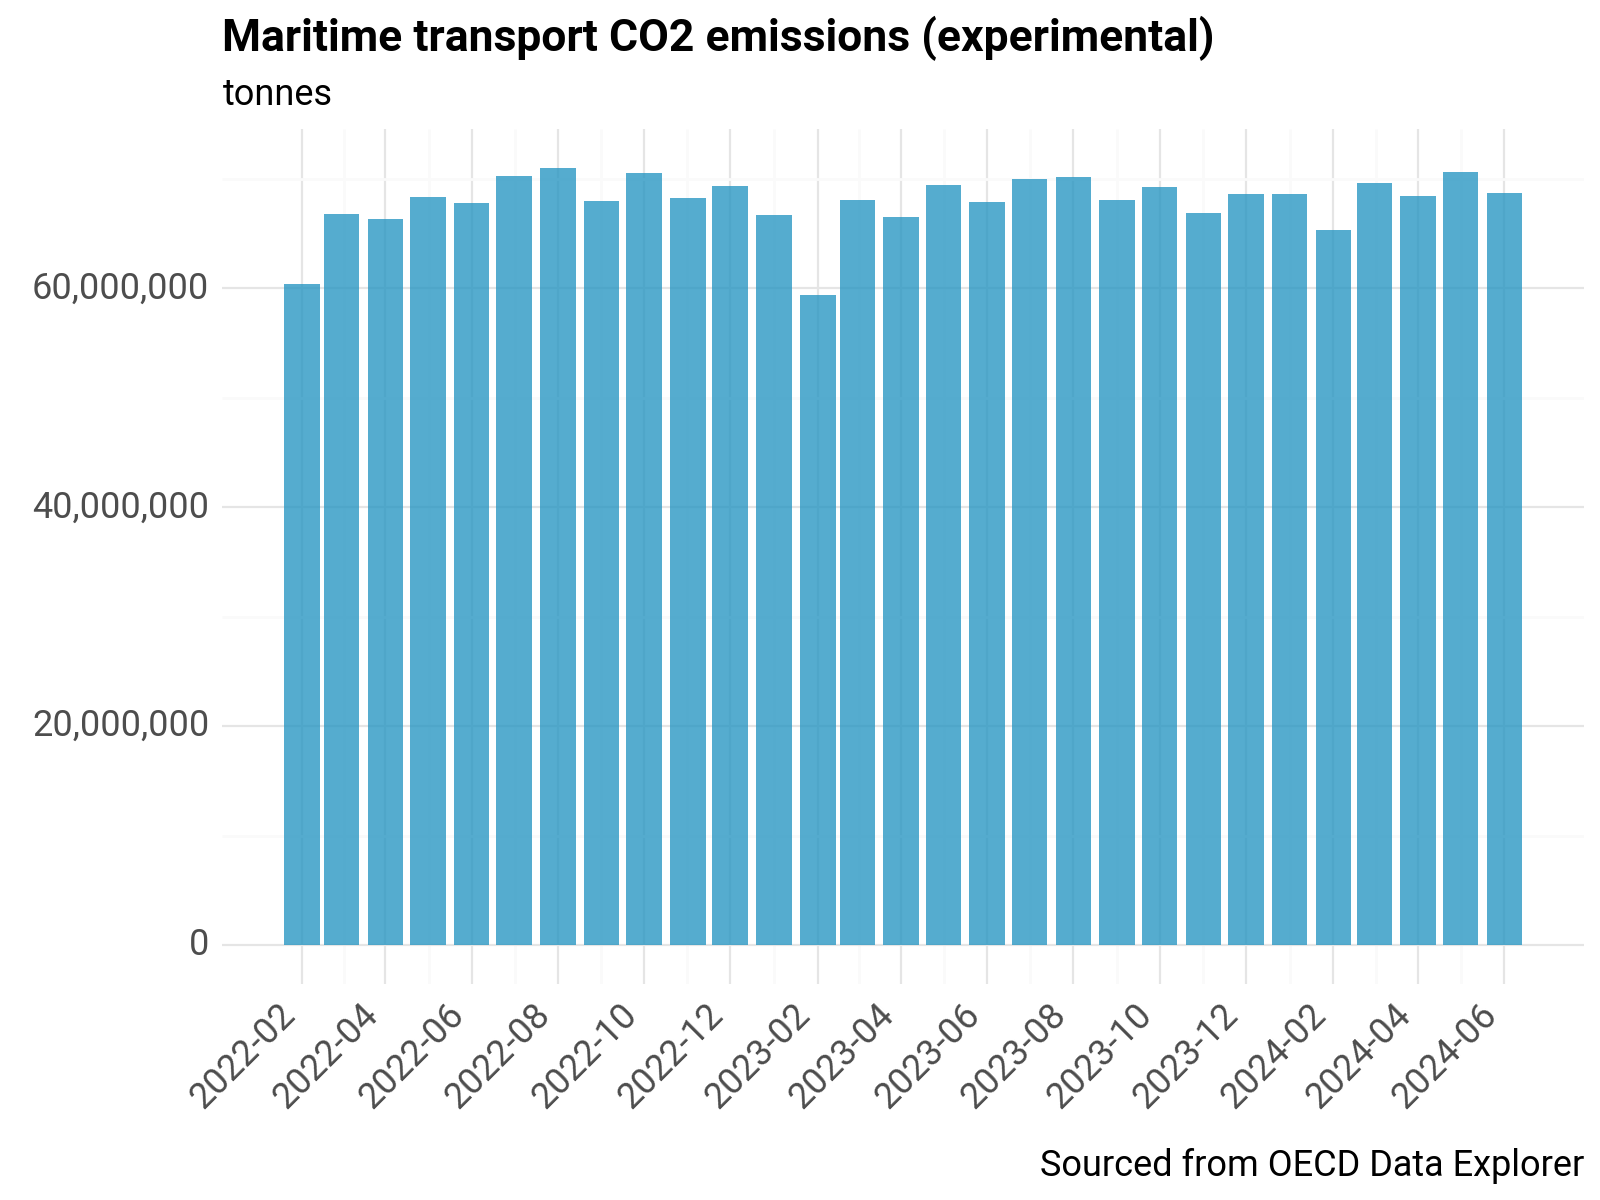
p0 = (
    ggplot(df, aes(x="ymd", y="OBS_VALUE"))  #
    + geom_bar(alpha=3 / 4, stat="identity", fill="#1d91c0")
    + labs(
        x="",
        y="",
        subtitle="tonnes",
        title="Maritime transport CO2 emissions (experimental)",
        caption="Sourced from OECD Data Explorer",
    )
    + theme_minimal()
    + scale_y_continuous(labels=comma_format())
    + scale_x_datetime(breaks=date_breaks("2 month"), labels=date_format("%Y-%m"))
    + theme(
        text=element_text(family="Roboto", size=13),
        plot_title=element_text(family="Roboto", size=16, weight="bold"),
        axis_text_x=element_text(rotation=45, hjust=1),
        legend_position="none",
    )
)
display(p0)
p0.save(filename=join(charts_dir, "routes", "oecd-historical.jpeg"), dpi=300)
<Figure Size: (800 x 600)>
c:\WBG\Anaconda3\envs\rtmis\Lib\site-packages\plotnine\ggplot.py:587: PlotnineWarning: Saving 8 x 6 in image.
c:\WBG\Anaconda3\envs\rtmis\Lib\site-packages\plotnine\ggplot.py:588: PlotnineWarning: Filename: C:/Users/WB514197/Repos/red-sea-monitoring\reports\routes\oecd-historical.jpeg
df_filt = df.loc[df.ymd > "2023-01-01"].copy()
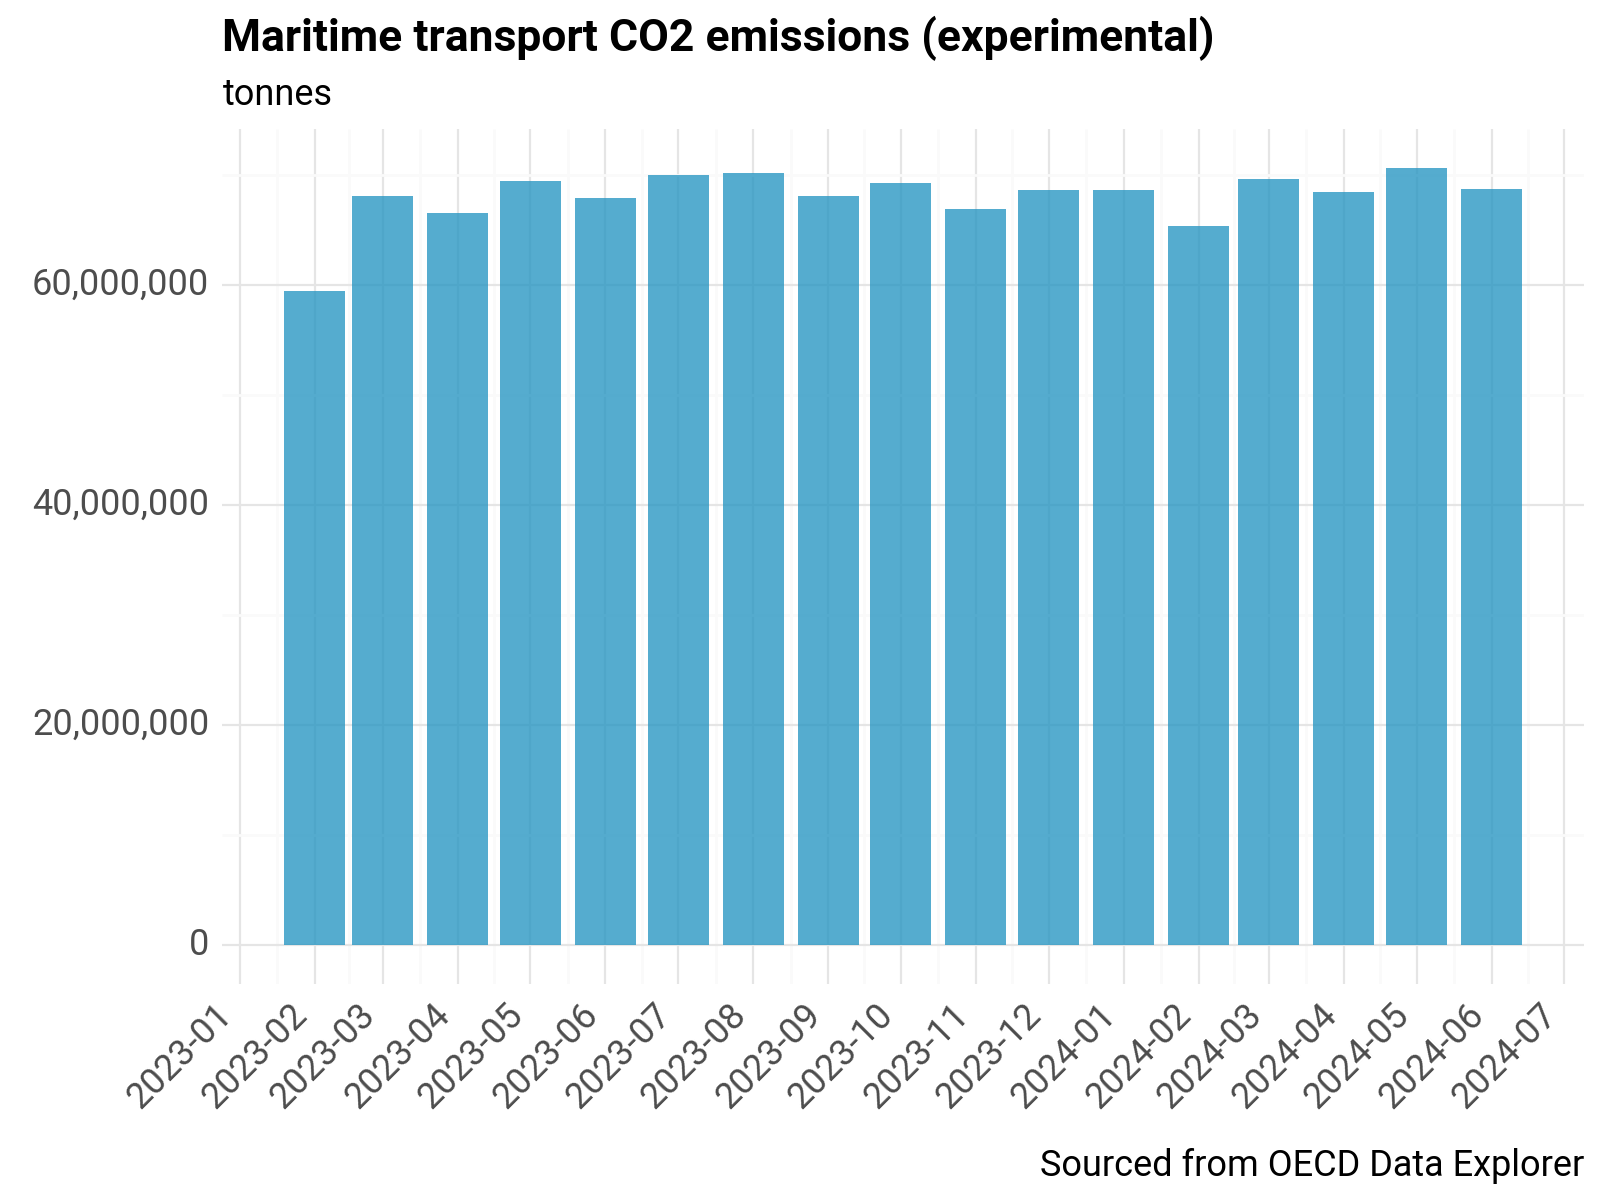
p0 = (
    ggplot(df_filt, aes(x="ymd", y="OBS_VALUE"))  #
    + geom_bar(alpha=3 / 4, stat="identity", fill="#1d91c0")
    + labs(
        x="",
        y="",
        subtitle="tonnes",
        title="Maritime transport CO2 emissions (experimental)",
        caption="Sourced from OECD Data Explorer",
    )
    + theme_minimal()
    + scale_y_continuous(labels=comma_format())
    + scale_x_datetime(breaks=date_breaks("1 month"), labels=date_format("%Y-%m"))
    + theme(
        text=element_text(family="Roboto", size=13),
        plot_title=element_text(family="Roboto", size=16, weight="bold"),
        axis_text_x=element_text(rotation=45, hjust=1),
        legend_position="none",
    )
)
display(p0)
p0.save(filename=join(charts_dir, "routes", "oecd.jpeg"), dpi=300)
<Figure Size: (800 x 600)>
c:\WBG\Anaconda3\envs\rtmis\Lib\site-packages\plotnine\ggplot.py:587: PlotnineWarning: Saving 8 x 6 in image.
c:\WBG\Anaconda3\envs\rtmis\Lib\site-packages\plotnine\ggplot.py:588: PlotnineWarning: Filename: C:/Users/WB514197/Repos/red-sea-monitoring\reports\routes\oecd.jpeg

