Maritime Choke Point Trends Monitor#
This section examines how AIS transit calls have evolved in specific crossing locations, also referred to as “choke points”, given the conflict in the Middle East and the escalating attacks in the Red Sea.
Data#
AIS Statistics#
We process daily transit calls and estimated volume (capactiy) since 2019 from the IMF’s PortWatch platform for key areas of interest: Bab el-Mandeb Strait, Cape of Good Hope, Suez Canal. As of this date, the latest data point available is February 19th, 2024.
Since the data is daily, we first conduct a 7-day moving average to smoothen out the data and mitigate the effect of daily anomalies.
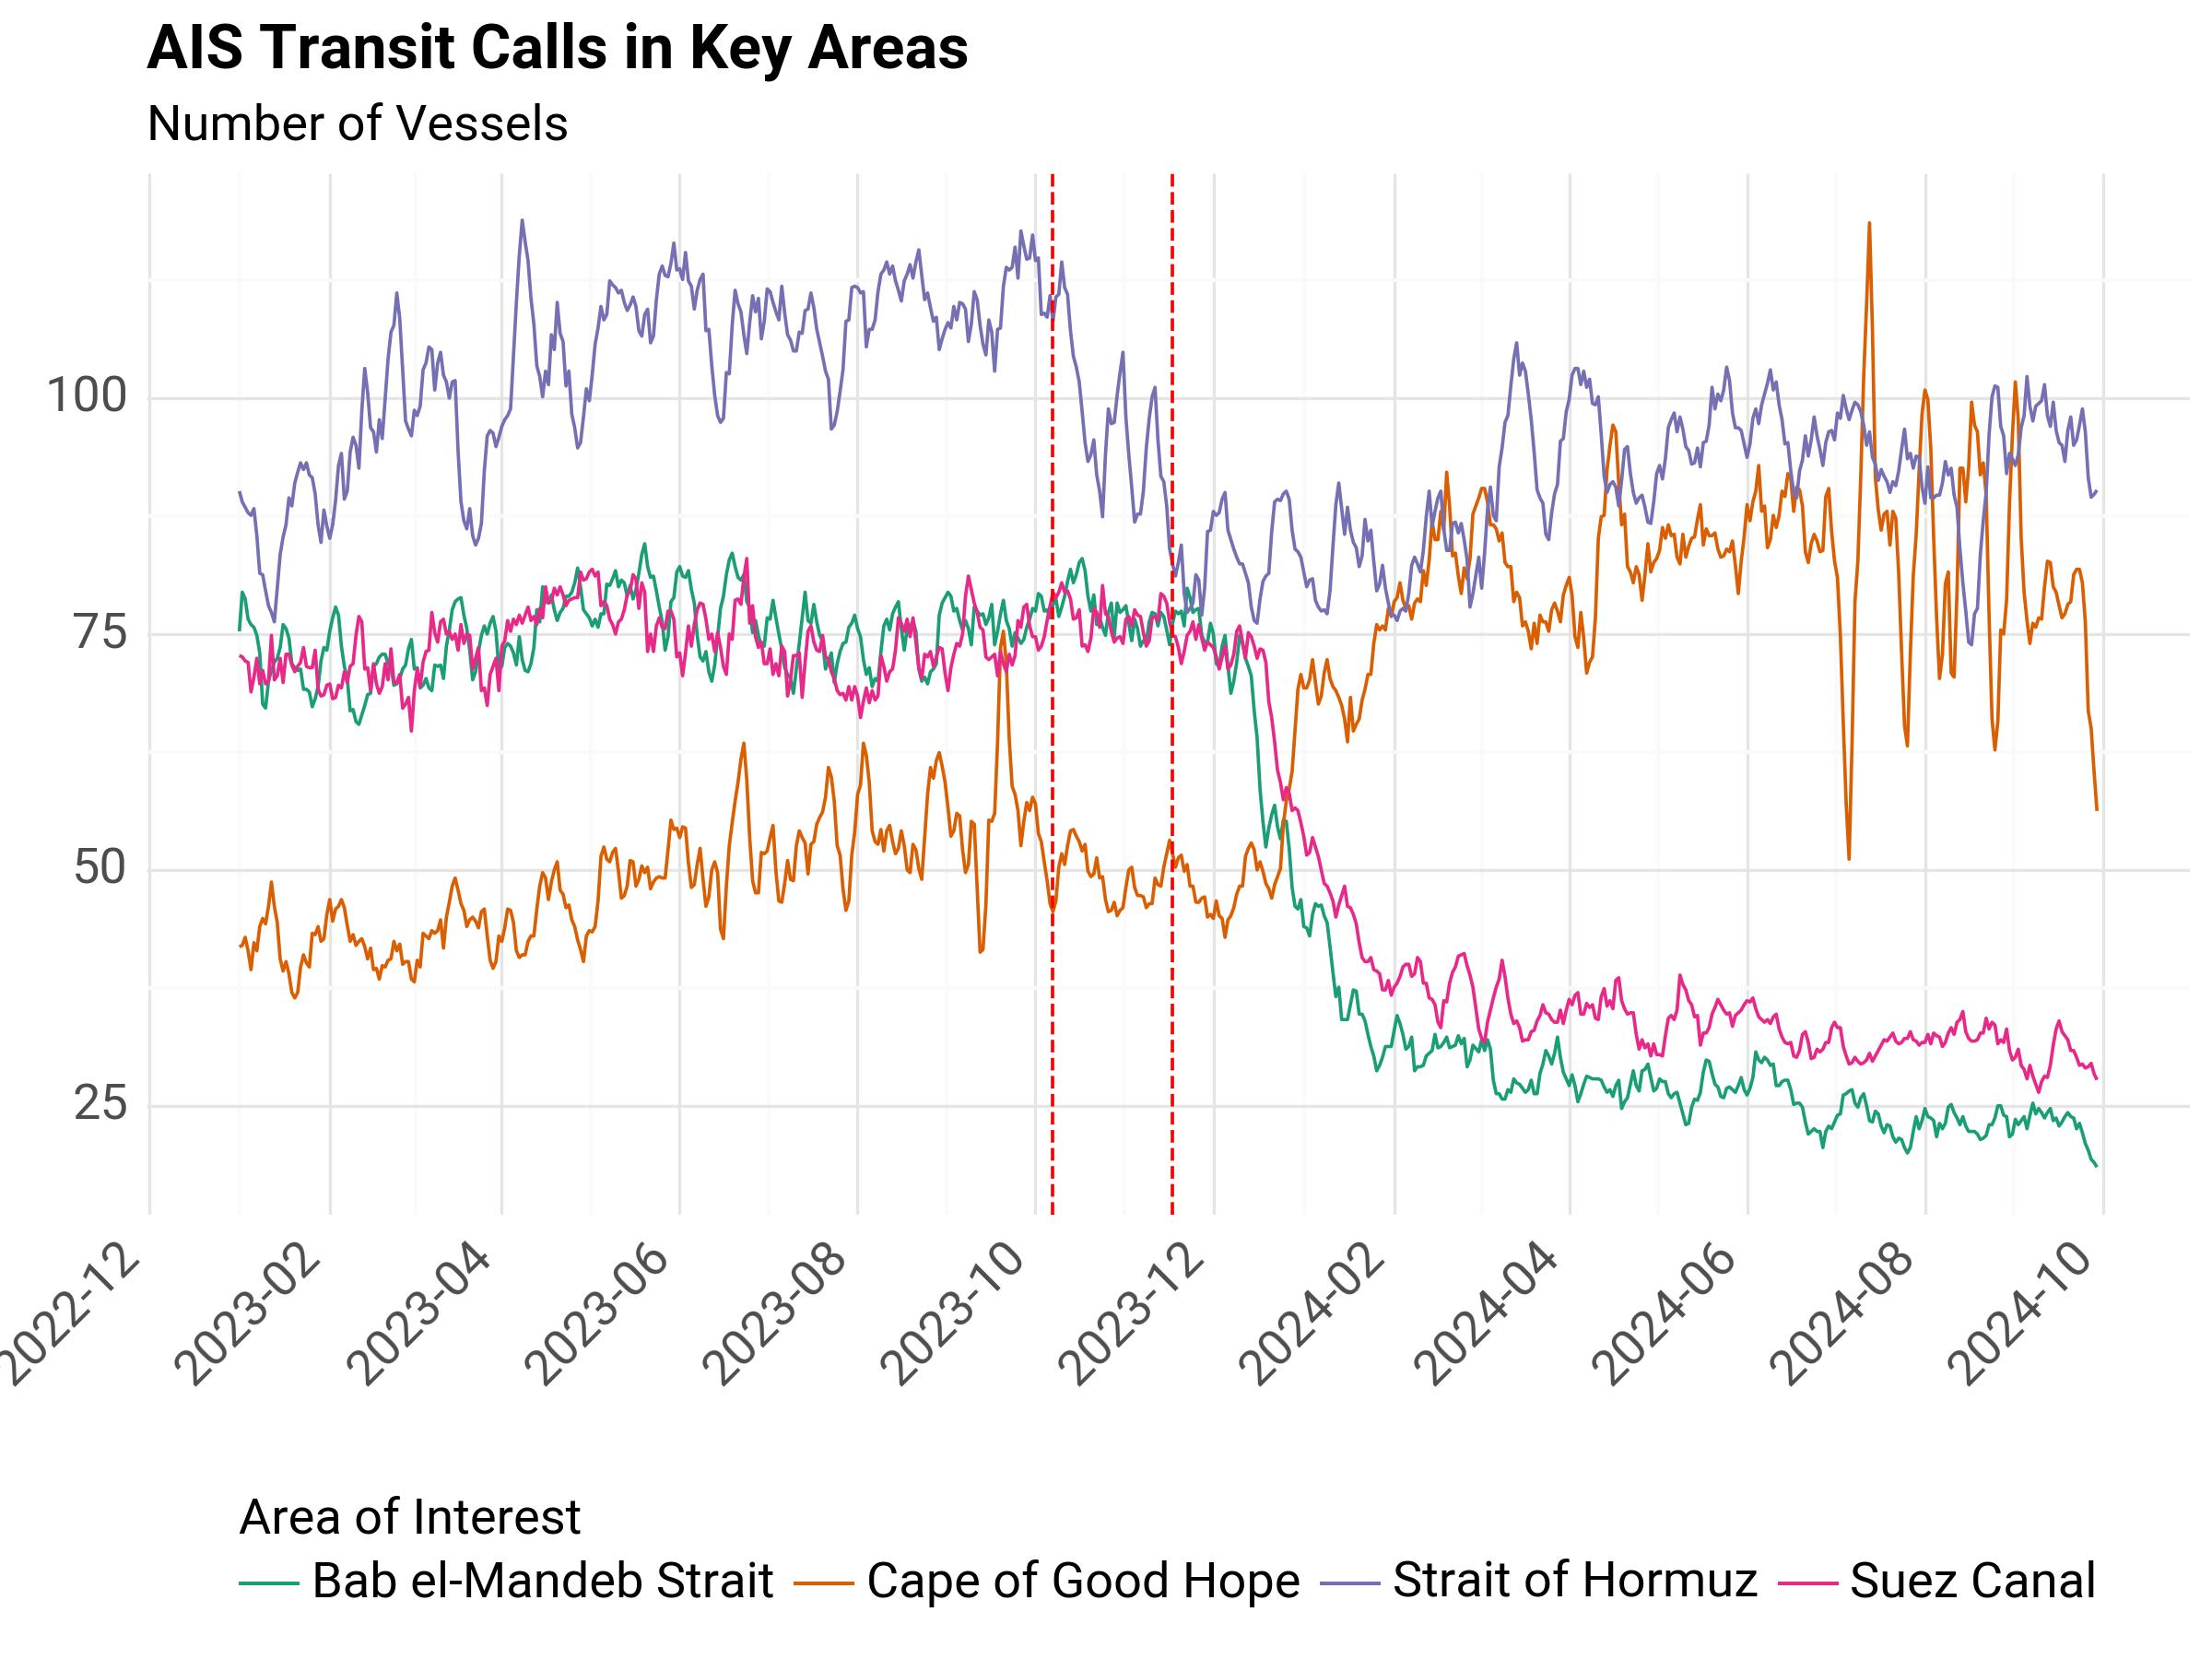
Fig. 1 AIS Transit Calls in Key Areas#
The vertical dotted red lines mark the beginning of key periods of interest highlighted by the team.
Middle East conflict: October 7th
Red Sea crisis: November 17th
As can be seen in the first figure, there is a clear diversion of maritime transit that begins early-mid December 2023, and intensifies in the following months.
The following chart shows the same metric (# of cargo/tanker vessels) going back to 2019, to show a historical trend for these areas, and give more context to the recent diversion event.
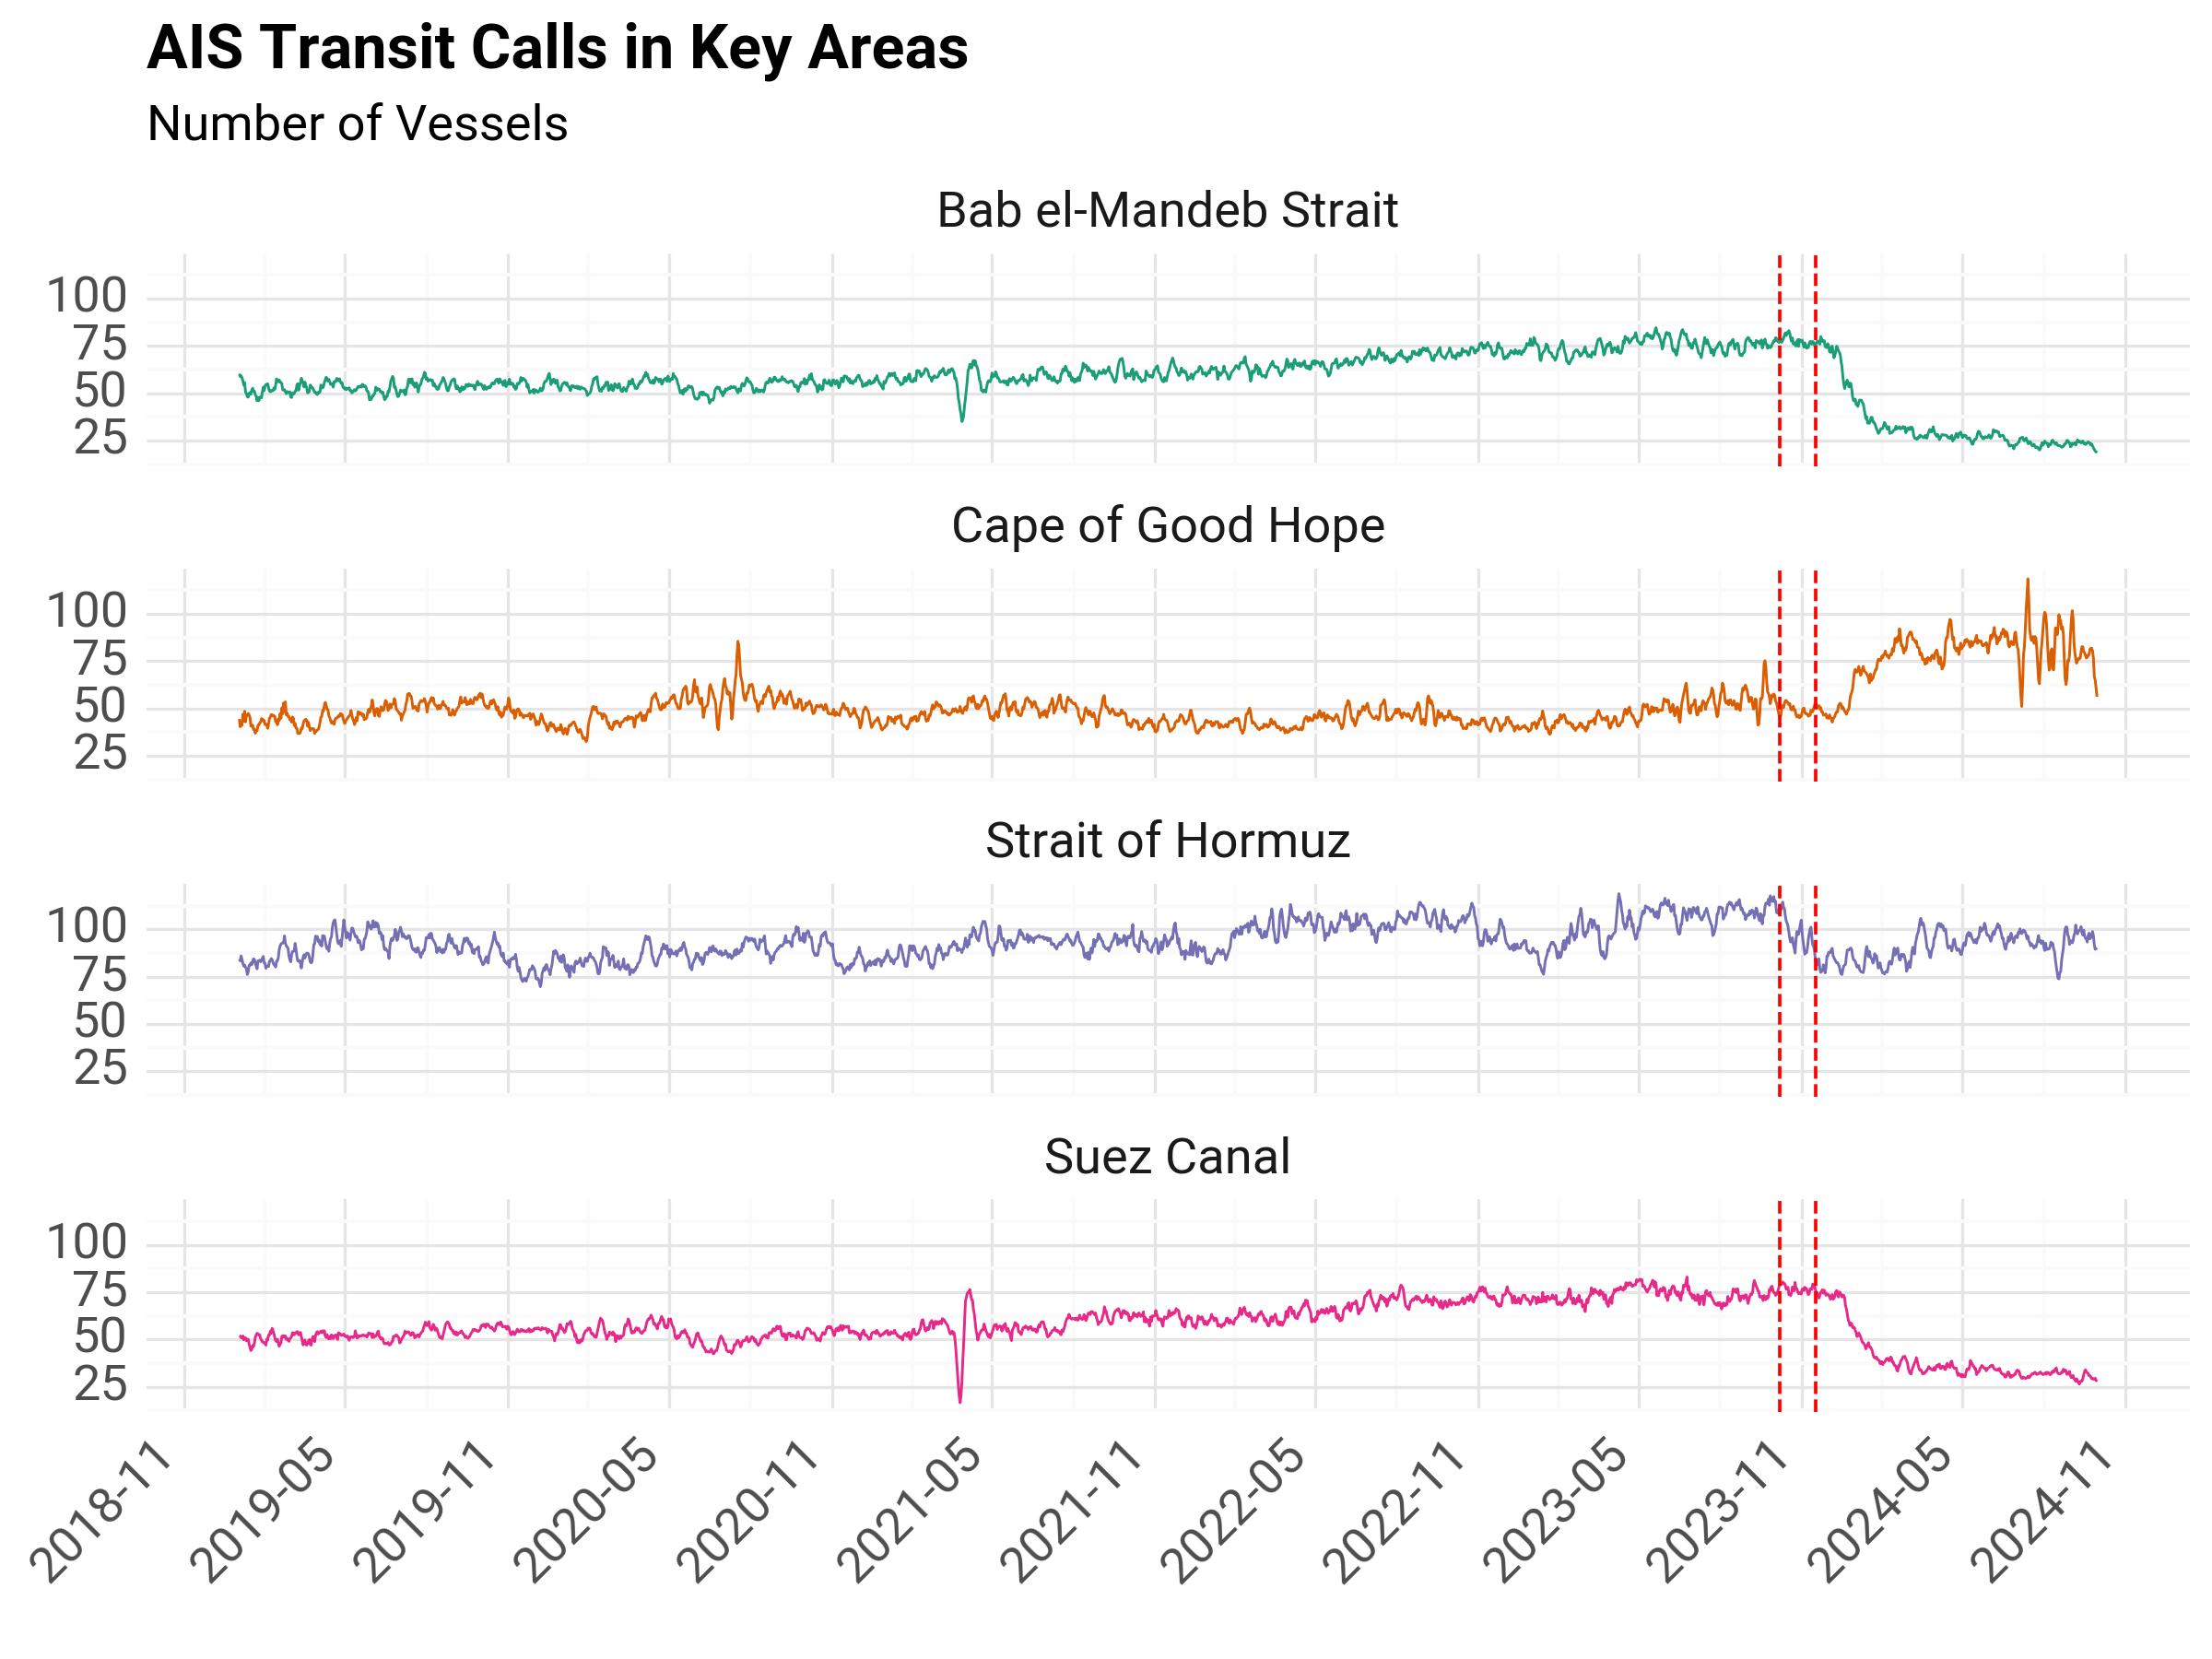
Fig. 2 AIS Transit Calls in Key Areas, Historical#
The historical chart also shows the Suez Canal blockage in early 2021, and an overall upward trajectory in transit calls in both Bab el-Mandeb Strait and Suez Canal.
Methodology#
As noted earlier, first we apply a 7-day moving average to the daily data.
We then prepare a simple baseline estimation for each day of the year and compare the recent daily values to this reference baseline.
Reference Period#
Given the volatility of 2021, we define our reference period as January 1st 2022 up to October 6th 2023. We calculate daily averages based on this time period.
The following chart separates transit calls for each area and includes a black line which signals the historical average for each area.
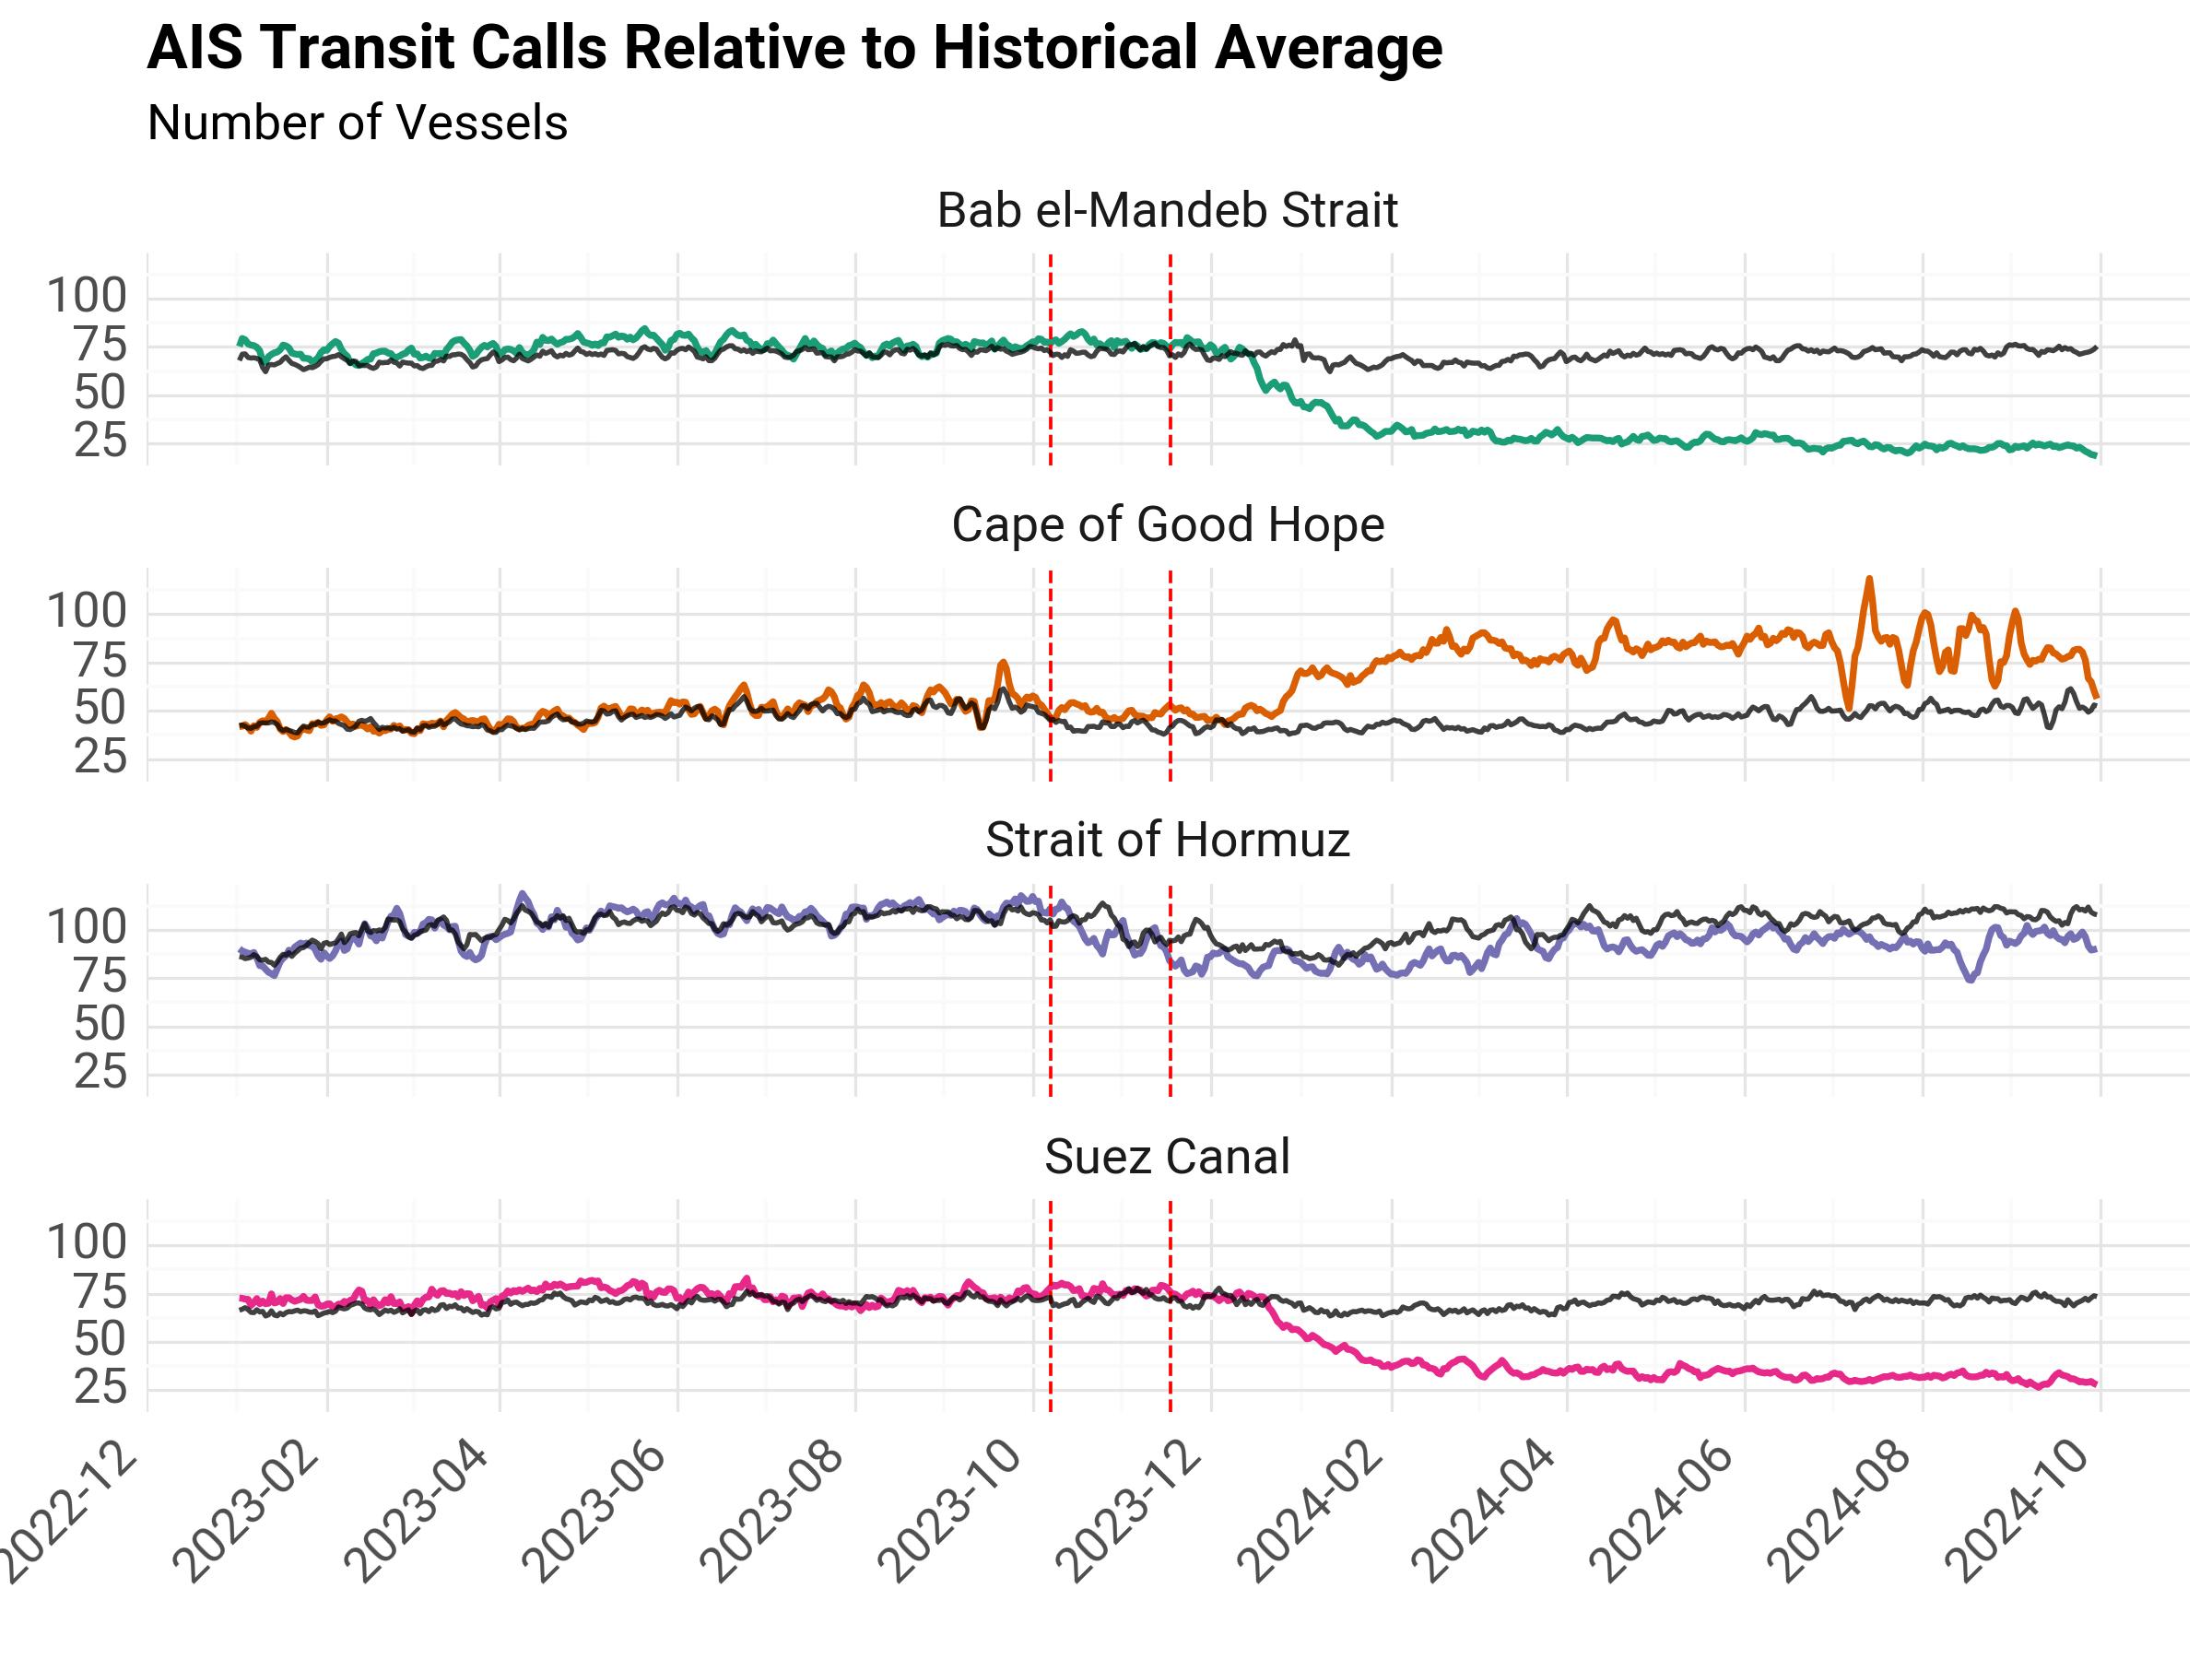
Fig. 3 AIS Transit Calls Relative to Historical Average#
Percentage Change#
We calculate the percentage change between recent daily values and the baseline daily average.
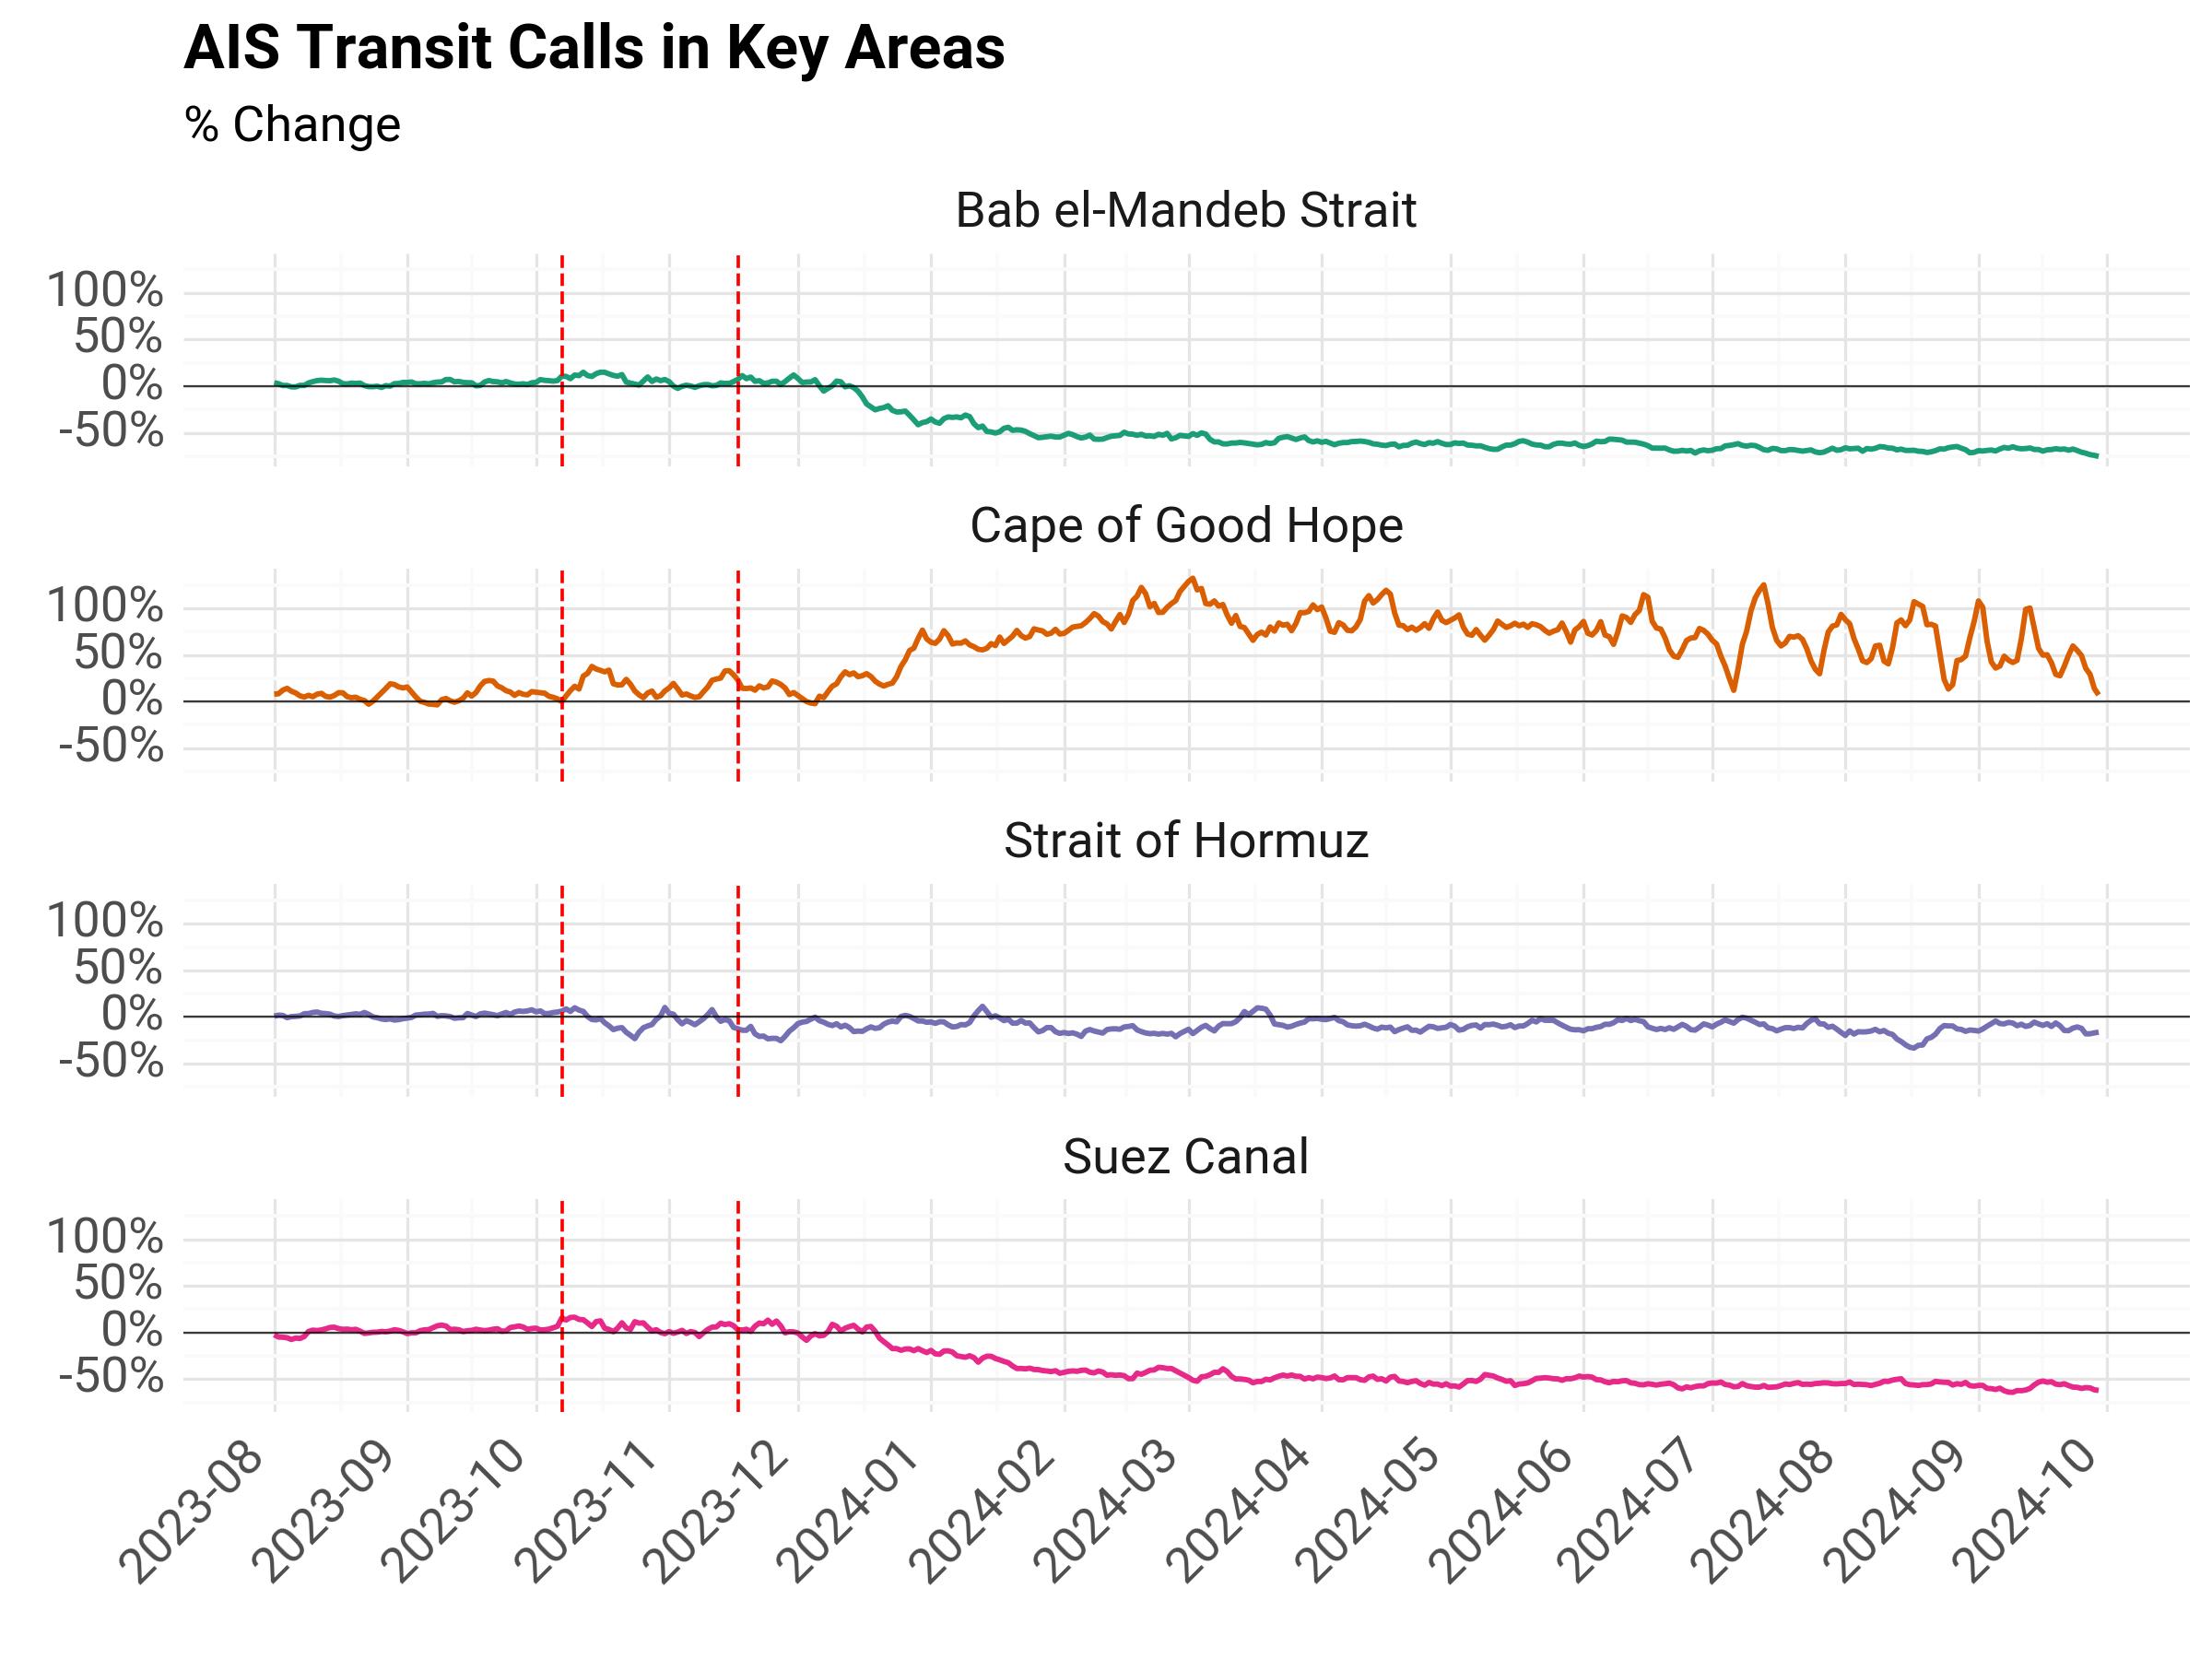
Fig. 4 AIS Transit Calls % Change from Historical Average#
Summary Statistics#
Finally, we provide some aggregate statistics (average values) per area for each period of interest.
Baseline: January 1st, 2022 – October 6th, 2023
Middle East Conflict: October 7th, 2023 - November 16th, 2023
Red Sea Crisis: November 17th, 2023 - February 19th, 2024
The tables below are also accessible through the Project’s Sharepoint Folder.
Daily Average Values by Time Period#
Area of Interest |
Period |
Tankers |
Cargo |
Total |
Capacity |
|---|---|---|---|---|---|
Bab el-Mandeb Strait |
Reference |
23.91 |
46.86 |
70.77 |
4,823,326 |
Bab el-Mandeb Strait |
Middle East Conflict |
25.95 |
51.58 |
77.53 |
5,305,603 |
Bab el-Mandeb Strait |
Red Sea Crisis |
15.34 |
27.61 |
42.95 |
2,585,144 |
Cape of Good Hope |
Reference |
9.34 |
36.68 |
46.01 |
4,380,133 |
Cape of Good Hope |
Middle East Conflict |
10.03 |
39.2 |
49.23 |
4,813,646 |
Cape of Good Hope |
Red Sea Crisis |
15.03 |
53.92 |
68.95 |
6,224,209 |
Suez Canal |
Reference |
23.09 |
46.98 |
70.07 |
4,737,291 |
Suez Canal |
Middle East Conflict |
25.2 |
51.64 |
76.83 |
5,246,677 |
Suez Canal |
Red Sea Crisis |
16.06 |
32.79 |
48.85 |
2,947,435 |
Daily Average Values by Time Period, % Change from Baseline#
The following table shows the difference in average values (% change from baseline period).
Area of Interest |
Period |
Tankers |
Cargo |
Total |
Capacity |
|---|---|---|---|---|---|
Bab el-Mandeb Strait |
Middle East Conflict |
8.56% |
10.08% |
9.56% |
10.00% |
Bab el-Mandeb Strait |
Red Sea Crisis |
-35.83% |
-41.07% |
-39.30% |
-46.40% |
Cape of Good Hope |
Middle East Conflict |
7.42% |
6.87% |
6.98% |
9.90% |
Cape of Good Hope |
Red Sea Crisis |
61.03% |
47.01% |
49.85% |
42.10% |
Suez Canal |
Middle East Conflict |
9.12% |
9.91% |
9.65% |
10.75% |
Suez Canal |
Red Sea Crisis |
-30.46% |
-30.20% |
-30.29% |
-37.78% |