Ports Notebook#
The objective of this analysis is to examine the impact of the Red Sea Conflict on maritime trade statistics derived from AIS data.
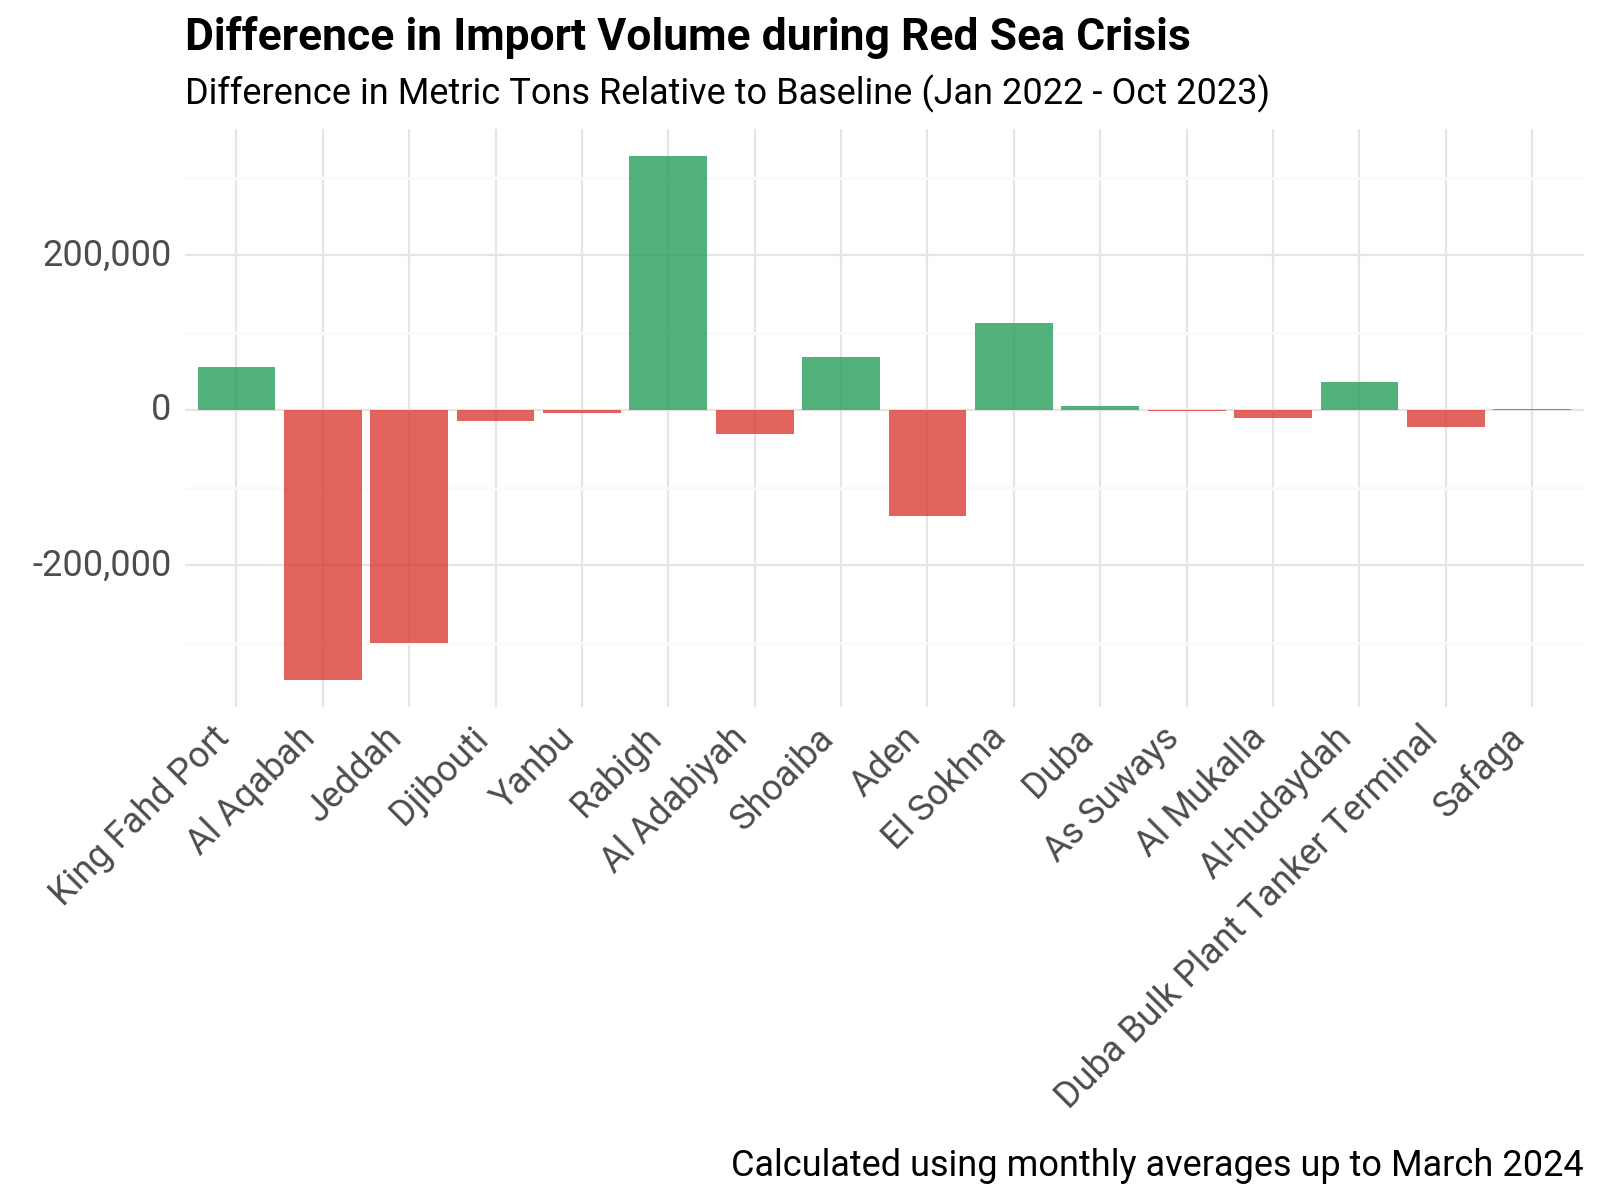
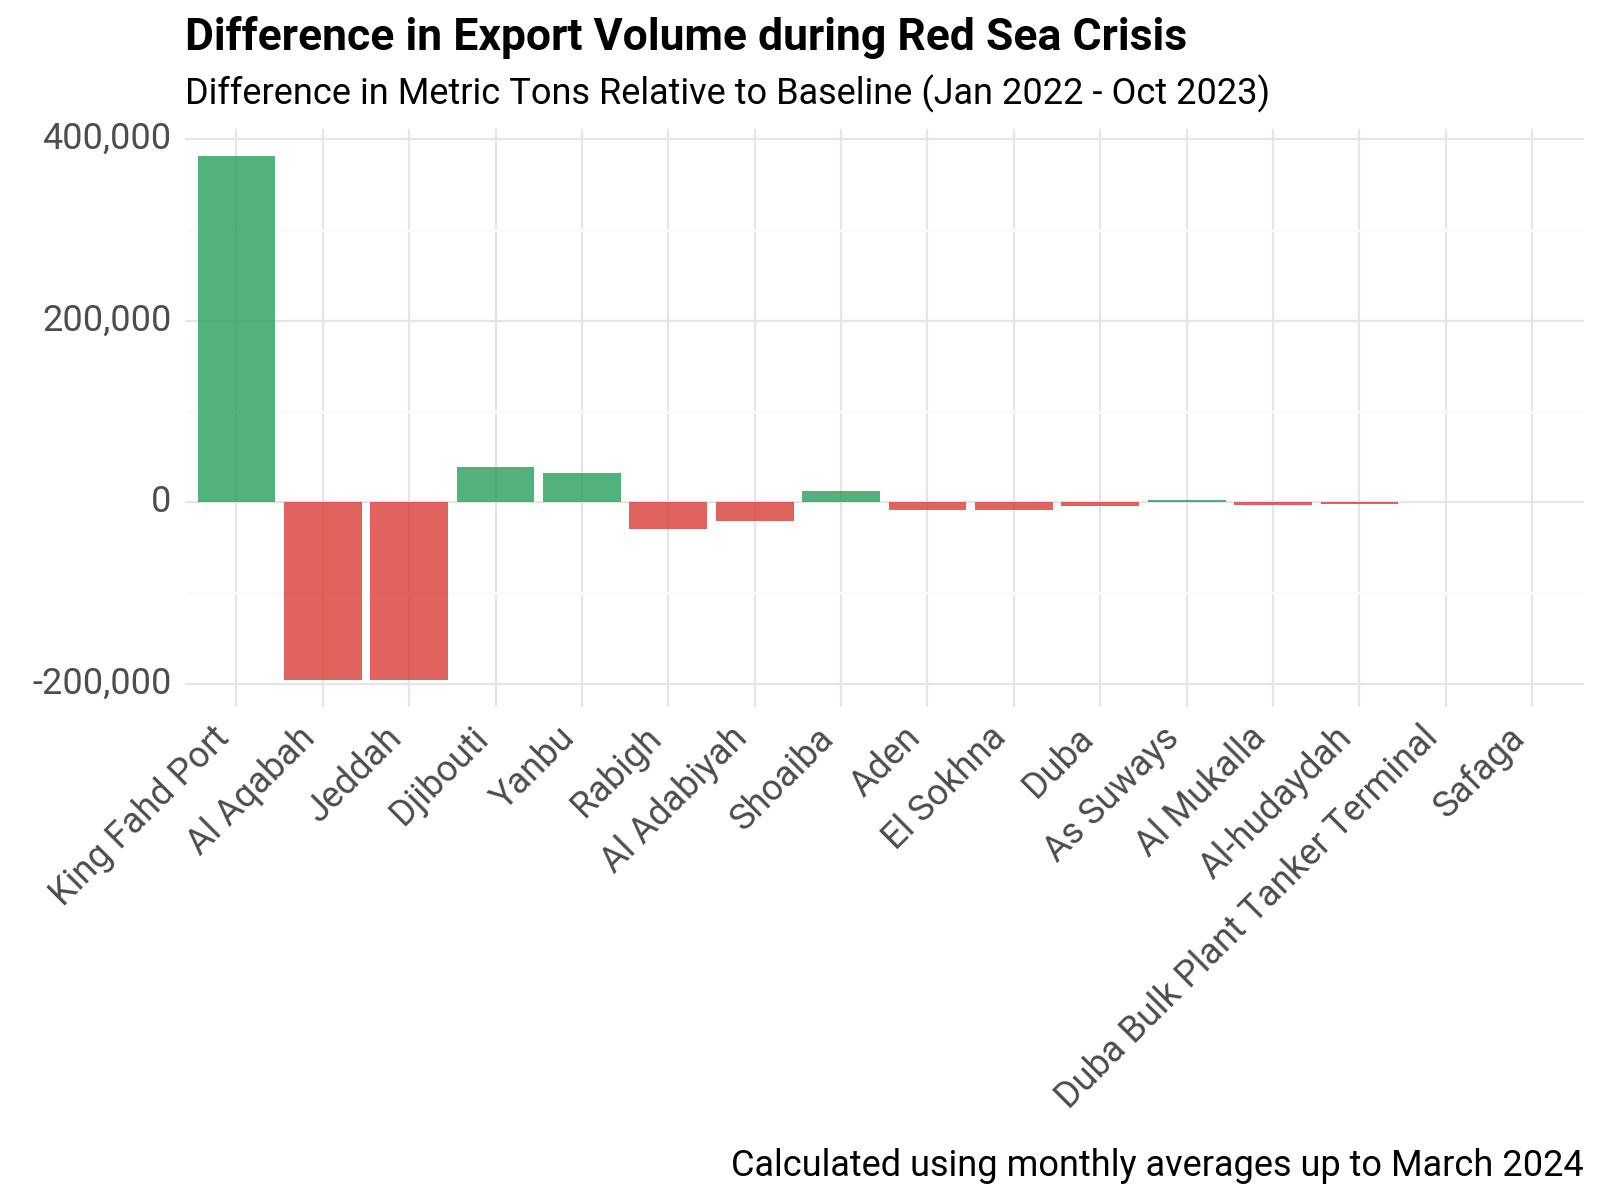
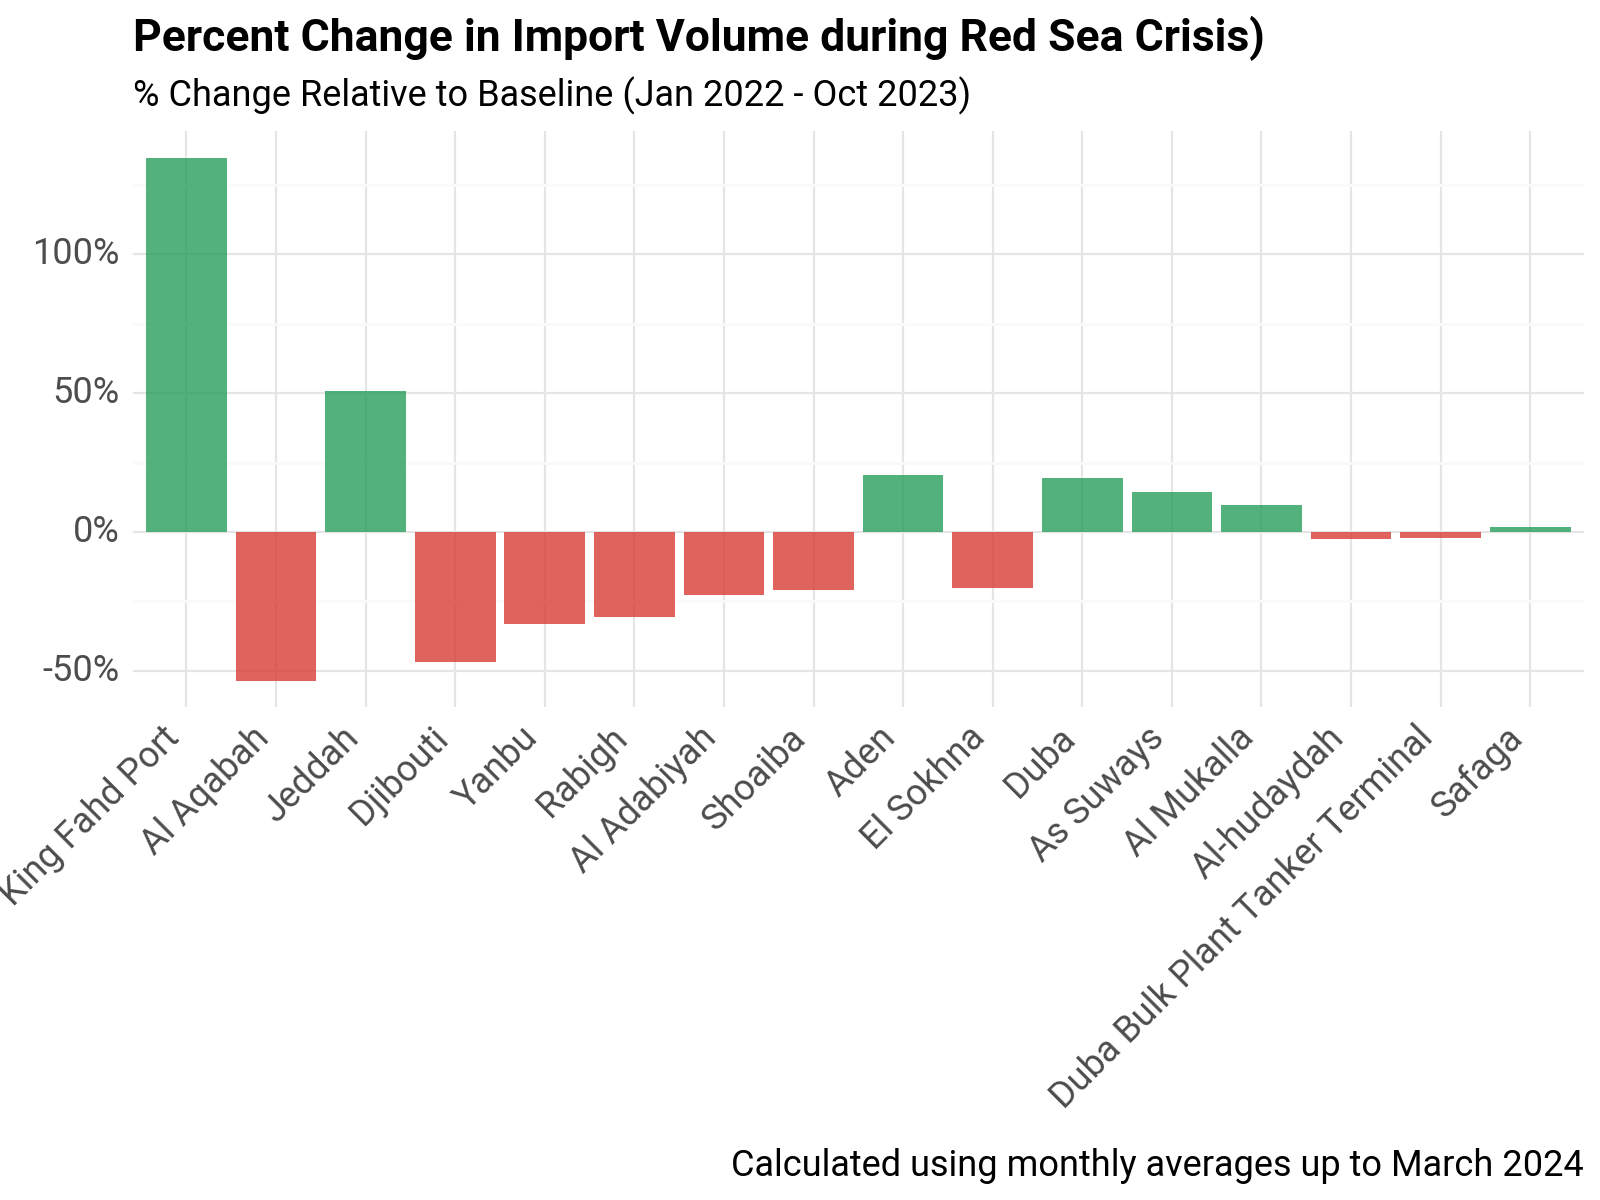
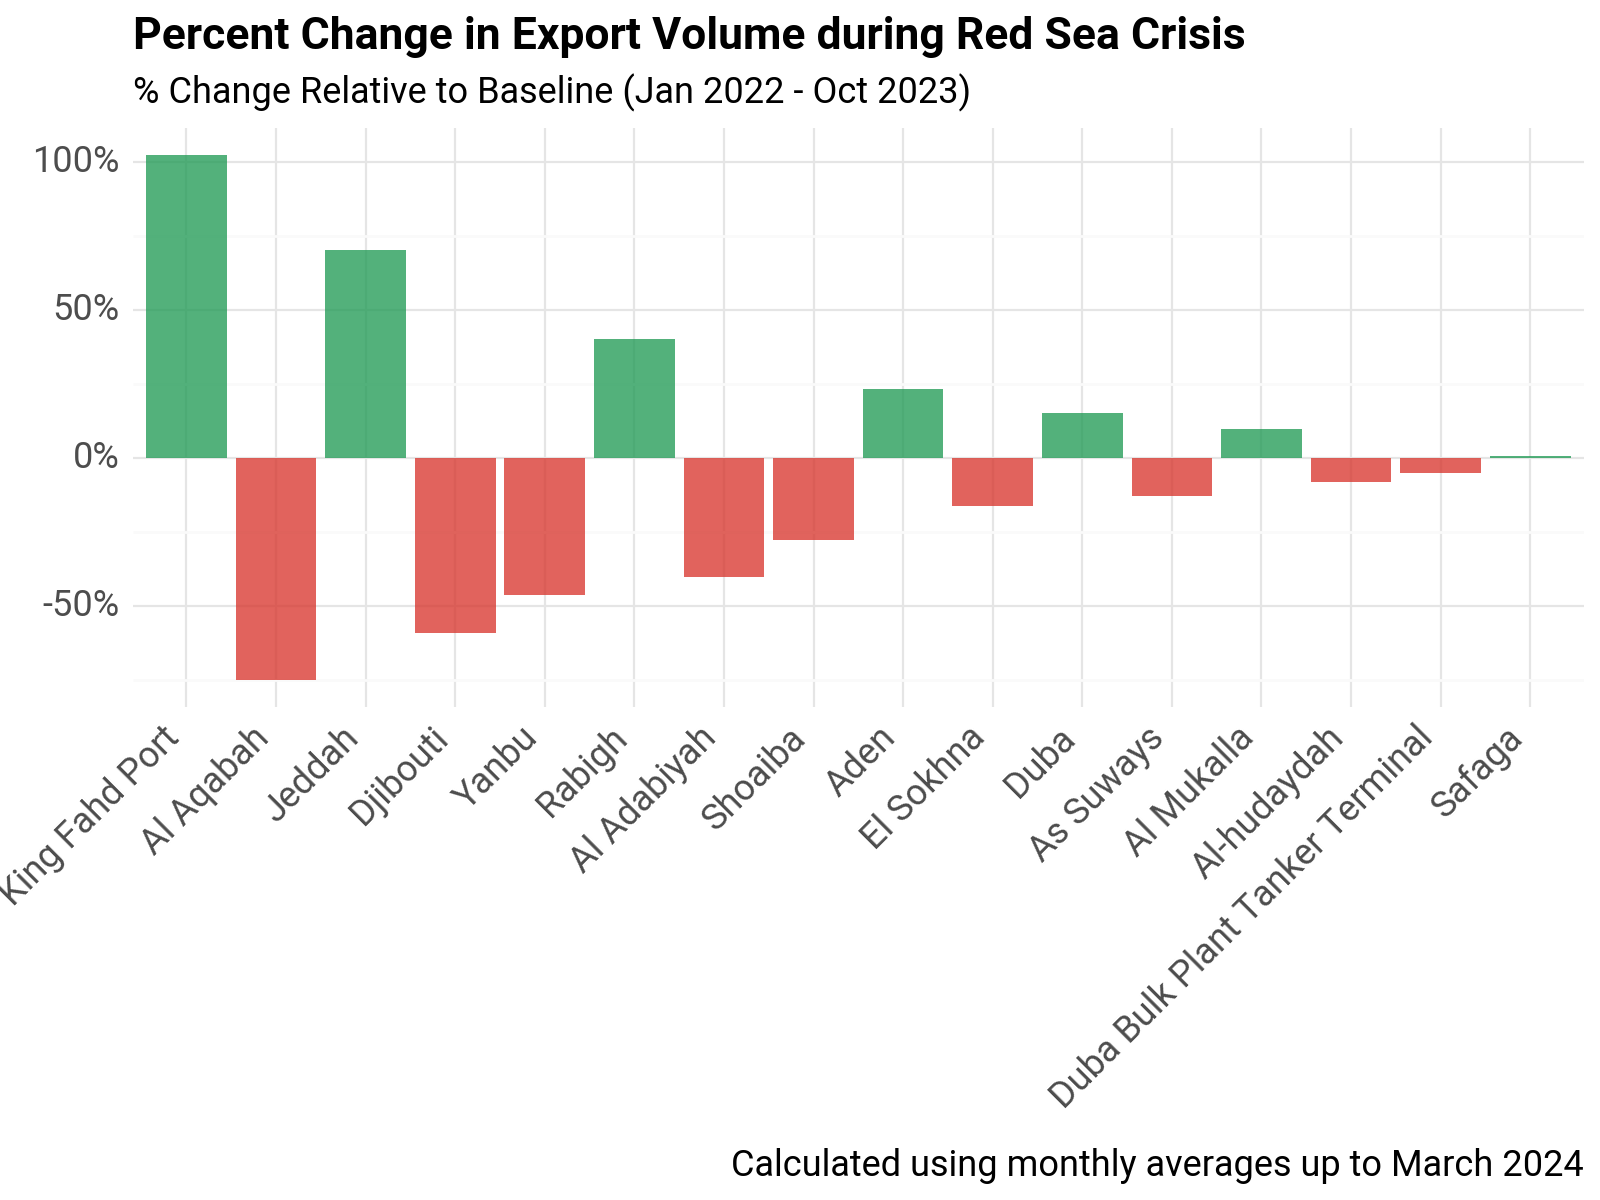
We process transit calls and estimated trade volume from the IMF’s PortWatch platform for key ports of interest. We then produce charts to inspect trends and calculate percentage changes from a historical baseline.
Setup#
Import libraries and define output paths to save graphs and tables.
import os
from os.path import join, exists

import pandas as pd
import geopandas as gpd

import git
import time

git_repo = git.Repo(os.getcwd(), search_parent_directories=True)
git_root = git_repo.git.rev_parse("--show-toplevel")
from red_sea_monitoring.utils import *

# For plotting
from plotnine import *
from mizani.breaks import date_breaks
from mizani.formatters import date_format, comma_format, percent_format
import plotnine

# plotnine.options.figure_size = (10, 8)
plotnine.options.figure_size = (5, 4)

output_dir = (
    r"C:\Users\WB514197\WBG\Development Data Partnership - Red Sea Maritime Monitoring"
)
charts_dir = join(git_root, "reports")
Data#
Ports#
# ports = get_ports()
countries = ["Egypt", "Yemen", "Djibouti", "Jordan", "Saudi Arabia"]
# ports_sel = ports.loc[ports.country.isin(countries)].copy()
# ports_sel.sort_values("country", inplace=True)
# ports_sel.loc[:, "geometry"] = ports_sel.apply(lambda x: Point(x.lon, x.lat), axis=1)
# ports_gdf = gpd.GeoDataFrame(ports_sel, geometry="geometry", crs="EPSG:4326")
# ports_gdf.to_file(join(git_root, "data", "ports_sel.geojson"), driver='GeoJSON'))
ports_red_sea = gpd.read_file(
    join(git_root, "data", "red_sea_ports.geojson"), driver="GeoJSON"
)
ports_red_sea[["country", "portname", "portid"]]
| country | portname | portid | |
|---|---|---|---|
| 0 | Djibouti | Djibouti | port294 |
| 1 | Egypt | El-Adabiya | port321 |
| 2 | Egypt | Safaga | port191 |
| 3 | Egypt | North Ain Sukhna Port | port828 |
| 4 | Egypt | As Suways | port71 |
| 5 | Jordan | Al Aqabah | port19 |
| 6 | Saudi Arabia | Duba Bulk Plant Tanker Terminal | port305 |
| 7 | Saudi Arabia | Rabigh | port1081 |
| 8 | Saudi Arabia | King Fahd Port | port570 |
| 9 | Saudi Arabia | Duba | port304 |
| 10 | Saudi Arabia | Yanbu | port1408 |
| 11 | Saudi Arabia | Jiddah | port518 |
| 12 | Saudi Arabia | Jiddah Oil | port519 |
| 13 | Yemen | Al Mukalla | port27 |
| 14 | Yemen | Al Ahmadi | port18 |
| 15 | Yemen | Aden | port9 |
Map of Ports#
ports_red_sea[
    [
        "geometry",
        "portname",
        "country",
        "vessel_count_total",
        "vessel_count_container",
        "vessel_count_dry_bulk",
        "vessel_count_general_cargo",
        "vessel_count_RoRo",
        "vessel_count_tanker",
        "industry_top1",
        "industry_top2",
        "industry_top3",
        "share_country_maritime_import",
        "share_country_maritime_export",
    ]
].explore(
    column="country",
    cmap="Dark2",
    marker_kwds={"radius": 7},
    tiles="Esri.WorldGrayCanvas",
    legend_kwds={"loc": "upper right", "caption": "Ports"},
    # attribution = 'chec'
)
Trade Data#
Pull trade data for selected locations.
ports = list(ports_red_sea.portid)
df_ports = get_port_data(ports)
df_ports.to_csv(
    join(
        output_dir,
        "data",
        "PortWatch-data",
        f'ports_data_{time.strftime("%Y_%m_%d")}.csv',
    ),
    index=False,
)
Data Analysis#
Convert to Weekly#
df = pd.read_csv(
    join(
        output_dir,
        "data",
        "PortWatch-data",
        f'ports_data_{time.strftime("%Y_%m_%d")}.csv',
    )
)
df.date = pd.to_datetime(df.date)
df = df.loc[df.date >= "2019-01-01"].copy()
df.tail(2)
| date | year | month | day | portid | portname | country | ISO3 | portcalls_container | portcalls_dry_bulk | ... | import_cargo | import | export_container | export_dry_bulk | export_general_cargo | export_roro | export_tanker | export_cargo | export | ObjectId | |
|---|---|---|---|---|---|---|---|---|---|---|---|---|---|---|---|---|---|---|---|---|---|
| 33598 | 2024-09-28 20:00:00 | 2024 | 9 | 29 | port9 | Aden | Yemen | YEM | 0 | 0 | ... | 0.0 | 0.0 | 0.0 | 0.0 | 0.0 | 0.0 | 0.0 | 0.0 | 0.0 | 3227966 |
| 33599 | 2024-09-29 20:00:00 | 2024 | 9 | 30 | port9 | Aden | Yemen | YEM | 0 | 0 | ... | 0.0 | 0.0 | 0.0 | 0.0 | 0.0 | 0.0 | 0.0 | 0.0 | 0.0 | 3227967 |
2 rows × 30 columns
Calculate weekly sums.
df = df[
    [
        "portid",
        "portname",
        "portcalls_cargo",
        "portcalls_tanker",
        "portcalls",
        "import_cargo",
        "export_cargo",
        "import_tanker",
        "export_tanker",
        "import",
        "export",
        "date",
    ]
].copy()
df_raw = df.copy()

df = (
    df.groupby(["portname", "portid"])[
        [
            "portcalls_cargo",
            "portcalls_tanker",
            "portcalls",
            "import_cargo",
            "export_cargo",
            "import_tanker",
            "export_tanker",
            "import",
            "export",
            "date",
        ]
    ]
    .resample("W-Mon", on="date")
    .sum()
    .reset_index()
)

df.loc[:, "ymd"] = df.date.dt.strftime("%Y-%m-%d")
df.loc[:, "w"] = df.date.dt.strftime("%W")
df.head(2)
| portname | portid | date | portcalls_cargo | portcalls_tanker | portcalls | import_cargo | export_cargo | import_tanker | export_tanker | import | export | ymd | w | |
|---|---|---|---|---|---|---|---|---|---|---|---|---|---|---|
| 0 | Aden | port9 | 2019-01-07 | 9 | 1 | 10 | 67364.559011 | 6774.851456 | 0.0 | 0.0 | 67364.559011 | 6774.851456 | 2019-01-07 | 01 |
| 1 | Aden | port9 | 2019-01-14 | 9 | 0 | 9 | 57414.729623 | 0.000000 | 0.0 | 0.0 | 57414.729623 | 0.000000 | 2019-01-14 | 02 |
Plot Weekly Trade Volume#
# start_reference_date = "2022-01-01"
conflict_date = "2023-10-07"
crisis_date = "2023-11-17"
df_filt = df.loc[(df.date >= "2023-01-01")].copy()
charts_by_port_dir = join(charts_dir, "ports")
if not exists(charts_by_port_dir):
    os.makedirs(charts_by_port_dir, mode=0o777)
start_reference_date = "2022-01-01"
df_ref = df.loc[(df.date >= start_reference_date) & (df.date < conflict_date)].copy()
df_ref = df_ref.groupby(["portname", "portid", "w"])[
    [
        "portcalls_cargo",
        "portcalls_tanker",
        "portcalls",
        "import_cargo",
        "export_cargo",
        "import_tanker",
        "export_tanker",
        "import",
        "export",
    ]
].mean()
df_ref.reset_index(inplace=True)
df_ref.rename(
    columns={
        "portcalls_cargo": "portcalls_cargo_ref",
        "portcalls_tanker": "portcalls_tanker_ref",
        "portcalls": "portcalls_ref",
        "import_cargo": "import_cargo_ref",
        "export_cargo": "export_cargo_ref",
        "import_tanker": "import_tanker_ref",
        "export_tanker": "export_tanker_ref",
        "import": "import_ref",
        "export": "export_ref",
    },
    inplace=True,
)
df_filt = df_filt.merge(
    df_ref, on=["portname", "portid", "w"], how="left", validate="m:1"
)
for port_id in df_filt.portid.unique():
    port_info = ports_red_sea.loc[ports_red_sea.portid == port_id].iloc[0]
    country = port_info.country
    df_port = df_filt.loc[df_filt.portid == port_id].copy()
    df_port_copy = df_port.copy()
    port = df_port_copy.iloc[0].portname
    df_port = df_port.melt(
        id_vars="date",
        value_vars=["import", "export"],
        var_name="direction",
        value_name="trade",
    )
    df_port.loc[:, "direction"] = df_port.direction.str.capitalize()
    p0 = (
        ggplot(df_port_copy, aes(x="date", y="import_ref"))  #
        + geom_bar(
            mapping=aes(x="date", y="trade", fill="direction"),
            data=df_port,
            alpha=3 / 4,
            stat="identity",
            position="dodge2",
        )
        + geom_smooth(
            mapping=aes(x="date", y="import_ref"), color="#00BFC4", size=1, alpha=3 / 4
        )
        + geom_smooth(
            mapping=aes(x="date", y="export_ref"), color="#F8766D", size=1, alpha=3 / 4
        )
        + geom_vline(xintercept=conflict_date, linetype="dashed", color="black")
        + geom_vline(xintercept=crisis_date, linetype="dashed", color="black")
        + labs(
            x="",
            y="",
            subtitle="Metric Tons",
            title=f"Weekly Trade Volume - {port}, {country}",
            fill="Trade Flow",
        )
        + theme_minimal()
        + theme(
            text=element_text(family="Roboto", size=13),
            plot_title=element_text(family="Roboto", size=16, weight="bold"),
            axis_text_x=element_text(rotation=45, hjust=1),
            legend_position="none",
        )
        + scale_x_datetime(breaks=date_breaks("2 month"), labels=date_format("%Y-%m"))
        + scale_y_continuous(labels=comma_format())
    )
    # display(p0)
    p0.save(
        filename=join(charts_by_port_dir, f"estimated-trade-{port_id}.jpeg"), dpi=300
    )
c:\WBG\Anaconda3\envs\rtmis\Lib\site-packages\plotnine\ggplot.py:587: PlotnineWarning: Saving 5 x 4 in image.
c:\WBG\Anaconda3\envs\rtmis\Lib\site-packages\plotnine\ggplot.py:588: PlotnineWarning: Filename: C:/Users/WB514197/Repos/red-sea-monitoring\reports\ports\estimated-trade-port9.jpeg
c:\WBG\Anaconda3\envs\rtmis\Lib\site-packages\plotnine\stats\smoothers.py:330: PlotnineWarning: Confidence intervals are not yet implemented for lowess smoothings.
c:\WBG\Anaconda3\envs\rtmis\Lib\site-packages\plotnine\stats\smoothers.py:330: PlotnineWarning: Confidence intervals are not yet implemented for lowess smoothings.
c:\WBG\Anaconda3\envs\rtmis\Lib\site-packages\plotnine\ggplot.py:587: PlotnineWarning: Saving 5 x 4 in image.
c:\WBG\Anaconda3\envs\rtmis\Lib\site-packages\plotnine\ggplot.py:588: PlotnineWarning: Filename: C:/Users/WB514197/Repos/red-sea-monitoring\reports\ports\estimated-trade-port321.jpeg
c:\WBG\Anaconda3\envs\rtmis\Lib\site-packages\plotnine\stats\smoothers.py:330: PlotnineWarning: Confidence intervals are not yet implemented for lowess smoothings.
c:\WBG\Anaconda3\envs\rtmis\Lib\site-packages\plotnine\stats\smoothers.py:330: PlotnineWarning: Confidence intervals are not yet implemented for lowess smoothings.
c:\WBG\Anaconda3\envs\rtmis\Lib\site-packages\plotnine\ggplot.py:587: PlotnineWarning: Saving 5 x 4 in image.
c:\WBG\Anaconda3\envs\rtmis\Lib\site-packages\plotnine\ggplot.py:588: PlotnineWarning: Filename: C:/Users/WB514197/Repos/red-sea-monitoring\reports\ports\estimated-trade-port19.jpeg
c:\WBG\Anaconda3\envs\rtmis\Lib\site-packages\plotnine\stats\smoothers.py:330: PlotnineWarning: Confidence intervals are not yet implemented for lowess smoothings.
c:\WBG\Anaconda3\envs\rtmis\Lib\site-packages\plotnine\stats\smoothers.py:330: PlotnineWarning: Confidence intervals are not yet implemented for lowess smoothings.
c:\WBG\Anaconda3\envs\rtmis\Lib\site-packages\plotnine\ggplot.py:587: PlotnineWarning: Saving 5 x 4 in image.
c:\WBG\Anaconda3\envs\rtmis\Lib\site-packages\plotnine\ggplot.py:588: PlotnineWarning: Filename: C:/Users/WB514197/Repos/red-sea-monitoring\reports\ports\estimated-trade-port27.jpeg
c:\WBG\Anaconda3\envs\rtmis\Lib\site-packages\plotnine\stats\smoothers.py:330: PlotnineWarning: Confidence intervals are not yet implemented for lowess smoothings.
c:\WBG\Anaconda3\envs\rtmis\Lib\site-packages\plotnine\stats\smoothers.py:330: PlotnineWarning: Confidence intervals are not yet implemented for lowess smoothings.
c:\WBG\Anaconda3\envs\rtmis\Lib\site-packages\plotnine\ggplot.py:587: PlotnineWarning: Saving 5 x 4 in image.
c:\WBG\Anaconda3\envs\rtmis\Lib\site-packages\plotnine\ggplot.py:588: PlotnineWarning: Filename: C:/Users/WB514197/Repos/red-sea-monitoring\reports\ports\estimated-trade-port18.jpeg
c:\WBG\Anaconda3\envs\rtmis\Lib\site-packages\plotnine\stats\smoothers.py:330: PlotnineWarning: Confidence intervals are not yet implemented for lowess smoothings.
c:\WBG\Anaconda3\envs\rtmis\Lib\site-packages\plotnine\stats\smoothers.py:330: PlotnineWarning: Confidence intervals are not yet implemented for lowess smoothings.
c:\WBG\Anaconda3\envs\rtmis\Lib\site-packages\plotnine\ggplot.py:587: PlotnineWarning: Saving 5 x 4 in image.
c:\WBG\Anaconda3\envs\rtmis\Lib\site-packages\plotnine\ggplot.py:588: PlotnineWarning: Filename: C:/Users/WB514197/Repos/red-sea-monitoring\reports\ports\estimated-trade-port71.jpeg
c:\WBG\Anaconda3\envs\rtmis\Lib\site-packages\plotnine\stats\smoothers.py:330: PlotnineWarning: Confidence intervals are not yet implemented for lowess smoothings.
c:\WBG\Anaconda3\envs\rtmis\Lib\site-packages\plotnine\stats\smoothers.py:330: PlotnineWarning: Confidence intervals are not yet implemented for lowess smoothings.
c:\WBG\Anaconda3\envs\rtmis\Lib\site-packages\plotnine\ggplot.py:587: PlotnineWarning: Saving 5 x 4 in image.
c:\WBG\Anaconda3\envs\rtmis\Lib\site-packages\plotnine\ggplot.py:588: PlotnineWarning: Filename: C:/Users/WB514197/Repos/red-sea-monitoring\reports\ports\estimated-trade-port294.jpeg
c:\WBG\Anaconda3\envs\rtmis\Lib\site-packages\plotnine\stats\smoothers.py:330: PlotnineWarning: Confidence intervals are not yet implemented for lowess smoothings.
c:\WBG\Anaconda3\envs\rtmis\Lib\site-packages\plotnine\stats\smoothers.py:330: PlotnineWarning: Confidence intervals are not yet implemented for lowess smoothings.
c:\WBG\Anaconda3\envs\rtmis\Lib\site-packages\plotnine\ggplot.py:587: PlotnineWarning: Saving 5 x 4 in image.
c:\WBG\Anaconda3\envs\rtmis\Lib\site-packages\plotnine\ggplot.py:588: PlotnineWarning: Filename: C:/Users/WB514197/Repos/red-sea-monitoring\reports\ports\estimated-trade-port304.jpeg
c:\WBG\Anaconda3\envs\rtmis\Lib\site-packages\plotnine\stats\smoothers.py:330: PlotnineWarning: Confidence intervals are not yet implemented for lowess smoothings.
c:\WBG\Anaconda3\envs\rtmis\Lib\site-packages\plotnine\stats\smoothers.py:330: PlotnineWarning: Confidence intervals are not yet implemented for lowess smoothings.
c:\WBG\Anaconda3\envs\rtmis\Lib\site-packages\plotnine\ggplot.py:587: PlotnineWarning: Saving 5 x 4 in image.
c:\WBG\Anaconda3\envs\rtmis\Lib\site-packages\plotnine\ggplot.py:588: PlotnineWarning: Filename: C:/Users/WB514197/Repos/red-sea-monitoring\reports\ports\estimated-trade-port305.jpeg
c:\WBG\Anaconda3\envs\rtmis\Lib\site-packages\plotnine\stats\smoothers.py:330: PlotnineWarning: Confidence intervals are not yet implemented for lowess smoothings.
c:\WBG\Anaconda3\envs\rtmis\Lib\site-packages\plotnine\stats\smoothers.py:330: PlotnineWarning: Confidence intervals are not yet implemented for lowess smoothings.
c:\WBG\Anaconda3\envs\rtmis\Lib\site-packages\plotnine\ggplot.py:587: PlotnineWarning: Saving 5 x 4 in image.
c:\WBG\Anaconda3\envs\rtmis\Lib\site-packages\plotnine\ggplot.py:588: PlotnineWarning: Filename: C:/Users/WB514197/Repos/red-sea-monitoring\reports\ports\estimated-trade-port828.jpeg
c:\WBG\Anaconda3\envs\rtmis\Lib\site-packages\plotnine\stats\smoothers.py:330: PlotnineWarning: Confidence intervals are not yet implemented for lowess smoothings.
c:\WBG\Anaconda3\envs\rtmis\Lib\site-packages\plotnine\stats\smoothers.py:330: PlotnineWarning: Confidence intervals are not yet implemented for lowess smoothings.
c:\WBG\Anaconda3\envs\rtmis\Lib\site-packages\plotnine\ggplot.py:587: PlotnineWarning: Saving 5 x 4 in image.
c:\WBG\Anaconda3\envs\rtmis\Lib\site-packages\plotnine\ggplot.py:588: PlotnineWarning: Filename: C:/Users/WB514197/Repos/red-sea-monitoring\reports\ports\estimated-trade-port518.jpeg
c:\WBG\Anaconda3\envs\rtmis\Lib\site-packages\plotnine\stats\smoothers.py:330: PlotnineWarning: Confidence intervals are not yet implemented for lowess smoothings.
c:\WBG\Anaconda3\envs\rtmis\Lib\site-packages\plotnine\stats\smoothers.py:330: PlotnineWarning: Confidence intervals are not yet implemented for lowess smoothings.
c:\WBG\Anaconda3\envs\rtmis\Lib\site-packages\plotnine\ggplot.py:587: PlotnineWarning: Saving 5 x 4 in image.
c:\WBG\Anaconda3\envs\rtmis\Lib\site-packages\plotnine\ggplot.py:588: PlotnineWarning: Filename: C:/Users/WB514197/Repos/red-sea-monitoring\reports\ports\estimated-trade-port570.jpeg
c:\WBG\Anaconda3\envs\rtmis\Lib\site-packages\plotnine\stats\smoothers.py:330: PlotnineWarning: Confidence intervals are not yet implemented for lowess smoothings.
c:\WBG\Anaconda3\envs\rtmis\Lib\site-packages\plotnine\stats\smoothers.py:330: PlotnineWarning: Confidence intervals are not yet implemented for lowess smoothings.
c:\WBG\Anaconda3\envs\rtmis\Lib\site-packages\plotnine\ggplot.py:587: PlotnineWarning: Saving 5 x 4 in image.
c:\WBG\Anaconda3\envs\rtmis\Lib\site-packages\plotnine\ggplot.py:588: PlotnineWarning: Filename: C:/Users/WB514197/Repos/red-sea-monitoring\reports\ports\estimated-trade-port1081.jpeg
c:\WBG\Anaconda3\envs\rtmis\Lib\site-packages\plotnine\stats\smoothers.py:330: PlotnineWarning: Confidence intervals are not yet implemented for lowess smoothings.
c:\WBG\Anaconda3\envs\rtmis\Lib\site-packages\plotnine\stats\smoothers.py:330: PlotnineWarning: Confidence intervals are not yet implemented for lowess smoothings.
c:\WBG\Anaconda3\envs\rtmis\Lib\site-packages\plotnine\ggplot.py:587: PlotnineWarning: Saving 5 x 4 in image.
c:\WBG\Anaconda3\envs\rtmis\Lib\site-packages\plotnine\ggplot.py:588: PlotnineWarning: Filename: C:/Users/WB514197/Repos/red-sea-monitoring\reports\ports\estimated-trade-port191.jpeg
c:\WBG\Anaconda3\envs\rtmis\Lib\site-packages\plotnine\stats\smoothers.py:330: PlotnineWarning: Confidence intervals are not yet implemented for lowess smoothings.
c:\WBG\Anaconda3\envs\rtmis\Lib\site-packages\plotnine\stats\smoothers.py:330: PlotnineWarning: Confidence intervals are not yet implemented for lowess smoothings.
c:\WBG\Anaconda3\envs\rtmis\Lib\site-packages\plotnine\ggplot.py:587: PlotnineWarning: Saving 5 x 4 in image.
c:\WBG\Anaconda3\envs\rtmis\Lib\site-packages\plotnine\ggplot.py:588: PlotnineWarning: Filename: C:/Users/WB514197/Repos/red-sea-monitoring\reports\ports\estimated-trade-port519.jpeg
c:\WBG\Anaconda3\envs\rtmis\Lib\site-packages\plotnine\stats\smoothers.py:330: PlotnineWarning: Confidence intervals are not yet implemented for lowess smoothings.
c:\WBG\Anaconda3\envs\rtmis\Lib\site-packages\plotnine\stats\smoothers.py:330: PlotnineWarning: Confidence intervals are not yet implemented for lowess smoothings.
c:\WBG\Anaconda3\envs\rtmis\Lib\site-packages\plotnine\ggplot.py:587: PlotnineWarning: Saving 5 x 4 in image.
c:\WBG\Anaconda3\envs\rtmis\Lib\site-packages\plotnine\ggplot.py:588: PlotnineWarning: Filename: C:/Users/WB514197/Repos/red-sea-monitoring\reports\ports\estimated-trade-port1408.jpeg
c:\WBG\Anaconda3\envs\rtmis\Lib\site-packages\plotnine\stats\smoothers.py:330: PlotnineWarning: Confidence intervals are not yet implemented for lowess smoothings.
c:\WBG\Anaconda3\envs\rtmis\Lib\site-packages\plotnine\stats\smoothers.py:330: PlotnineWarning: Confidence intervals are not yet implemented for lowess smoothings.
Resample to Monthly#
df = (
    df_raw.groupby(["portname", "portid"])[
        [
            "portcalls_cargo",
            "portcalls_tanker",
            "portcalls",
            "import_cargo",
            "export_cargo",
            "import_tanker",
            "export_tanker",
            "import",
            "export",
            "date",
        ]
    ]
    .resample("MS", on="date")
    .sum()
    .reset_index()
)
df.loc[:, "ymd"] = df.date.dt.strftime("%Y-%m-%d")
df.loc[:, "m"] = df.date.dt.strftime("%m")
df = df.loc[df.date < "2024-10-01"].copy()
Calculate Reference Values#
Periods
Baseline: 2021, 2022, 2023 (January 1st – October 6th)
Middle East Conflict: 2023 (October 7th - November 16th)
Red Sea Crisis: November 17th - January 31st, 2024
start_reference_date = "2022-01-01"
conflict_date = "2023-10-07"
crisis_date = "2023-11-17"
df_ref = df.loc[(df.date >= start_reference_date) & (df.date < conflict_date)].copy()
df_ref = (
    df_ref.groupby(["portid", "portname", "m"])[
        [
            "portcalls_cargo",
            "portcalls_tanker",
            "portcalls",
            "import_cargo",
            "export_cargo",
            "import_tanker",
            "export_tanker",
            "import",
            "export",
        ]
    ]
    .mean()
    .reset_index()
)
df_ref.rename(
    columns={
        "portcalls_cargo": "portcalls_cargo_ref",
        "portcalls_tanker": "portcalls_tanker_ref",
        "portcalls": "portcalls_ref",
        "import_cargo": "import_cargo_ref",
        "export_cargo": "export_cargo_ref",
        "import_tanker": "import_tanker_ref",
        "export_tanker": "export_tanker_ref",
        "import": "import_ref",
        "export": "export_ref",
    },
    inplace=True,
)
Filter recent data (2023 onwards) and merge reference values.
df_filt = df.loc[(df.date >= "2023-01-01")].copy()
df_filt = df_filt.merge(
    df_ref, on=["portid", "portname", "m"], how="left", validate="m:1"
)
charts_by_port_dir = join(charts_dir, "ports-ref-monthly")
if not exists(charts_by_port_dir):
    os.makedirs(charts_by_port_dir, mode=0o777)
Plot Monthly Trade Volume and Historical Average#
for port_id in df_filt.portid.unique():
    port_info = ports_red_sea.loc[ports_red_sea.portid == port_id].iloc[0]
    country = port_info.country
    df_port = df_filt.loc[df_filt.portid == port_id].copy()
    port = df_port.iloc[0].portname
    df_port_copy = df_port.copy()
    df_port = df_port.melt(
        id_vars="date",
        value_vars=["import", "export"],
        var_name="direction",
        value_name="trade",
    )
    df_port.loc[:, "direction"] = df_port.direction.str.capitalize()
    p1 = (
        ggplot(df_port_copy, aes(x="date", y="import_ref"))  #
        + geom_bar(
            mapping=aes(x="date", y="trade", fill="direction"),
            data=df_port,
            alpha=3 / 4,
            stat="identity",
            position="dodge2",
        )  #  fill="lightblue"
        + geom_smooth(
            mapping=aes(x="date", y="import_ref"), color="#00BFC4", size=1, alpha=3 / 4
        )
        + geom_smooth(
            mapping=aes(x="date", y="export_ref"), color="#F8766D", size=1, alpha=3 / 4
        )
        # + geom_line(aes(x="date", y="export"), alpha=1, color="darkred")
        + geom_vline(xintercept=conflict_date, linetype="dashed", color="black")
        + geom_vline(xintercept=crisis_date, linetype="dashed", color="black")
        + labs(
            x="",
            y="",
            subtitle="Metric Tons",
            title=f"Monthly Trade Volume - {port}, {country}",
            fill="Trade Flow",
        )
        + theme_minimal()
        + theme(
            text=element_text(family="Roboto", size=13),
            plot_title=element_text(family="Roboto", size=16, weight="bold"),
            axis_text_x=element_text(rotation=45, hjust=1),
            legend_position="none",
        )
        + scale_x_datetime(breaks=date_breaks("2 month"), labels=date_format("%Y-%m"))
        + scale_y_continuous(labels=comma_format())
        # + scale_fill_brewer(type='qual', palette=1)
    )
    # display(p1)
    p1.save(
        filename=join(charts_by_port_dir, f"estimated-trade-{port_id}.jpeg"), dpi=300
    )
c:\WBG\Anaconda3\envs\rtmis\Lib\site-packages\plotnine\ggplot.py:587: PlotnineWarning: Saving 5 x 4 in image.
c:\WBG\Anaconda3\envs\rtmis\Lib\site-packages\plotnine\ggplot.py:588: PlotnineWarning: Filename: C:/Users/WB514197/Repos/red-sea-monitoring\reports\ports-ref-monthly\estimated-trade-port9.jpeg
c:\WBG\Anaconda3\envs\rtmis\Lib\site-packages\plotnine\stats\smoothers.py:330: PlotnineWarning: Confidence intervals are not yet implemented for lowess smoothings.
c:\WBG\Anaconda3\envs\rtmis\Lib\site-packages\plotnine\stats\smoothers.py:330: PlotnineWarning: Confidence intervals are not yet implemented for lowess smoothings.
c:\WBG\Anaconda3\envs\rtmis\Lib\site-packages\plotnine\ggplot.py:587: PlotnineWarning: Saving 5 x 4 in image.
c:\WBG\Anaconda3\envs\rtmis\Lib\site-packages\plotnine\ggplot.py:588: PlotnineWarning: Filename: C:/Users/WB514197/Repos/red-sea-monitoring\reports\ports-ref-monthly\estimated-trade-port321.jpeg
c:\WBG\Anaconda3\envs\rtmis\Lib\site-packages\plotnine\stats\smoothers.py:330: PlotnineWarning: Confidence intervals are not yet implemented for lowess smoothings.
c:\WBG\Anaconda3\envs\rtmis\Lib\site-packages\plotnine\stats\smoothers.py:330: PlotnineWarning: Confidence intervals are not yet implemented for lowess smoothings.
c:\WBG\Anaconda3\envs\rtmis\Lib\site-packages\plotnine\ggplot.py:587: PlotnineWarning: Saving 5 x 4 in image.
c:\WBG\Anaconda3\envs\rtmis\Lib\site-packages\plotnine\ggplot.py:588: PlotnineWarning: Filename: C:/Users/WB514197/Repos/red-sea-monitoring\reports\ports-ref-monthly\estimated-trade-port19.jpeg
c:\WBG\Anaconda3\envs\rtmis\Lib\site-packages\plotnine\stats\smoothers.py:330: PlotnineWarning: Confidence intervals are not yet implemented for lowess smoothings.
c:\WBG\Anaconda3\envs\rtmis\Lib\site-packages\plotnine\stats\smoothers.py:330: PlotnineWarning: Confidence intervals are not yet implemented for lowess smoothings.
c:\WBG\Anaconda3\envs\rtmis\Lib\site-packages\plotnine\ggplot.py:587: PlotnineWarning: Saving 5 x 4 in image.
c:\WBG\Anaconda3\envs\rtmis\Lib\site-packages\plotnine\ggplot.py:588: PlotnineWarning: Filename: C:/Users/WB514197/Repos/red-sea-monitoring\reports\ports-ref-monthly\estimated-trade-port27.jpeg
c:\WBG\Anaconda3\envs\rtmis\Lib\site-packages\plotnine\stats\smoothers.py:330: PlotnineWarning: Confidence intervals are not yet implemented for lowess smoothings.
c:\WBG\Anaconda3\envs\rtmis\Lib\site-packages\plotnine\stats\smoothers.py:330: PlotnineWarning: Confidence intervals are not yet implemented for lowess smoothings.
c:\WBG\Anaconda3\envs\rtmis\Lib\site-packages\plotnine\ggplot.py:587: PlotnineWarning: Saving 5 x 4 in image.
c:\WBG\Anaconda3\envs\rtmis\Lib\site-packages\plotnine\ggplot.py:588: PlotnineWarning: Filename: C:/Users/WB514197/Repos/red-sea-monitoring\reports\ports-ref-monthly\estimated-trade-port18.jpeg
c:\WBG\Anaconda3\envs\rtmis\Lib\site-packages\plotnine\stats\smoothers.py:330: PlotnineWarning: Confidence intervals are not yet implemented for lowess smoothings.
c:\WBG\Anaconda3\envs\rtmis\Lib\site-packages\plotnine\stats\smoothers.py:330: PlotnineWarning: Confidence intervals are not yet implemented for lowess smoothings.
c:\WBG\Anaconda3\envs\rtmis\Lib\site-packages\plotnine\ggplot.py:587: PlotnineWarning: Saving 5 x 4 in image.
c:\WBG\Anaconda3\envs\rtmis\Lib\site-packages\plotnine\ggplot.py:588: PlotnineWarning: Filename: C:/Users/WB514197/Repos/red-sea-monitoring\reports\ports-ref-monthly\estimated-trade-port71.jpeg
c:\WBG\Anaconda3\envs\rtmis\Lib\site-packages\plotnine\stats\smoothers.py:330: PlotnineWarning: Confidence intervals are not yet implemented for lowess smoothings.
c:\WBG\Anaconda3\envs\rtmis\Lib\site-packages\plotnine\stats\smoothers.py:330: PlotnineWarning: Confidence intervals are not yet implemented for lowess smoothings.
c:\WBG\Anaconda3\envs\rtmis\Lib\site-packages\plotnine\ggplot.py:587: PlotnineWarning: Saving 5 x 4 in image.
c:\WBG\Anaconda3\envs\rtmis\Lib\site-packages\plotnine\ggplot.py:588: PlotnineWarning: Filename: C:/Users/WB514197/Repos/red-sea-monitoring\reports\ports-ref-monthly\estimated-trade-port294.jpeg
c:\WBG\Anaconda3\envs\rtmis\Lib\site-packages\plotnine\stats\smoothers.py:330: PlotnineWarning: Confidence intervals are not yet implemented for lowess smoothings.
c:\WBG\Anaconda3\envs\rtmis\Lib\site-packages\plotnine\stats\smoothers.py:330: PlotnineWarning: Confidence intervals are not yet implemented for lowess smoothings.
c:\WBG\Anaconda3\envs\rtmis\Lib\site-packages\plotnine\ggplot.py:587: PlotnineWarning: Saving 5 x 4 in image.
c:\WBG\Anaconda3\envs\rtmis\Lib\site-packages\plotnine\ggplot.py:588: PlotnineWarning: Filename: C:/Users/WB514197/Repos/red-sea-monitoring\reports\ports-ref-monthly\estimated-trade-port304.jpeg
c:\WBG\Anaconda3\envs\rtmis\Lib\site-packages\plotnine\stats\smoothers.py:330: PlotnineWarning: Confidence intervals are not yet implemented for lowess smoothings.
c:\WBG\Anaconda3\envs\rtmis\Lib\site-packages\plotnine\stats\smoothers.py:330: PlotnineWarning: Confidence intervals are not yet implemented for lowess smoothings.
c:\WBG\Anaconda3\envs\rtmis\Lib\site-packages\plotnine\ggplot.py:587: PlotnineWarning: Saving 5 x 4 in image.
c:\WBG\Anaconda3\envs\rtmis\Lib\site-packages\plotnine\ggplot.py:588: PlotnineWarning: Filename: C:/Users/WB514197/Repos/red-sea-monitoring\reports\ports-ref-monthly\estimated-trade-port305.jpeg
c:\WBG\Anaconda3\envs\rtmis\Lib\site-packages\plotnine\stats\smoothers.py:330: PlotnineWarning: Confidence intervals are not yet implemented for lowess smoothings.
c:\WBG\Anaconda3\envs\rtmis\Lib\site-packages\plotnine\stats\smoothers.py:330: PlotnineWarning: Confidence intervals are not yet implemented for lowess smoothings.
c:\WBG\Anaconda3\envs\rtmis\Lib\site-packages\plotnine\ggplot.py:587: PlotnineWarning: Saving 5 x 4 in image.
c:\WBG\Anaconda3\envs\rtmis\Lib\site-packages\plotnine\ggplot.py:588: PlotnineWarning: Filename: C:/Users/WB514197/Repos/red-sea-monitoring\reports\ports-ref-monthly\estimated-trade-port828.jpeg
c:\WBG\Anaconda3\envs\rtmis\Lib\site-packages\plotnine\stats\smoothers.py:330: PlotnineWarning: Confidence intervals are not yet implemented for lowess smoothings.
c:\WBG\Anaconda3\envs\rtmis\Lib\site-packages\plotnine\stats\smoothers.py:330: PlotnineWarning: Confidence intervals are not yet implemented for lowess smoothings.
c:\WBG\Anaconda3\envs\rtmis\Lib\site-packages\plotnine\ggplot.py:587: PlotnineWarning: Saving 5 x 4 in image.
c:\WBG\Anaconda3\envs\rtmis\Lib\site-packages\plotnine\ggplot.py:588: PlotnineWarning: Filename: C:/Users/WB514197/Repos/red-sea-monitoring\reports\ports-ref-monthly\estimated-trade-port518.jpeg
c:\WBG\Anaconda3\envs\rtmis\Lib\site-packages\plotnine\stats\smoothers.py:330: PlotnineWarning: Confidence intervals are not yet implemented for lowess smoothings.
c:\WBG\Anaconda3\envs\rtmis\Lib\site-packages\plotnine\stats\smoothers.py:330: PlotnineWarning: Confidence intervals are not yet implemented for lowess smoothings.
c:\WBG\Anaconda3\envs\rtmis\Lib\site-packages\plotnine\ggplot.py:587: PlotnineWarning: Saving 5 x 4 in image.
c:\WBG\Anaconda3\envs\rtmis\Lib\site-packages\plotnine\ggplot.py:588: PlotnineWarning: Filename: C:/Users/WB514197/Repos/red-sea-monitoring\reports\ports-ref-monthly\estimated-trade-port570.jpeg
c:\WBG\Anaconda3\envs\rtmis\Lib\site-packages\plotnine\stats\smoothers.py:330: PlotnineWarning: Confidence intervals are not yet implemented for lowess smoothings.
c:\WBG\Anaconda3\envs\rtmis\Lib\site-packages\plotnine\stats\smoothers.py:330: PlotnineWarning: Confidence intervals are not yet implemented for lowess smoothings.
c:\WBG\Anaconda3\envs\rtmis\Lib\site-packages\plotnine\ggplot.py:587: PlotnineWarning: Saving 5 x 4 in image.
c:\WBG\Anaconda3\envs\rtmis\Lib\site-packages\plotnine\ggplot.py:588: PlotnineWarning: Filename: C:/Users/WB514197/Repos/red-sea-monitoring\reports\ports-ref-monthly\estimated-trade-port1081.jpeg
c:\WBG\Anaconda3\envs\rtmis\Lib\site-packages\plotnine\stats\smoothers.py:330: PlotnineWarning: Confidence intervals are not yet implemented for lowess smoothings.
c:\WBG\Anaconda3\envs\rtmis\Lib\site-packages\plotnine\stats\smoothers.py:330: PlotnineWarning: Confidence intervals are not yet implemented for lowess smoothings.
c:\WBG\Anaconda3\envs\rtmis\Lib\site-packages\plotnine\ggplot.py:587: PlotnineWarning: Saving 5 x 4 in image.
c:\WBG\Anaconda3\envs\rtmis\Lib\site-packages\plotnine\ggplot.py:588: PlotnineWarning: Filename: C:/Users/WB514197/Repos/red-sea-monitoring\reports\ports-ref-monthly\estimated-trade-port191.jpeg
c:\WBG\Anaconda3\envs\rtmis\Lib\site-packages\plotnine\stats\smoothers.py:330: PlotnineWarning: Confidence intervals are not yet implemented for lowess smoothings.
c:\WBG\Anaconda3\envs\rtmis\Lib\site-packages\plotnine\stats\smoothers.py:330: PlotnineWarning: Confidence intervals are not yet implemented for lowess smoothings.
c:\WBG\Anaconda3\envs\rtmis\Lib\site-packages\plotnine\ggplot.py:587: PlotnineWarning: Saving 5 x 4 in image.
c:\WBG\Anaconda3\envs\rtmis\Lib\site-packages\plotnine\ggplot.py:588: PlotnineWarning: Filename: C:/Users/WB514197/Repos/red-sea-monitoring\reports\ports-ref-monthly\estimated-trade-port519.jpeg
c:\WBG\Anaconda3\envs\rtmis\Lib\site-packages\plotnine\stats\smoothers.py:330: PlotnineWarning: Confidence intervals are not yet implemented for lowess smoothings.
c:\WBG\Anaconda3\envs\rtmis\Lib\site-packages\plotnine\stats\smoothers.py:330: PlotnineWarning: Confidence intervals are not yet implemented for lowess smoothings.
c:\WBG\Anaconda3\envs\rtmis\Lib\site-packages\plotnine\ggplot.py:587: PlotnineWarning: Saving 5 x 4 in image.
c:\WBG\Anaconda3\envs\rtmis\Lib\site-packages\plotnine\ggplot.py:588: PlotnineWarning: Filename: C:/Users/WB514197/Repos/red-sea-monitoring\reports\ports-ref-monthly\estimated-trade-port1408.jpeg
c:\WBG\Anaconda3\envs\rtmis\Lib\site-packages\plotnine\stats\smoothers.py:330: PlotnineWarning: Confidence intervals are not yet implemented for lowess smoothings.
c:\WBG\Anaconda3\envs\rtmis\Lib\site-packages\plotnine\stats\smoothers.py:330: PlotnineWarning: Confidence intervals are not yet implemented for lowess smoothings.
Summary Statistics#
Calculate average values by port and time period.
conflict_date, crisis_date
('2023-10-07', '2023-11-17')
df.loc[:, "period"] = ""
df.loc[
    (df.date >= start_reference_date) & (df.date < crisis_date), "period"
] = "Reference"
df.loc[
    (df.date >= conflict_date) & (df.date < crisis_date), "period"
] = "Middle East Conflict"
df.loc[(df.date >= crisis_date), "period"] = "Red Sea Crisis"
df = df.merge(ports_red_sea[["portid", "country"]], on="portid")
df_agg = (
    df.loc[df.period != ""]
    .groupby(["country", "portname", "period"])[
        [
            "import_cargo",
            "export_cargo",
            "import_tanker",
            "export_tanker",
            "import",
            "export",
        ]
    ]
    .mean()
)

# change order of rows
df_agg = df_agg.reindex(
    ["Reference", "Middle East Conflict", "Red Sea Crisis"], level=2
)
from itables import init_notebook_mode

init_notebook_mode(all_interactive=True)
Table: Monthly Average Values by Time Period#
table = df_agg.copy()
table = table.applymap(lambda x: "{:,.0f}".format(x))
table.rename(
    columns={
        "import_cargo": "Cargo Import",
        "export_cargo": "Cargo Export",
        "import_tanker": "Tanker Import",
        "export_tanker": "Tanker Export",
        "import": "Total Import",
        "export": "Total Export",
    },
    inplace=True,
)
table.index.names = ["Country", "Port", "Period"]
table
C:\Users\WB514197\AppData\Local\Temp\ipykernel_6568\528398492.py:2: FutureWarning: DataFrame.applymap has been deprecated. Use DataFrame.map instead.
| Cargo Import | Cargo Export | Tanker Import | Tanker Export | Total Import | Total Export | |||
|---|---|---|---|---|---|---|---|---|
| Country | Port | Period | ||||||
| Loading... (need help?) |
countries = list(df.country.unique())
df_agg_copy = df_agg.copy()
res = []
for country in countries:
    df_country = df_agg_copy.loc[(country), :].copy()
    aois = df_country.index.get_level_values(0).unique()
    for aoi in aois:
        df_sub = df_country.loc[(aoi), :].transpose().copy()
        df_sub.loc[:, "Middle East Conflict"] = (
            df_sub.loc[:, "Middle East Conflict"] - df_sub.loc[:, "Reference"]
        ) / df_sub.loc[:, "Reference"]
        df_sub.loc[:, "Red Sea Crisis"] = (
            df_sub.loc[:, "Red Sea Crisis"] - df_sub.loc[:, "Reference"]
        ) / df_sub.loc[:, "Reference"]
        df_sub2 = df_sub.transpose()
        df_sub2.drop("Reference", inplace=True)
        df_sub2.loc[:, "portname"] = aoi
        df_sub2.loc[:, "country"] = country
        res.append(df_sub2)
df_agg_pct = pd.concat(res)
table2 = df_agg_pct.copy()
Table: Monthly Average Values by Time Period, % Change from Baseline#
table2.reset_index(inplace=True)
table2.set_index(["country", "portname", "period"], inplace=True)

# format columns as pct
table2 = table2.applymap(lambda x: "{:.2%}".format(x))
table2.rename(
    columns={
        "import_cargo": "Cargo Import",
        "export_cargo": "Cargo Export",
        "import_tanker": "Tanker Import",
        "export_tanker": "Tanker Export",
        "import": "Total Import",
        "export": "Total Export",
    },
    inplace=True,
)
table2.index.names = ["Country", "Port", "Period"]
table2
C:\Users\WB514197\AppData\Local\Temp\ipykernel_6568\1744506812.py:5: FutureWarning: DataFrame.applymap has been deprecated. Use DataFrame.map instead.
| Cargo Import | Cargo Export | Tanker Import | Tanker Export | Total Import | Total Export | |||
|---|---|---|---|---|---|---|---|---|
| Country | Port | Period | ||||||
| Loading... (need help?) |
Parade Chart: Absolute Differences#
countries = list(df.country.unique())
df_agg_copy = df_agg.copy()
res = []
for country in countries:
    df_country = df_agg_copy.loc[(country), :].copy()
    aois = df_country.index.get_level_values(0).unique()
    for aoi in aois:
        df_sub = df_country.loc[(aoi), :].transpose().copy()
        df_sub.loc[:, "Middle East Conflict"] = (
            df_sub.loc[:, "Middle East Conflict"] - df_sub.loc[:, "Reference"]
        )
        df_sub.loc[:, "Red Sea Crisis"] = (
            df_sub.loc[:, "Red Sea Crisis"] - df_sub.loc[:, "Reference"]
        )
        df_sub2 = df_sub.transpose()
        df_sub2.drop("Reference", inplace=True)
        df_sub2.loc[:, "portname"] = aoi
        df_sub2.loc[:, "country"] = country
        res.append(df_sub2)
df_agg_diff = pd.concat(res)
df_agg_diff = df_agg_diff.reset_index()
df_agg_diff = df_agg_diff.loc[df_agg_diff.period == "Red Sea Crisis"].copy()

df_agg_diff.loc[:, "import_direction"] = df_agg_diff["import"].apply(
    lambda x: "Increase" if x > 0 else "Decrease"
)
df_agg_diff.loc[:, "export_direction"] = df_agg_diff["export"].apply(
    lambda x: "Increase" if x > 0 else "Decrease"
)

df_agg_diff.loc[:, "import_absolute"] = df_agg_diff["import"].apply(lambda x: abs(x))
df_agg_diff.loc[:, "export_absolute"] = df_agg_diff["export"].apply(lambda x: abs(x))

df_agg_diff.sort_values("import_absolute", ascending=False, inplace=True)
df_agg_diff["portname_cat"] = pd.Categorical(
    df_agg_diff.portname, categories=pd.unique(df_agg_diff.portname)
)
plotnine.options.figure_size = (8, 6)
# plotnine.options.figure_size = (5, 4)
p2 = (
    ggplot(df_agg_diff, aes(x="portname_cat", y="import", fill="import_direction"))  #
    + geom_bar(
        alpha=3 / 4,
        stat="identity",
        position="dodge2",
    )
    + labs(
        x="",
        y="",
        title="Difference in Import Volume during Red Sea Crisis",
        subtitle="Difference in Metric Tons Relative to Baseline (Jan 2022 - Oct 2023)",
        caption="Calculated using monthly averages up to March 2024",
        # caption="Calculated using monthly averages during Red Sea Crisis \n(Oct, 2023 - Mar 2024) and baseline period (Jan 2022 - Oct 2023)",
    )
    + theme_minimal()
    + theme(
        text=element_text(family="Roboto", size=13),
        plot_title=element_text(family="Roboto", size=16, weight="bold"),
        axis_text_x=element_text(rotation=45, hjust=1),
        legend_position="none",
    )
    + scale_y_continuous(labels=comma_format())
    + scale_fill_manual(values=["#d73027", "#1a9850"])
)
display(p2)
p2.save(filename=join(charts_dir, "import-difference.jpeg"), dpi=300)

<Figure Size: (800 x 600)>
c:\WBG\Anaconda3\envs\rtmis\Lib\site-packages\plotnine\ggplot.py:587: PlotnineWarning: Saving 8 x 6 in image.
c:\WBG\Anaconda3\envs\rtmis\Lib\site-packages\plotnine\ggplot.py:588: PlotnineWarning: Filename: C:/Users/WB514197/Repos/red-sea-monitoring\reports\import-difference.jpeg
df_agg_diff.sort_values("export_absolute", ascending=False, inplace=True)
df_agg_diff["portname_cat"] = pd.Categorical(
    df_agg_diff.portname, categories=pd.unique(df_agg_diff.portname)
)
p2 = (
    ggplot(df_agg_diff, aes(x="portname_cat", y="export", fill="export_direction"))  #
    + geom_bar(
        alpha=3 / 4,
        stat="identity",
        position="dodge2",
    )  #  fill="lightblue"
    + labs(
        x="",
        y="",
        subtitle="Difference in Metric Tons Relative to Baseline (Jan 2022 - Oct 2023)",
        title="Difference in Export Volume during Red Sea Crisis",
        caption="Calculated using monthly averages up to March 2024",
        # caption="Calculated using monthly averages during Red Sea Crisis \n(Oct, 2023 - Mar 2024) and baseline period (Jan 2022 - Oct 2023)",
    )
    + theme_minimal()
    + theme(
        text=element_text(family="Roboto", size=13),
        plot_title=element_text(family="Roboto", size=16, weight="bold"),
        axis_text_x=element_text(rotation=45, hjust=1),
        legend_position="none",
    )
    + scale_y_continuous(labels=comma_format())
    + scale_fill_manual(values=["#d73027", "#1a9850"])
)
display(p2)
p2.save(filename=join(charts_dir, "export-difference.jpeg"), dpi=300)

<Figure Size: (800 x 600)>
c:\WBG\Anaconda3\envs\rtmis\Lib\site-packages\plotnine\ggplot.py:587: PlotnineWarning: Saving 8 x 6 in image.
c:\WBG\Anaconda3\envs\rtmis\Lib\site-packages\plotnine\ggplot.py:588: PlotnineWarning: Filename: C:/Users/WB514197/Repos/red-sea-monitoring\reports\export-difference.jpeg
Parade Chart % Diff#
df_agg_pct_raw = df_agg_pct.reset_index()
df_agg_pct_raw = df_agg_pct_raw.loc[df_agg_pct_raw.period == "Red Sea Crisis"].copy()

df_agg_pct_raw.loc[:, "import_direction"] = df_agg_pct_raw["import"].apply(
    lambda x: "Increase" if x > 0 else "Decrease"
)
df_agg_pct_raw.loc[:, "export_direction"] = df_agg_pct_raw["export"].apply(
    lambda x: "Increase" if x > 0 else "Decrease"
)

df_agg_pct_raw.loc[:, "import_absolute"] = df_agg_pct_raw["import"].apply(
    lambda x: abs(x)
)
df_agg_pct_raw.loc[:, "export_absolute"] = df_agg_pct_raw["export"].apply(
    lambda x: abs(x)
)

df_agg_pct_raw.sort_values("import_absolute", ascending=False, inplace=True)
df_agg_pct_raw["portname_cat"] = pd.Categorical(
    df_agg_diff.portname, categories=pd.unique(df_agg_diff.portname)
)
p3 = (
    ggplot(
        df_agg_pct_raw, aes(x="portname_cat", y="import", fill="import_direction")
    )  #
    + geom_bar(
        alpha=3 / 4,
        stat="identity",
        position="dodge2",
    )  #  fill="lightblue"
    + labs(
        x="",
        y="",
        title="Percent Change in Import Volume during Red Sea Crisis)",
        subtitle="% Change Relative to Baseline (Jan 2022 - Oct 2023)",
        caption="Calculated using monthly averages up to March 2024",
    )
    + theme_minimal()
    + theme(
        text=element_text(family="Roboto", size=13),
        plot_title=element_text(family="Roboto", size=16, weight="bold"),
        axis_text_x=element_text(rotation=45, hjust=1),
        legend_position="none",
    )
    + scale_y_continuous(labels=percent_format())
    + scale_fill_manual(values=["#d73027", "#1a9850"])
)
display(p3)
p3.save(filename=join(charts_dir, "import-pct-change.jpeg"), dpi=300)

<Figure Size: (800 x 600)>
c:\WBG\Anaconda3\envs\rtmis\Lib\site-packages\plotnine\ggplot.py:587: PlotnineWarning: Saving 8 x 6 in image.
c:\WBG\Anaconda3\envs\rtmis\Lib\site-packages\plotnine\ggplot.py:588: PlotnineWarning: Filename: C:/Users/WB514197/Repos/red-sea-monitoring\reports\import-pct-change.jpeg
df_agg_pct_raw.sort_values("export_absolute", ascending=False, inplace=True)
df_agg_pct_raw["portname_cat"] = pd.Categorical(
    df_agg_diff.portname, categories=pd.unique(df_agg_diff.portname)
)
p4 = (
    ggplot(
        df_agg_pct_raw, aes(x="portname_cat", y="export", fill="export_direction")
    )  #
    + geom_bar(
        alpha=3 / 4,
        stat="identity",
        position="dodge2",
    )  #  fill="lightblue"
    + labs(
        x="",
        y="",
        title="Percent Change in Export Volume during Red Sea Crisis",
        subtitle="% Change Relative to Baseline (Jan 2022 - Oct 2023)",
        caption="Calculated using monthly averages up to March 2024",
        # caption="Calculated using monthly averages during Red Sea Crisis \n(Oct, 2023 - Mar 2024) and baseline period (Jan 2022 - Oct 2023)"
    )
    + theme_minimal()
    + theme(
        text=element_text(family="Roboto", size=13),
        plot_title=element_text(family="Roboto", size=16, weight="bold"),
        axis_text_x=element_text(rotation=45, hjust=1),
        legend_position="none",
    )
    + scale_y_continuous(labels=percent_format())
    + scale_fill_manual(values=["#d73027", "#1a9850"])
)
display(p4)
p4.save(filename=join(charts_dir, "export-pct-change.jpeg"), dpi=300)

<Figure Size: (800 x 600)>
c:\WBG\Anaconda3\envs\rtmis\Lib\site-packages\plotnine\ggplot.py:587: PlotnineWarning: Saving 8 x 6 in image.
c:\WBG\Anaconda3\envs\rtmis\Lib\site-packages\plotnine\ggplot.py:588: PlotnineWarning: Filename: C:/Users/WB514197/Repos/red-sea-monitoring\reports\export-pct-change.jpeg
Save tables with and without formatting
df_agg = df_agg.reset_index()
df_agg_pct = df_agg_pct.reset_index()

df_agg_pct = df_agg_pct[
    [
        "country",
        "portname",
        "period",
        "import_cargo",
        "export_cargo",
        "import_tanker",
        "export_tanker",
        "import",
        "export",
    ]
]
df_agg.rename(
    columns={
        "country": "Country",
        "portname": "Port",
        "period": "Period",
        "import_cargo": "Cargo Import",
        "export_cargo": "Cargo Export",
        "import_tanker": "Tanker Import",
        "export_tanker": "Tanker Export",
        "import": "Total Import",
        "export": "Total Export",
    },
    inplace=True,
)
df_agg_pct.rename(
    columns={
        "country": "Country",
        "portname": "Port",
        "period": "Period",
        "import_cargo": "Cargo Import",
        "export_cargo": "Cargo Export",
        "import_tanker": "Tanker Import",
        "export_tanker": "Tanker Export",
        "import": "Total Import",
        "export": "Total Export",
    },
    inplace=True,
)
with pd.ExcelWriter(
    join(output_dir, "tables", f'summary-tables-ports-{time.strftime("%Y_%m_%d")}.xlsx')
) as writer:
    table.to_excel(writer, sheet_name="Ports Summary")
    table2.to_excel(writer, sheet_name="Ports % Change")
    df_agg.to_excel(writer, sheet_name="Ports Summary (Raw)")
    df_agg_pct.to_excel(writer, sheet_name="Ports % Change (Raw)")
