Choke Point Notebook#
The objective of this analysis is to examine the impact of the Red Sea Conflict on maritime trade statistics derived from AIS data.
We process transit calls and estimated trade volume from the IMF’s PortWatch platform for key areas of interest. We then produce charts to inspect trends and calculate percentage changes from a historical baseline.
Setup#
Import libraries and define output paths to save graphs and tables.
import os
from os.path import join, exists

import pandas as pd
import geopandas as gpd
from shapely.geometry import Point

import git
import time

git_repo = git.Repo(os.getcwd(), search_parent_directories=True)
git_root = git_repo.git.rev_parse("--show-toplevel")
from red_sea_monitoring.utils import *

# For plotting
from plotnine import *
from mizani.breaks import date_breaks
from mizani.formatters import date_format, percent_format
import plotnine

# plotnine.options.figure_size = (10, 8)
plotnine.options.figure_size = (5, 4)

output_dir = (
    r"C:\Users\WB514197\WBG\Development Data Partnership - Red Sea Maritime Monitoring"
)
charts_dir = join(git_root, "reports")
Data#
Locations#
Retrieve chokopoints locations dataset and select the three areas of interest.
chokepoints = get_chokepoints()

# List areas of interest
aois = ["Bab el-Mandeb Strait", "Cape of Good Hope", "Suez Canal", "Strait of Hormuz"]

chokepoints_sel = chokepoints.loc[chokepoints.portname.isin(aois)].copy()
chokepoints_sel
| portid | portname | country | ISO3 | continent | fullname | lat | lon | vessel_count_total | vessel_count_container | ... | vessel_count_tanker | industry_top1 | industry_top2 | industry_top3 | share_country_maritime_import | share_country_maritime_export | LOCODE | pageid | countrynoaccents | ObjectId | |
|---|---|---|---|---|---|---|---|---|---|---|---|---|---|---|---|---|---|---|---|---|---|
| 0 | chokepoint1 | Suez Canal | None | None | None | Suez Canal | 30.593346 | 32.436882 | 22217 | 6455 | ... | 6919 | Mineral Products | Vegetable Products | Chemical & Allied Industries | None | None | None | c57c79bf612b4372b08a9c6ea9c97ef0 | None | 1 |
| 3 | chokepoint4 | Bab el-Mandeb Strait | None | None | None | Bab el-Mandeb Strait | 12.788597 | 43.349545 | 22519 | 6280 | ... | 7386 | Mineral Products | Chemical & Allied Industries | Vegetable Products | None | None | None | 6b1814d64903461b98144a6cc25eb79c | None | 4 |
| 5 | chokepoint6 | Strait of Hormuz | None | None | None | Strait of Hormuz | 26.296853 | 56.859848 | 34177 | 5140 | ... | 21148 | Mineral Products | Chemical & Allied Industries | Vegetable Products | None | None | None | cb5856222a5b4105adc6ee7e880a1730 | None | 6 |
| 6 | chokepoint7 | Cape of Good Hope | None | None | None | Cape of Good Hope | -34.927286 | 20.882737 | 17332 | 2018 | ... | 3973 | Mineral Products | Vegetable Products | Prepared Foodstuffs & Beverages | None | None | None | edf18f455a2b4637a3632b6af201abe9 | None | 7 |
4 rows × 23 columns
chokepoints_sel.loc[:, "geometry"] = chokepoints_sel.apply(
    lambda x: Point(x.lon, x.lat), axis=1
)
chokepoints_sel = gpd.GeoDataFrame(
    chokepoints_sel, geometry="geometry", crs="EPSG:4326"
)
# chokepoints_sel.to_file(join(output_dir, "chokepoints.shp"), driver='ESRI Shapefile')
Map of Choke Points#
chokepoints_sel[
    [
        "geometry",
        "portname",
        "vessel_count_total",
        "vessel_count_container",
        "vessel_count_dry_bulk",
        "vessel_count_general_cargo",
        "vessel_count_RoRo",
        "vessel_count_tanker",
        "industry_top1",
        "industry_top2",
        "industry_top3",
    ]
].explore(
    column="portname",
    cmap="Dark2",
    marker_kwds={"radius": 15},
    tiles="Esri Ocean Basemap",
    legend_kwds={"loc": "upper right", "caption": "Choke Points"},
)
AIS Data#
Pull AIS data for selected locations.
output_dir
'C:\\Users\\WB514197\\WBG\\Development Data Partnership - Red Sea Maritime Monitoring'
ids = list(chokepoints_sel.portid)
df_chokepoints = get_chokepoint_data(ids)
df_chokepoints.loc[:, "ymd"] = df_chokepoints.date.dt.strftime("%Y-%m-%d")
df_chokepoints.to_csv(
    join(
        output_dir,
        "data",
        "PortWatch-data",
        f'chokepoints_data_{time.strftime("%Y_%m_%d")}.csv',
    ),
    index=False,
)
Data Analysis#
Data Smoothening#
# df = pd.read_csv(join(output_dir, f'chokepoints_data_{time.strftime("%m_%d_%Y")}.csv'))
df = pd.read_csv(
    join(
        output_dir,
        "data",
        "PortWatch-data",
        f'chokepoints_data_{time.strftime("%Y_%m_%d")}.csv',
    )
)
df.date = pd.to_datetime(df.date)
df = df.loc[df.date >= "2019-01-01"].copy()
df.tail(2)
| date | year | month | day | portid | portname | n_container | n_dry_bulk | n_general_cargo | n_roro | ... | n_total | capacity_container | capacity_dry_bulk | capacity_general_cargo | capacity_roro | capacity_tanker | capacity_cargo | capacity | ObjectId | ymd | |
|---|---|---|---|---|---|---|---|---|---|---|---|---|---|---|---|---|---|---|---|---|---|
| 8398 | 2024-09-28 20:00:00 | 2024 | 9 | 29 | chokepoint7 | Cape of Good Hope | 4 | 29 | 1 | 0 | ... | 50 | 670484.409484 | 2.489614e+06 | 5845.416104 | 0.0 | 1.278569e+06 | 3.165944e+06 | 4.444513e+06 | 46205 | 2024-09-28 |
| 8399 | 2024-09-29 20:00:00 | 2024 | 9 | 30 | chokepoint7 | Cape of Good Hope | 2 | 17 | 1 | 0 | ... | 30 | 148947.124463 | 1.596359e+06 | 8962.110837 | 0.0 | 9.289129e+05 | 1.754269e+06 | 2.683182e+06 | 46206 | 2024-09-29 |
2 rows × 22 columns
Calculate 7-day rolling average and create month-day attribute.
df = (
    df.groupby("portname")[["n_tanker", "n_cargo", "n_total", "capacity", "date"]]
    .rolling(7, center=True, min_periods=1, on="date")
    .mean()
)
df.reset_index(inplace=True)
df.drop("level_1", axis=1, inplace=True)
df.loc[:, "ymd"] = df.date.dt.strftime("%Y-%m-%d")
df.loc[:, "md"] = df.date.dt.strftime("%m-%d")
df.head(2)
| portname | capacity | n_cargo | n_tanker | n_total | date | ymd | md | |
|---|---|---|---|---|---|---|---|---|
| 0 | Bab el-Mandeb Strait | 3.888476e+06 | 42.0 | 18.25 | 60.25 | 2019-01-01 19:00:00 | 2019-01-01 | 01-01 |
| 1 | Bab el-Mandeb Strait | 3.866908e+06 | 40.6 | 18.20 | 58.80 | 2019-01-02 19:00:00 | 2019-01-02 | 01-02 |
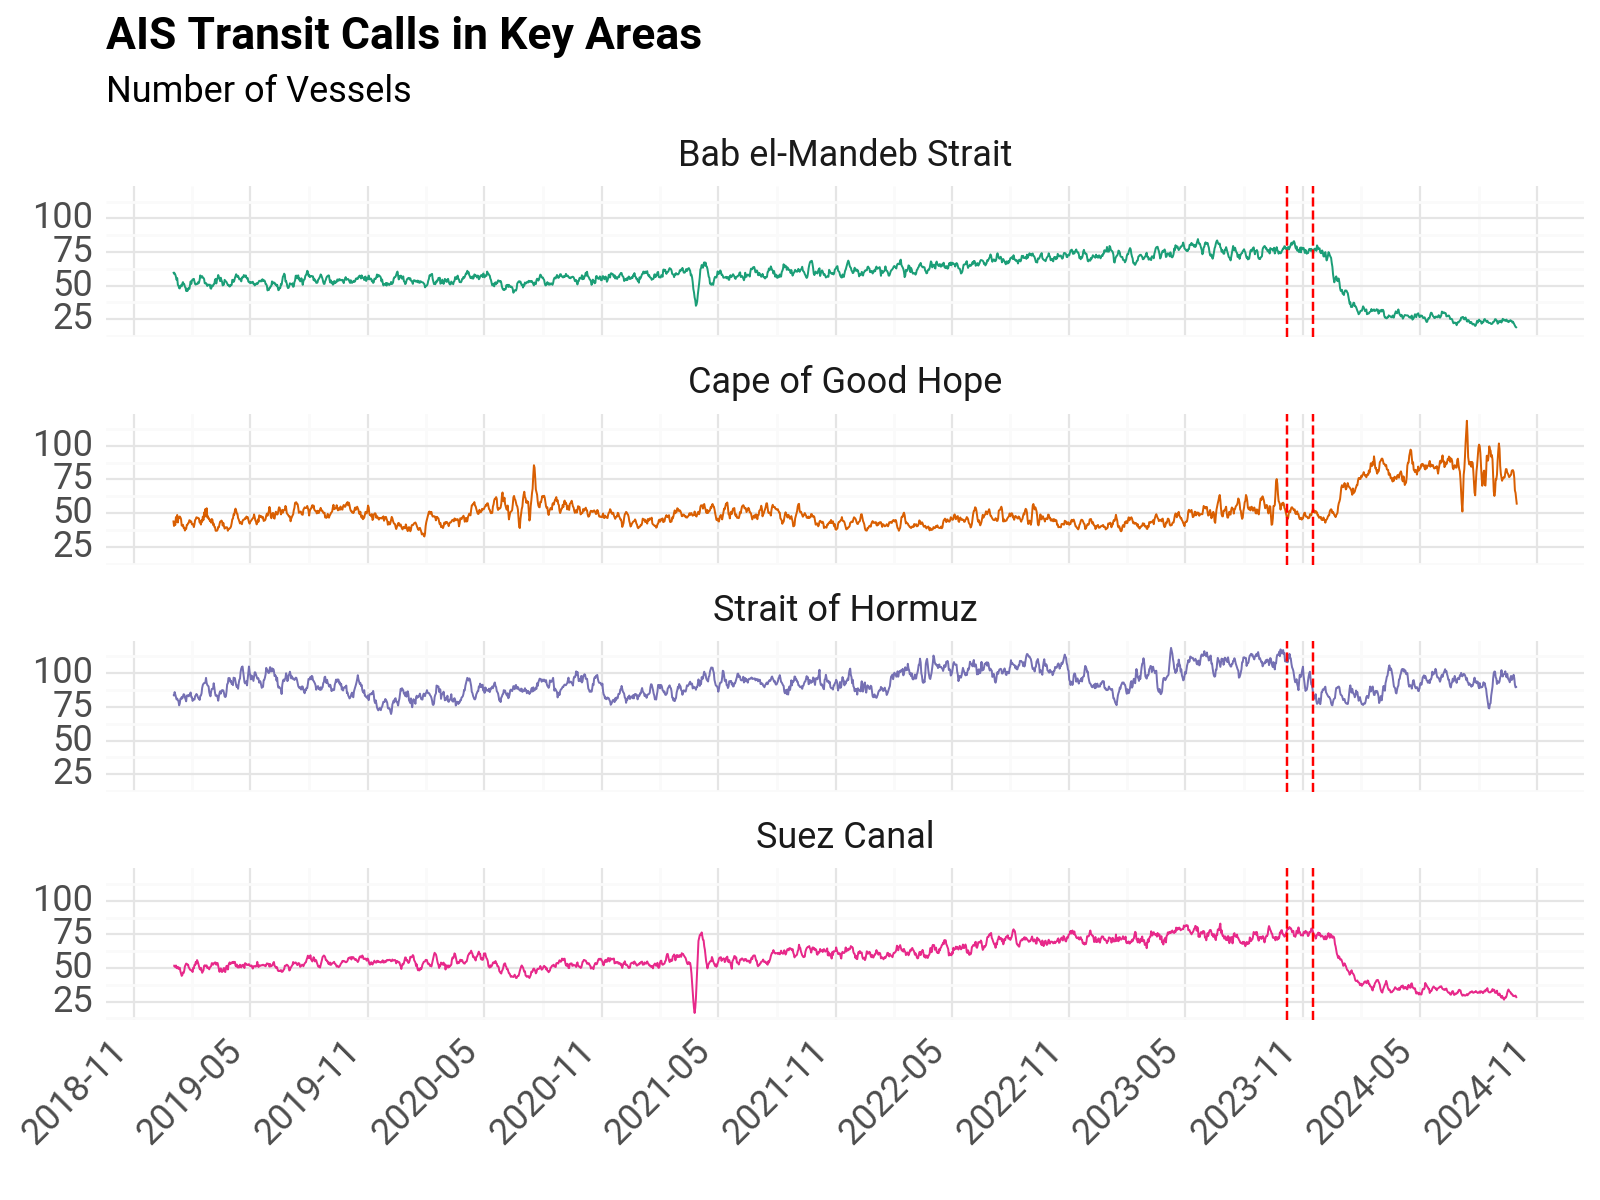
Figure: AIS Transit Calls in Key Areas, Historical#
conflict_date = "2023-10-07"
crisis_date = "2023-11-17"
if not exists(join(charts_dir, "chokepoints")):
    os.makedirs(join(charts_dir, "chokepoints"), mode=0o777)
plotnine.options.figure_size = (8, 6) # 10, 8
p0 = (
    ggplot(df, aes(x="date", y="n_total", group="portname", color="portname"))  #
    + geom_line(alpha=1, size=0.4)
    + geom_vline(xintercept=conflict_date, linetype="dashed", color="red")
    + geom_vline(xintercept=crisis_date, linetype="dashed", color="red")
    + labs(
        x="",
        y="",
        subtitle="Number of Vessels",
        title="AIS Transit Calls in Key Areas",
        color="Area of Interest",
    )
    + theme_minimal()
    + scale_x_datetime(breaks=date_breaks("6 month"), labels=date_format("%Y-%m"))
    + scale_color_brewer(type="qual", palette=2)
    + theme(
        text=element_text(family="Roboto", size=13),
        plot_title=element_text(family="Roboto", size=16, weight="bold"),
        axis_text_x=element_text(rotation=45, hjust=1),
        legend_position="none",
    )
    + facet_wrap("~portname", scales="fixed", ncol=1)
)
display(p0)
p0.save(
    filename=join(
        charts_dir, "chokepoints", "transit-calls-chokepoints-historical.jpeg"
    ),
    dpi=300,
)

<Figure Size: (800 x 600)>
c:\WBG\Anaconda3\envs\rtmis\Lib\site-packages\plotnine\ggplot.py:587: PlotnineWarning: Saving 8 x 6 in image.
c:\WBG\Anaconda3\envs\rtmis\Lib\site-packages\plotnine\ggplot.py:588: PlotnineWarning: Filename: C:/Users/WB514197/Repos/red-sea-monitoring\reports\chokepoints\transit-calls-chokepoints-historical.jpeg
Calculate Reference Values#
Periods
Baseline: 2021, 2022, 2023 (January 1st – October 6th)
Middle East Conflict: 2023 (October 7th - November 16th)
Red Sea Crisis: November 17th - January 31st, 2024
start_reference_date = "2022-01-01"
conflict_date = "2023-10-07"
crisis_date = "2023-11-17"
df_ref = df.loc[(df.date >= start_reference_date) & (df.date < conflict_date)].copy()
df_ref = df_ref.groupby(["portname", "md"])[
    ["n_tanker", "n_cargo", "n_total", "capacity"]
].mean()
df_ref.reset_index(inplace=True)
df_ref.rename(
    columns={
        "n_tanker": "n_tanker_ref",
        "n_cargo": "n_cargo_ref",
        "n_total": "n_total_ref",
        "capacity": "capacity_ref",
    },
    inplace=True,
)
Filter recent data (2023 onwards) and merge reference values.
df_filt = df.loc[(df.date >= "2023-01-01")].copy()
df_filt = df_filt.merge(df_ref, on=["portname", "md"], how="left", validate="m:1")
Calculate percentage change.
df_filt.loc[:, "n_total_pct_ch"] = df_filt.apply(
    lambda x: (x.n_total - x.n_total_ref) / (x.n_total_ref), axis=1
)
df_filt = df_filt.loc[~(df_filt.ymd == "2024-02-29")].copy()
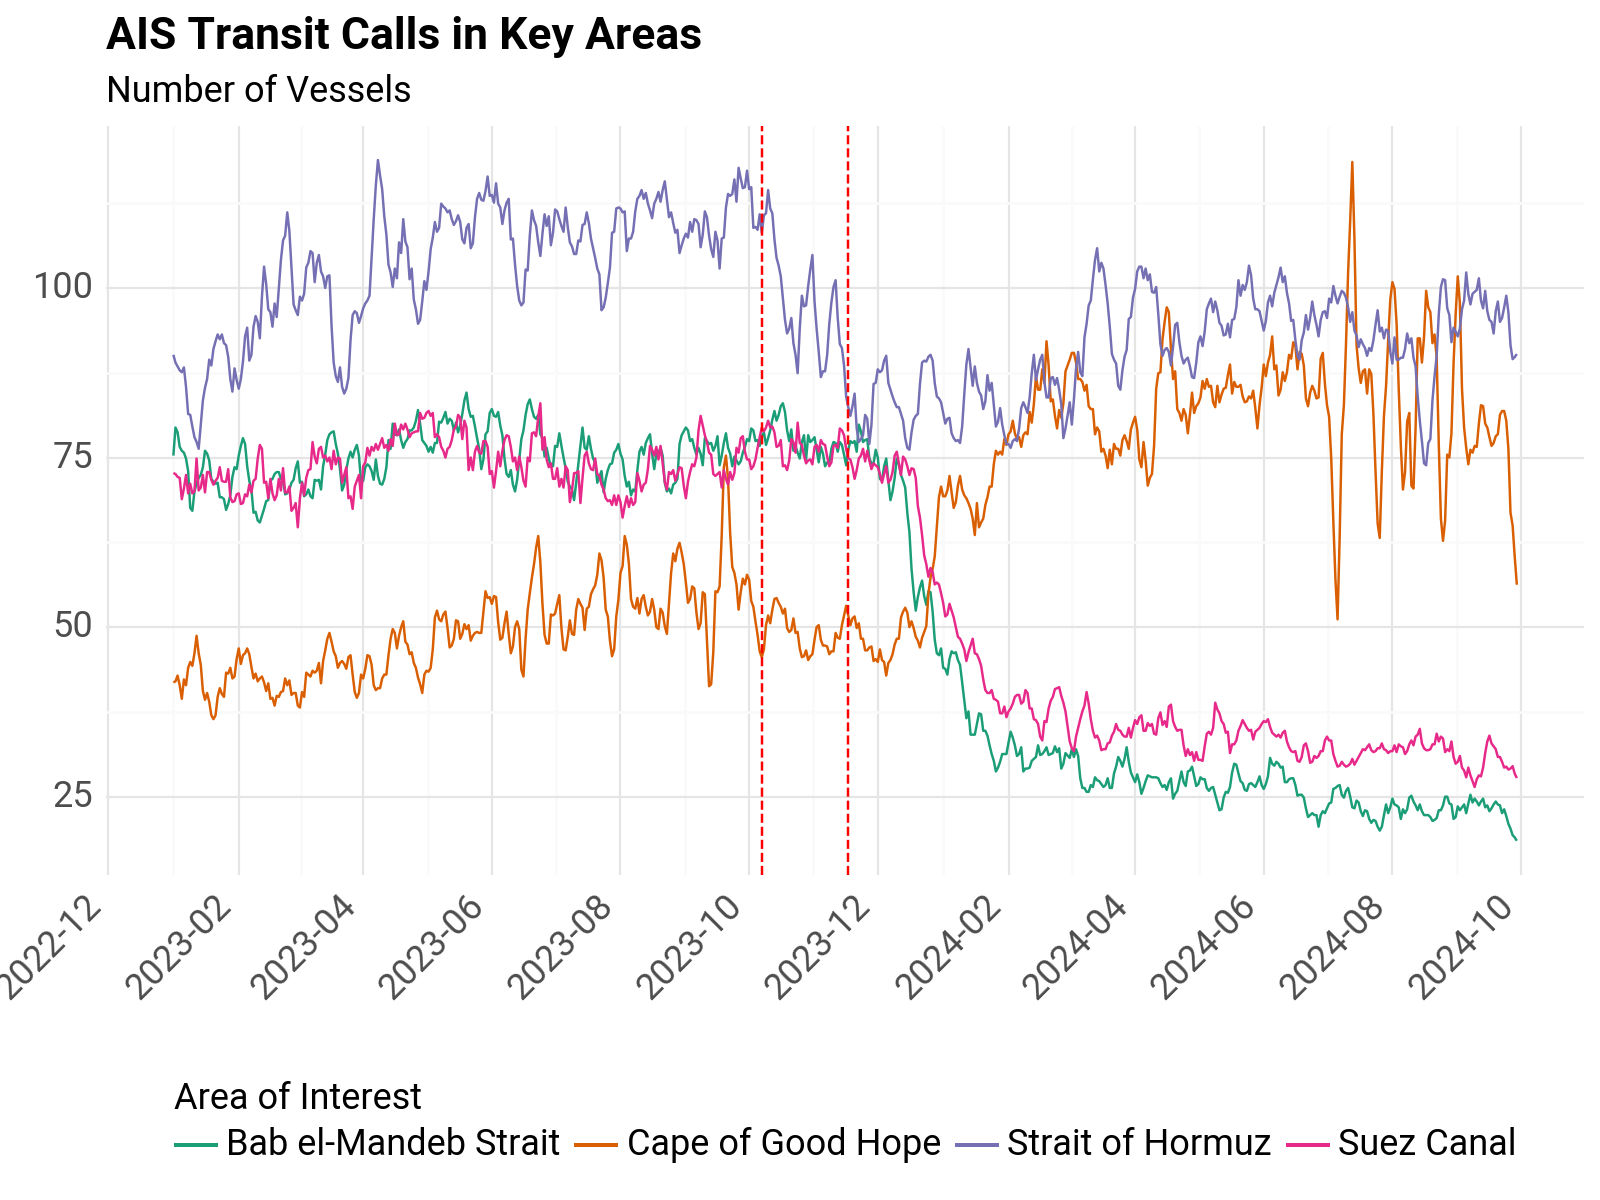
Figure: AIS Transit Calls in Key Areas#
p1 = (
    ggplot(df_filt, aes(x="ymd", y="n_total", group="portname", color="portname"))  #
    + geom_line(alpha=1)
    + geom_vline(xintercept=conflict_date, linetype="dashed", color="red")
    + geom_vline(xintercept=crisis_date, linetype="dashed", color="red")
    + labs(
        x="",
        y="",
        subtitle="Number of Vessels",
        title="AIS Transit Calls in Key Areas",
        color="Area of Interest",
    )
    + theme_minimal()
    + theme(
        text=element_text(family="Roboto", size=13),
        plot_title=element_text(family="Roboto", size=16, weight="bold"),
        axis_text_x=element_text(rotation=45, hjust=1),
        legend_position="none",
    )
    + scale_x_datetime(breaks=date_breaks("2 month"), labels=date_format("%Y-%m"))
    + scale_color_brewer(type="qual", palette=2)
    + theme(legend_position="bottom")
)
display(p1)
p1.save(
    filename=join(charts_dir, "chokepoints", "transit-calls-chokepoints.jpeg"), dpi=300
)

<Figure Size: (800 x 600)>
c:\WBG\Anaconda3\envs\rtmis\Lib\site-packages\plotnine\ggplot.py:587: PlotnineWarning: Saving 8 x 6 in image.
c:\WBG\Anaconda3\envs\rtmis\Lib\site-packages\plotnine\ggplot.py:588: PlotnineWarning: Filename: C:/Users/WB514197/Repos/red-sea-monitoring\reports\chokepoints\transit-calls-chokepoints.jpeg
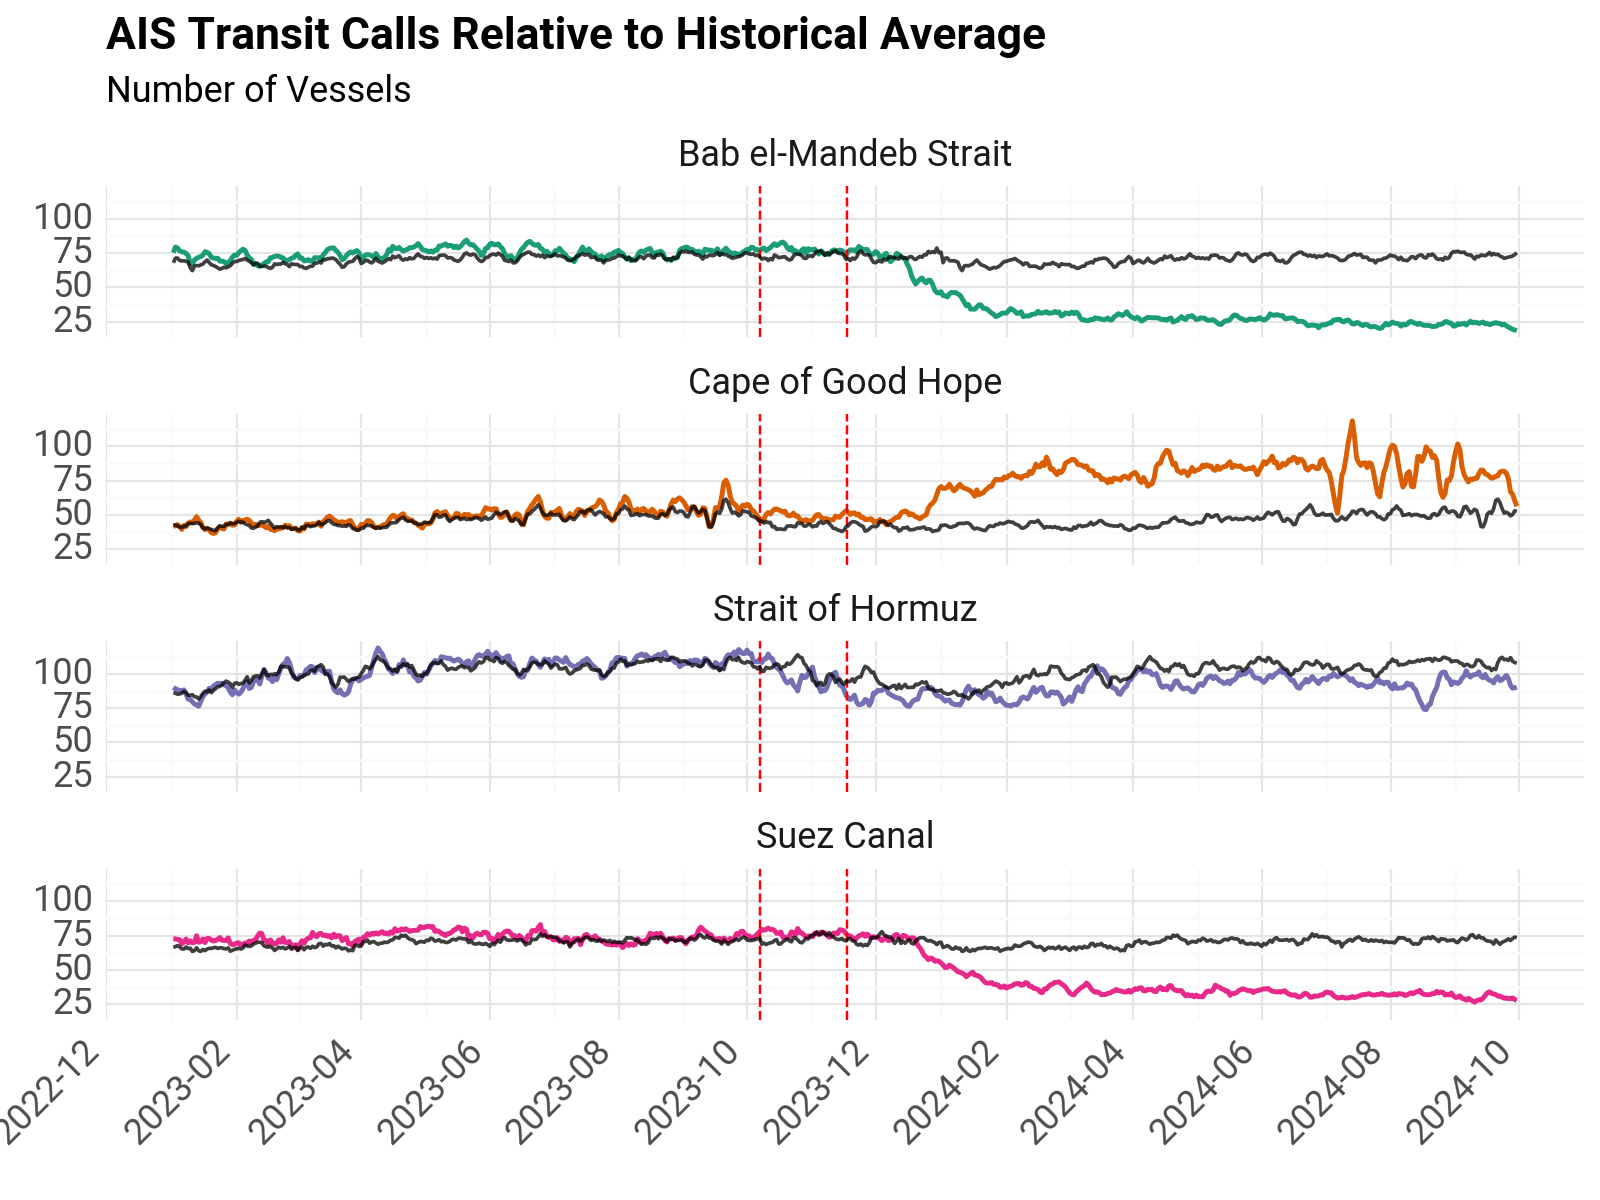
Figure: AIS Transit Calls Relative to Historical Average#
p2 = (
    ggplot(df_filt, aes(x="date", y="n_total", group="portname", color="portname"))  #
    + geom_line(size=1)
    + geom_vline(xintercept=conflict_date, linetype="dashed", color="red")
    + geom_vline(xintercept=crisis_date, linetype="dashed", color="red")
    + geom_line(
        aes(x="date", y="n_total_ref", group="portname"),
        color="black",
        size=0.75,
        alpha=3 / 4,
    )
    + labs(
        x="",
        y="",
        subtitle="Number of Vessels",
        title="AIS Transit Calls Relative to Historical Average",
        color="Area of Interest",
    )
    + theme_minimal()
    + theme(
        text=element_text(family="Roboto", size=13),
        plot_title=element_text(family="Roboto", size=16, weight="bold"),
        axis_text_x=element_text(rotation=45, hjust=1),
        legend_position="none",
    )
    + scale_x_datetime(breaks=date_breaks("2 month"), labels=date_format("%Y-%m"))
    + scale_color_brewer(type="qual", palette=2)
    + facet_wrap("~portname", scales="fixed", ncol=1)
)
display(p2)
p2.save(
    filename=join(charts_dir, "chokepoints", "transit-calls-chokepoints-ref.jpeg"),
    dpi=300,
)

<Figure Size: (800 x 600)>
c:\WBG\Anaconda3\envs\rtmis\Lib\site-packages\plotnine\ggplot.py:587: PlotnineWarning: Saving 8 x 6 in image.
c:\WBG\Anaconda3\envs\rtmis\Lib\site-packages\plotnine\ggplot.py:588: PlotnineWarning: Filename: C:/Users/WB514197/Repos/red-sea-monitoring\reports\chokepoints\transit-calls-chokepoints-ref.jpeg
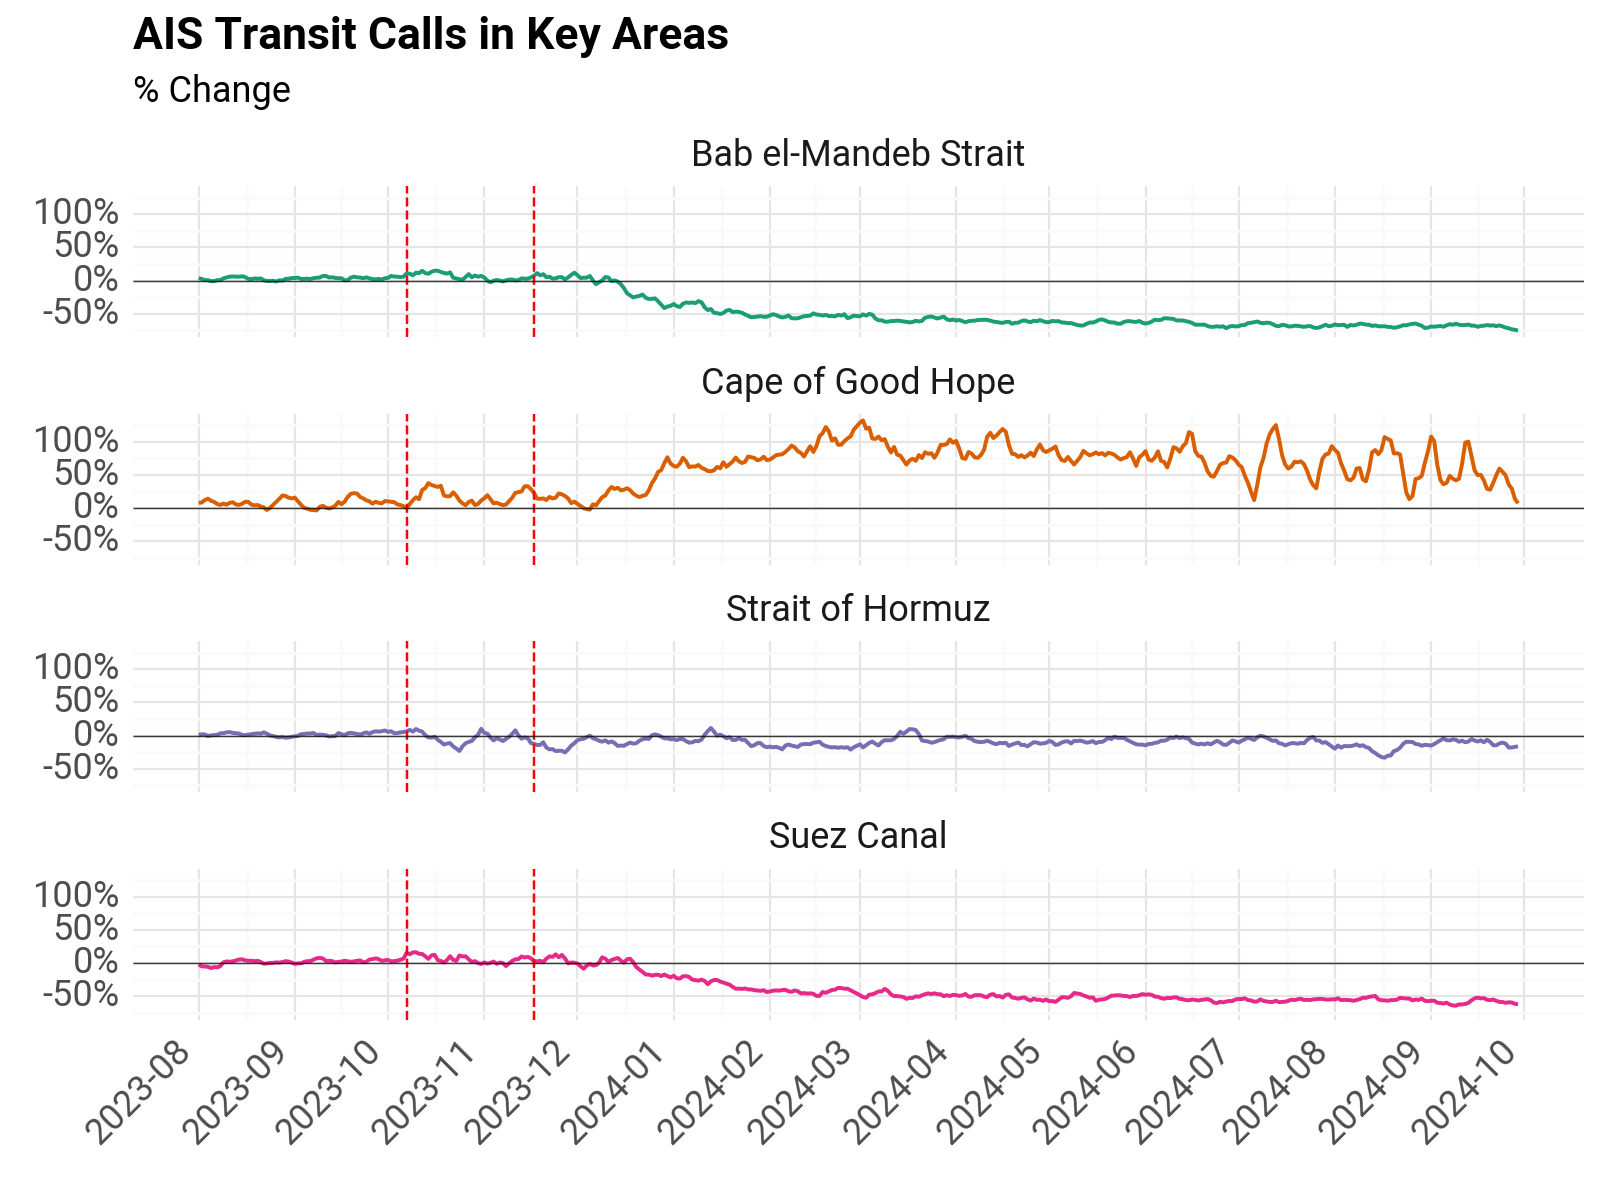
Figure: AIS Transit Calls % Change from Historical Average#
p3 = (
    ggplot(
        df_filt.loc[df_filt.date >= "2023-08-01"],
        aes(x="ymd", y="n_total_pct_ch", group="portname", color="portname"),
    )  #
    + geom_line(size=0.8)
    + geom_vline(xintercept=conflict_date, linetype="dashed", color="red")
    + geom_vline(xintercept=crisis_date, linetype="dashed", color="red")
    + geom_hline(yintercept=0, color="black", alpha=3 / 4, size=0.3)
    + labs(
        x="",
        y="",
        subtitle="% Change",
        title="AIS Transit Calls in Key Areas",
        color="Area of Interest",
    )
    + theme_minimal()
    + theme(
        text=element_text(family="Roboto", size=13),
        plot_title=element_text(family="Roboto", size=16, weight="bold"),
        axis_text_x=element_text(rotation=45, hjust=1),
        legend_position="none",
    )
    + scale_x_datetime(breaks=date_breaks("1 month"), labels=date_format("%Y-%m"))
    + scale_color_brewer(type="qual", palette=2)
    + scale_y_continuous(labels=percent_format())
    + facet_wrap("~portname", scales="fixed", ncol=1)
)
display(p3)
p3.save(
    filename=join(charts_dir, "chokepoints", "transit-calls-chokepoints-pct.jpeg"),
    dpi=300,
)

<Figure Size: (800 x 600)>
c:\WBG\Anaconda3\envs\rtmis\Lib\site-packages\plotnine\ggplot.py:587: PlotnineWarning: Saving 8 x 6 in image.
c:\WBG\Anaconda3\envs\rtmis\Lib\site-packages\plotnine\ggplot.py:588: PlotnineWarning: Filename: C:/Users/WB514197/Repos/red-sea-monitoring\reports\chokepoints\transit-calls-chokepoints-pct.jpeg
Summary Statistics#
Calculate average values by location and time period.
conflict_date, crisis_date
('2023-10-07', '2023-11-17')
df.loc[:, "period"] = ""
df.loc[
    (df.date >= start_reference_date) & (df.date < crisis_date), "period"
] = "Reference"
df.loc[
    (df.date >= conflict_date) & (df.date < crisis_date), "period"
] = "Middle East Conflict"
df.loc[(df.date >= crisis_date), "period"] = "Red Sea Crisis"
df_agg = (
    df.loc[df.period != ""]
    .groupby(["portname", "period"])[["n_tanker", "n_cargo", "n_total", "capacity"]]
    .mean()
)

# change order of rows
df_agg = df_agg.reindex(
    ["Reference", "Middle East Conflict", "Red Sea Crisis"], level=1
)
Table: Daily Average Values by Time Period#
table = df_agg.copy()
# format column numbers to 2 decimal places only for first three columns
table.iloc[:, :3] = table.iloc[:, :3].applymap(lambda x: "{:.2f}".format(x))

# format last column numbers to thousands
table.loc[:, "capacity"] = table.capacity.apply(lambda x: "{:,.0f}".format(x))

table.rename(
    columns={
        "n_tanker": "Tankers",
        "n_cargo": "Cargo",
        "n_total": "Total",
        "capacity": "Capacity",
    },
    inplace=True,
)
table.index.names = ["Area of Interest", "Period"]
display(table)
C:\Users\WB514197\AppData\Local\Temp\ipykernel_32892\36468859.py:3: FutureWarning: DataFrame.applymap has been deprecated. Use DataFrame.map instead.
| Tankers | Cargo | Total | Capacity | ||
|---|---|---|---|---|---|
| Area of Interest | Period | ||||
| Bab el-Mandeb Strait | Reference | 23.91 | 46.86 | 70.77 | 4,823,326 |
| Middle East Conflict | 25.95 | 51.58 | 77.53 | 5,305,603 | |
| Red Sea Crisis | 15.34 | 27.61 | 42.95 | 2,585,144 | |
| Cape of Good Hope | Reference | 9.34 | 36.68 | 46.01 | 4,380,133 |
| Middle East Conflict | 10.03 | 39.20 | 49.23 | 4,813,646 | |
| Red Sea Crisis | 15.03 | 53.92 | 68.95 | 6,224,209 | |
| Suez Canal | Reference | 23.09 | 46.98 | 70.07 | 4,737,291 |
| Middle East Conflict | 25.20 | 51.64 | 76.83 | 5,246,677 | |
| Red Sea Crisis | 16.06 | 32.79 | 48.85 | 2,947,435 |
print(table.reset_index().to_markdown(tablefmt="github", index=False))
| Area of Interest     | Period               |   Tankers |   Cargo |   Total | Capacity   |
|----------------------|----------------------|-----------|---------|---------|------------|
| Bab el-Mandeb Strait | Reference            |     23.91 |   46.86 |   70.77 | 4,823,326  |
| Bab el-Mandeb Strait | Middle East Conflict |     25.95 |   51.58 |   77.53 | 5,305,603  |
| Bab el-Mandeb Strait | Red Sea Crisis       |     15.34 |   27.61 |   42.95 | 2,585,144  |
| Cape of Good Hope    | Reference            |      9.34 |   36.68 |   46.01 | 4,380,133  |
| Cape of Good Hope    | Middle East Conflict |     10.03 |   39.2  |   49.23 | 4,813,646  |
| Cape of Good Hope    | Red Sea Crisis       |     15.03 |   53.92 |   68.95 | 6,224,209  |
| Suez Canal           | Reference            |     23.09 |   46.98 |   70.07 | 4,737,291  |
| Suez Canal           | Middle East Conflict |     25.2  |   51.64 |   76.83 | 5,246,677  |
| Suez Canal           | Red Sea Crisis       |     16.06 |   32.79 |   48.85 | 2,947,435  |
df_agg_copy = df_agg.copy()
res = []
for aoi in aois:
    df_sub = df_agg_copy.loc[(aoi), :].transpose().copy()
    df_sub.loc[:, "Middle East Conflict"] = (
        df_sub.loc[:, "Middle East Conflict"] - df_sub.loc[:, "Reference"]
    ) / df_sub.loc[:, "Reference"]
    df_sub.loc[:, "Red Sea Crisis"] = (
        df_sub.loc[:, "Red Sea Crisis"] - df_sub.loc[:, "Reference"]
    ) / df_sub.loc[:, "Reference"]
    df_sub2 = df_sub.transpose()
    df_sub2.drop("Reference", inplace=True)
    df_sub2.loc[:, "portname"] = aoi
    res.append(df_sub2)
df_agg_pct = pd.concat(res)
Table: Daily Average Values by Time Period, % Change from Baseline#
df_agg_pct.reset_index(inplace=True)
df_agg_pct.set_index(["portname", "period"], inplace=True)

# format columns as pct
df_agg_pct = df_agg_pct.applymap(lambda x: "{:.2%}".format(x))
df_agg_pct.rename(
    columns={
        "n_tanker": "Tankers",
        "n_cargo": "Cargo",
        "n_total": "Total",
        "capacity": "Capacity",
    },
    inplace=True,
)
df_agg_pct.index.names = ["Area of Interest", "Period"]
display(df_agg_pct)
C:\Users\WB514197\AppData\Local\Temp\ipykernel_32892\3184510119.py:5: FutureWarning: DataFrame.applymap has been deprecated. Use DataFrame.map instead.
| Tankers | Cargo | Total | Capacity | ||
|---|---|---|---|---|---|
| Area of Interest | Period | ||||
| Bab el-Mandeb Strait | Middle East Conflict | 8.56% | 10.08% | 9.56% | 10.00% |
| Red Sea Crisis | -35.83% | -41.07% | -39.30% | -46.40% | |
| Cape of Good Hope | Middle East Conflict | 7.42% | 6.87% | 6.98% | 9.90% |
| Red Sea Crisis | 61.03% | 47.01% | 49.85% | 42.10% | |
| Suez Canal | Middle East Conflict | 9.12% | 9.91% | 9.65% | 10.75% |
| Red Sea Crisis | -30.46% | -30.20% | -30.29% | -37.78% |
print(df_agg_pct.reset_index().to_markdown(tablefmt="github", index=False))
| Area of Interest     | Period               | Tankers   | Cargo   | Total   | Capacity   |
|----------------------|----------------------|-----------|---------|---------|------------|
| Bab el-Mandeb Strait | Middle East Conflict | 8.56%     | 10.08%  | 9.56%   | 10.00%     |
| Bab el-Mandeb Strait | Red Sea Crisis       | -35.83%   | -41.07% | -39.30% | -46.40%    |
| Cape of Good Hope    | Middle East Conflict | 7.42%     | 6.87%   | 6.98%   | 9.90%      |
| Cape of Good Hope    | Red Sea Crisis       | 61.03%    | 47.01%  | 49.85%  | 42.10%     |
| Suez Canal           | Middle East Conflict | 9.12%     | 9.91%   | 9.65%   | 10.75%     |
| Suez Canal           | Red Sea Crisis       | -30.46%   | -30.20% | -30.29% | -37.78%    |
Save tables to excel
with pd.ExcelWriter(
    join(
        output_dir,
        "tables",
        f'summary-tables-chokepoints-{time.strftime("%Y_%m_%d")}.xlsx',
    )
) as writer:
    table.to_excel(writer, sheet_name="Chokepoints Summary")
    df_agg_pct.to_excel(writer, sheet_name="Chokepoints % Change")
