Demographics of Lebanon#
To overcome gaps in official demographic statistics, the team has turned to private sector data sources. The Data Lab used algorithmically generated data such as that released by Meta. Additionally, the team also extracted the Relative Wealth Index data from Meta which helps identify differences in standard of living in the population.
Data Description#
High Resolution Population Density#
In partnership with the Center for International Earth Science Information Network (CIESIN) at Columbia University, Meta uses state-of-the-art computer vision techniques to identify buildings from publicly accessible mapping services to create these population datasets. These maps are available at 30-meter resolution. These maps aren’t built using Facebook data and instead rely on applying machine vision AI to satellite imagery and census information (latest available). The analysis was validated in 18 countries (Tiecke, et.al., 2017). For Lebanon, the sources that went into the creation of this dataset are -
Population data: Population data was used by the [estimates released by UNOCHA in 2002](https://cod.humanitarianresponse.info/fr/search/field_country_region/138, Accessed 05/01/2014). The lowest admin level at which data was available is admin 3.
Sex variables: Sex variables were derived from UN Urban and Rural Population by Age and Sex (URPAS) 2010 estimates, generated using URPAS, http://esa.un.org/unpd/popdev/urpas/urpas2014.aspx, Accessed 03/27/2015 at a national level.
Age variables: Age variables were obtained from UN Urban and Rural Population by Age and Sex (URPAS) 2010 estimates, generated using URPAS, http://esa.un.org/unpd/popdev/urpas/urpas2014.aspx, Accessed 03/27/2015 at a national level.
Boundaries:Boundaries were obtained from UN Office for the Coordination of Humanitarian Affairs (UN OCHA), http://www.humanitarianresponse.info/applications/data, Accessed 01/05/2011.
Growth Rate: The growth rate start year was 1996 until 2002 at admin 2 level.
This dataset, along with population density estimates, also has the following demographic disaggregations -
Men
Women
Children under 5
Elderly
Women of Reproductive Age (15-49)
Youth (15-24)
Senior
Data Access#
Dataset Provider: Data for Good at Meta
Granularity: 30 meter resolution
Frequency: The dataset was created in 2020.
License: Creative Commons Attribution International
Data Access: Data can be downloaded directly from HDX or using their AWS Server. The Project SharePoint also hosts the raw data and can be accessed by all project team members.
Relative Wealth Index#
The Relative Wealth Index (RWI) is a number that compares the wealth within the country where negative RWI implies poorer areas and positive RWI implies relatively richer areas. The Meta Relative Wealth Index predicts the relative standard of living within countries using privacy protecting connectivity data, satellite imagery, and other novel data sources. To calculate this index, Meta uses measurements of household wealth collected through face-to-face surveys conducted by the United States Agency for International Development with 1,457,315 unique households living in 66,819 villages in 56 different LMICs around the world. Following this, they use spatial markers to link villages to non-traditional data sources , including satellite imagery, cellular network data, topographic maps, and privacy protecting connectivity data from Facebook. They process the non-traditional data using deep learning and other computational algorithms, which convert the raw data to a set of quantitative features for each village. They use these features to train a supervised machine learning model that predicts the relative wealth of each populated 2.4km2 grid cell on the planet, even in regions where no ground truth data exists (Chi et. al., 2022).
The model was validated in 30 high-income countries (OECD Countries). They found that models trained using data in one country are most accurate when applied to neighboring countries and countries with similar attributes. The country level attributes on which similarity is assessed are - area, population, island, landlocked, distance to the closest country with DHS, number of neighboring countries with DHS, GDP per capita, and Gini coefficient.
Limitations#
For Lebanon, there is very limited census data available. It also does not have an accessible ground truth DHS survey dataset. The estimated mean error of the predicated model results in Lebanon is reported to be 0.470, median error is 0.480 and standard deviation is 0.042.
Data Access#
Relative Wealth Index dataset was obtained through the Development Data Partnership. Given the sensitiivty of the region, the otherwise publicly available dataset, can only be accessed through a signed agreement between the World Bank and Meta. All project team members who need to access this data must agree to the terms of the dataset and must be part of the proposal - Understanding Lebanon’s Economy though Alternative Data.
Dataset: Lebanon Relative Wealth Index
Dataset Provider: Data for Good at Meta
Granularity: 2.4km2 grid cell
Frequency: The dataset was released in 2020. The data is entirely predicted because of lack of ground truth survey information.
License: The use of this data is restricted to project members who are part of the proposal with the Development Data Partnership.
Data Access: Data has been made available for project team members on SharePoint. If you would like to request access please write to datapartnership@worldbank.org
Insights#
Show code cell source
fig, ax = plt.subplots()
plt.axis("off")
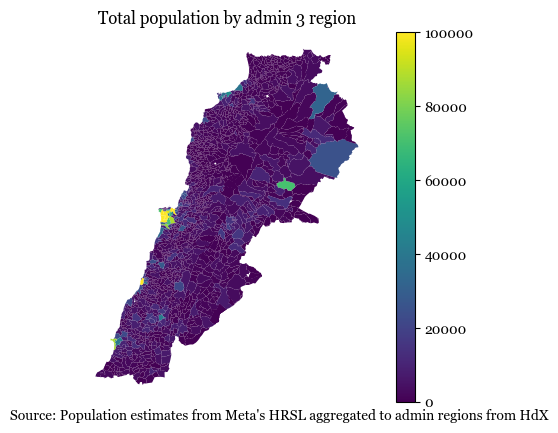
hrsl_lebanon3.plot(column="population", cmap="viridis", vmax=100000, legend=True, ax=ax)
plt.title("Total population by admin 3 region", fontsize=12, ha="center")
subtitle_text = (
"Source: Population estimates from Meta's HRSL aggregated to admin regions from HdX"
)
ax.text(-0.25, -0.05, subtitle_text, transform=ax.transAxes, fontsize=10, ha="left");
Text(-0.25, -0.05, "Source: Population estimates from Meta's HRSL aggregated to admin regions from HdX")
Observations#
The area around Beirut is substantially more populated than the rest of the country.
The areas sharing a border with Syria also have a higher population.
Show code cell source
fig, ax = plt.subplots()
plt.axis("off")
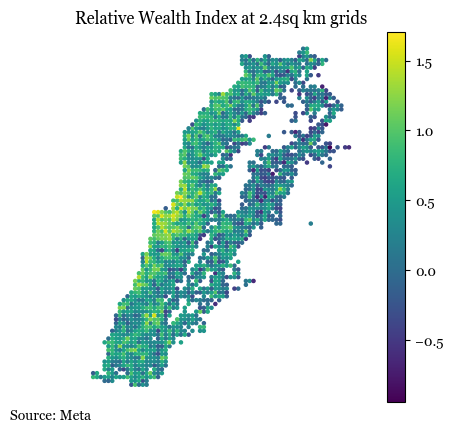
rw.plot(column="rwi", legend=True, ax=ax, markersize=5)
plt.title("Relative Wealth Index at 2.4sq km grids", fontsize=12, ha="center")
subtitle_text = "Source: Meta"
ax.text(-0.25, -0.05, subtitle_text, transform=ax.transAxes, fontsize=10, ha="left")
Text(-0.25, -0.05, 'Source: Meta')
Observations#
The northern border shared with Syria includes some of the poorest regions in the country
The area around Beirut is the wealthiest in the country
References#
Chi, G., Fang, H., Chatterjee, S., & Blumenstock, J. E. (2022). Microestimates of wealth for all low-and middle-income countries. Proceedings of the National Academy of Sciences, 119(3), e2113658119.
Tiecke, T. G., Liu, X., Zhang, A., Gros, A., Li, N., Yetman, G., … & Dang, H. A. H. (2017). Mapping the world population one building at a time. arXiv preprint arXiv:1712.05839.