Seaborn Trade Activity Estimation#
This section introduces the use of an alternative big data source – Automatic Identification System (hereafter, AIS) – to monitor seaborn trade activity in Lebanon. AIS was originally developed by the International Maritime Organization in 2004 to prevent collisions between large vessels. This system requires all commercial ships (gross tonnage greater than 300) and passenger ships to broadcast their position via ground stations and satellites.
A nascent literature has been dedicated to convert raw AIS messages into volumes of trade (Arslanalp et al. [2021]; Cerdeiro et al. [2020]; Jia et al. [2019]; Verschuur et al. [2021]; Verschuur et al. [2021]). These papers utilize dynamic information on ship movements, static characteristics of each ship, and reported draft (depth of submergence), to estimate the amount of goods offloaded or loaded at a certain port. While this methodology has produced results that correlate with aggregated trade value statistics, users should use the results with caution as a near real-time proxy for relative trends in trade. The methodology is based primarily on draft values from AIS data which are subject to a few limitations. Thus, AIS-derived trade values may not match perfectly with reported values.
For the purposes of the monitor, we implement and adjust the methodology described in “Tracking trade from space: an application to pacific island countries” [Arslanalp et al., 2021], using the same AIS data used by the authors, facilitated by the UN Global Platform AIS Task Team.
The final data product, Trade Estimation for Lebanon, visualized in the subsequent notebooks, can also be accessed through Project SharePoint.
Note
This workflow and notebooks were originally developed by Cherryl Chico in support of the World Bank’s Pacific Observatory project. It has been adapted for the Lebanon Monitor by Andres Chamorro.
Methodology#
The method can be broken down into the following four steps (each step was implemented in a python notebook).
Step 1. Data Extraction#
We retrieve all AIS messages that intersect a 10-kilometer buffer from each port in Lebanon (Bayrut, Sayda, and Tarabulus), available from December 1st, 2018, to November 1st, 2023. We use international port boundaries provided by Verschuur et al. [2021].
Summarize AIS Data by Routes#
We collapse the AIS data into routes. An incoming or outgoing route is captured by grouping continous AIS messages from a unique vessel traversing from port buffer to port boundary (or vice versa). We keep the first and last AIS messages for each route as they contain relevant arrival and departure information.
Step 2. Data Filtering and Ship Registry Information#
There may be routes that are quick because of small movements by vessels located at the edges of the boundaries. To remove the noise, we say that a vessel has fully exited the port when it spends at least 1 day outside of Port Boundary. Otherwise, we treat consecutive routes within 24 hours of each other as one.
We then combine the routes data with Ship Registry data to get the finer vessel categories and other information on the vessel required for trade estimation. The matching is done using both MMSI and IMO numbers from both data sources. We validate the match by comparing the vessel names.
Step 3. Backpropagate Departure Draft#
The difference in arrival vs. departure draught is a key calculation to estimate trade. However, the difference between outgoing and incoming draft is only identified in a subset of port calls. For the remaining routes, we apply the back-propagation technique, searching for the arrival draft at the next port visited.
Step 4. Trade Estimation#
Volume Displacement Method#
We estimate the volume of the load of the ship based on the volume of the displaced water. The volume of the displaced water by the ship is derived from the volume of a rectangular block with the same length and width. The ship’s draught or the height of the ship submerged in water is the height of the rectangular block. Since the ship is not rectangular, we reduce this by a factor called block coefficent that is dependent on the ship’s draught. To convert volume into weight (in tonnes), we multiply the volume by the density of saltwater.
Design Block Coefficient#
From any reported draught \(D_r\), displacement at reported draught \(Disp_r\) can be estimated as the volume of a rectangular block with the same dimensions of the ship. The length and width of the ship represents the length and width of the rectangular block and the draught represents the height. The volume is adjusted by a factor called block coefficient and then converted to tonnes by multiplying by the density of salt water.
where \(Cb_{r}\) is the block coefficient at draught \(d_{r}\), \(L\) is the length, \(W\) is the width, \(\rho\) = density of salt water, and \(d_r\) = reported draught
We can derive the block coefficent for any given draught as follows:
Given design draught, and design block coeffient, the block coefficient at reported draught can be estimated as:
Implementation#
01 Data Extraction
02 Data Filtering and Ship Registry Information
03 Backpropagate Departure Draft
04 Trade Estimation
Update (August 2024)#
We present updated estimates of monthly trade volume (imports and exports) across all ports in Lebanon. The trade flow is consistently dominated by imports, and there is some seasonality with higher volume recorded in summer months. In the spring of 2024, trade appeared to slowly recover or at least match the volumes registered in the previous year. Particularly high trade flows are observed in May and June.
Although there is no official data to validate these estimates, other agencies (IMF’s PortWatch and UN COMTRADE) have implemented similar methods with AIS data and have reported consistent patterns.
Our results can be accessed via the following link.
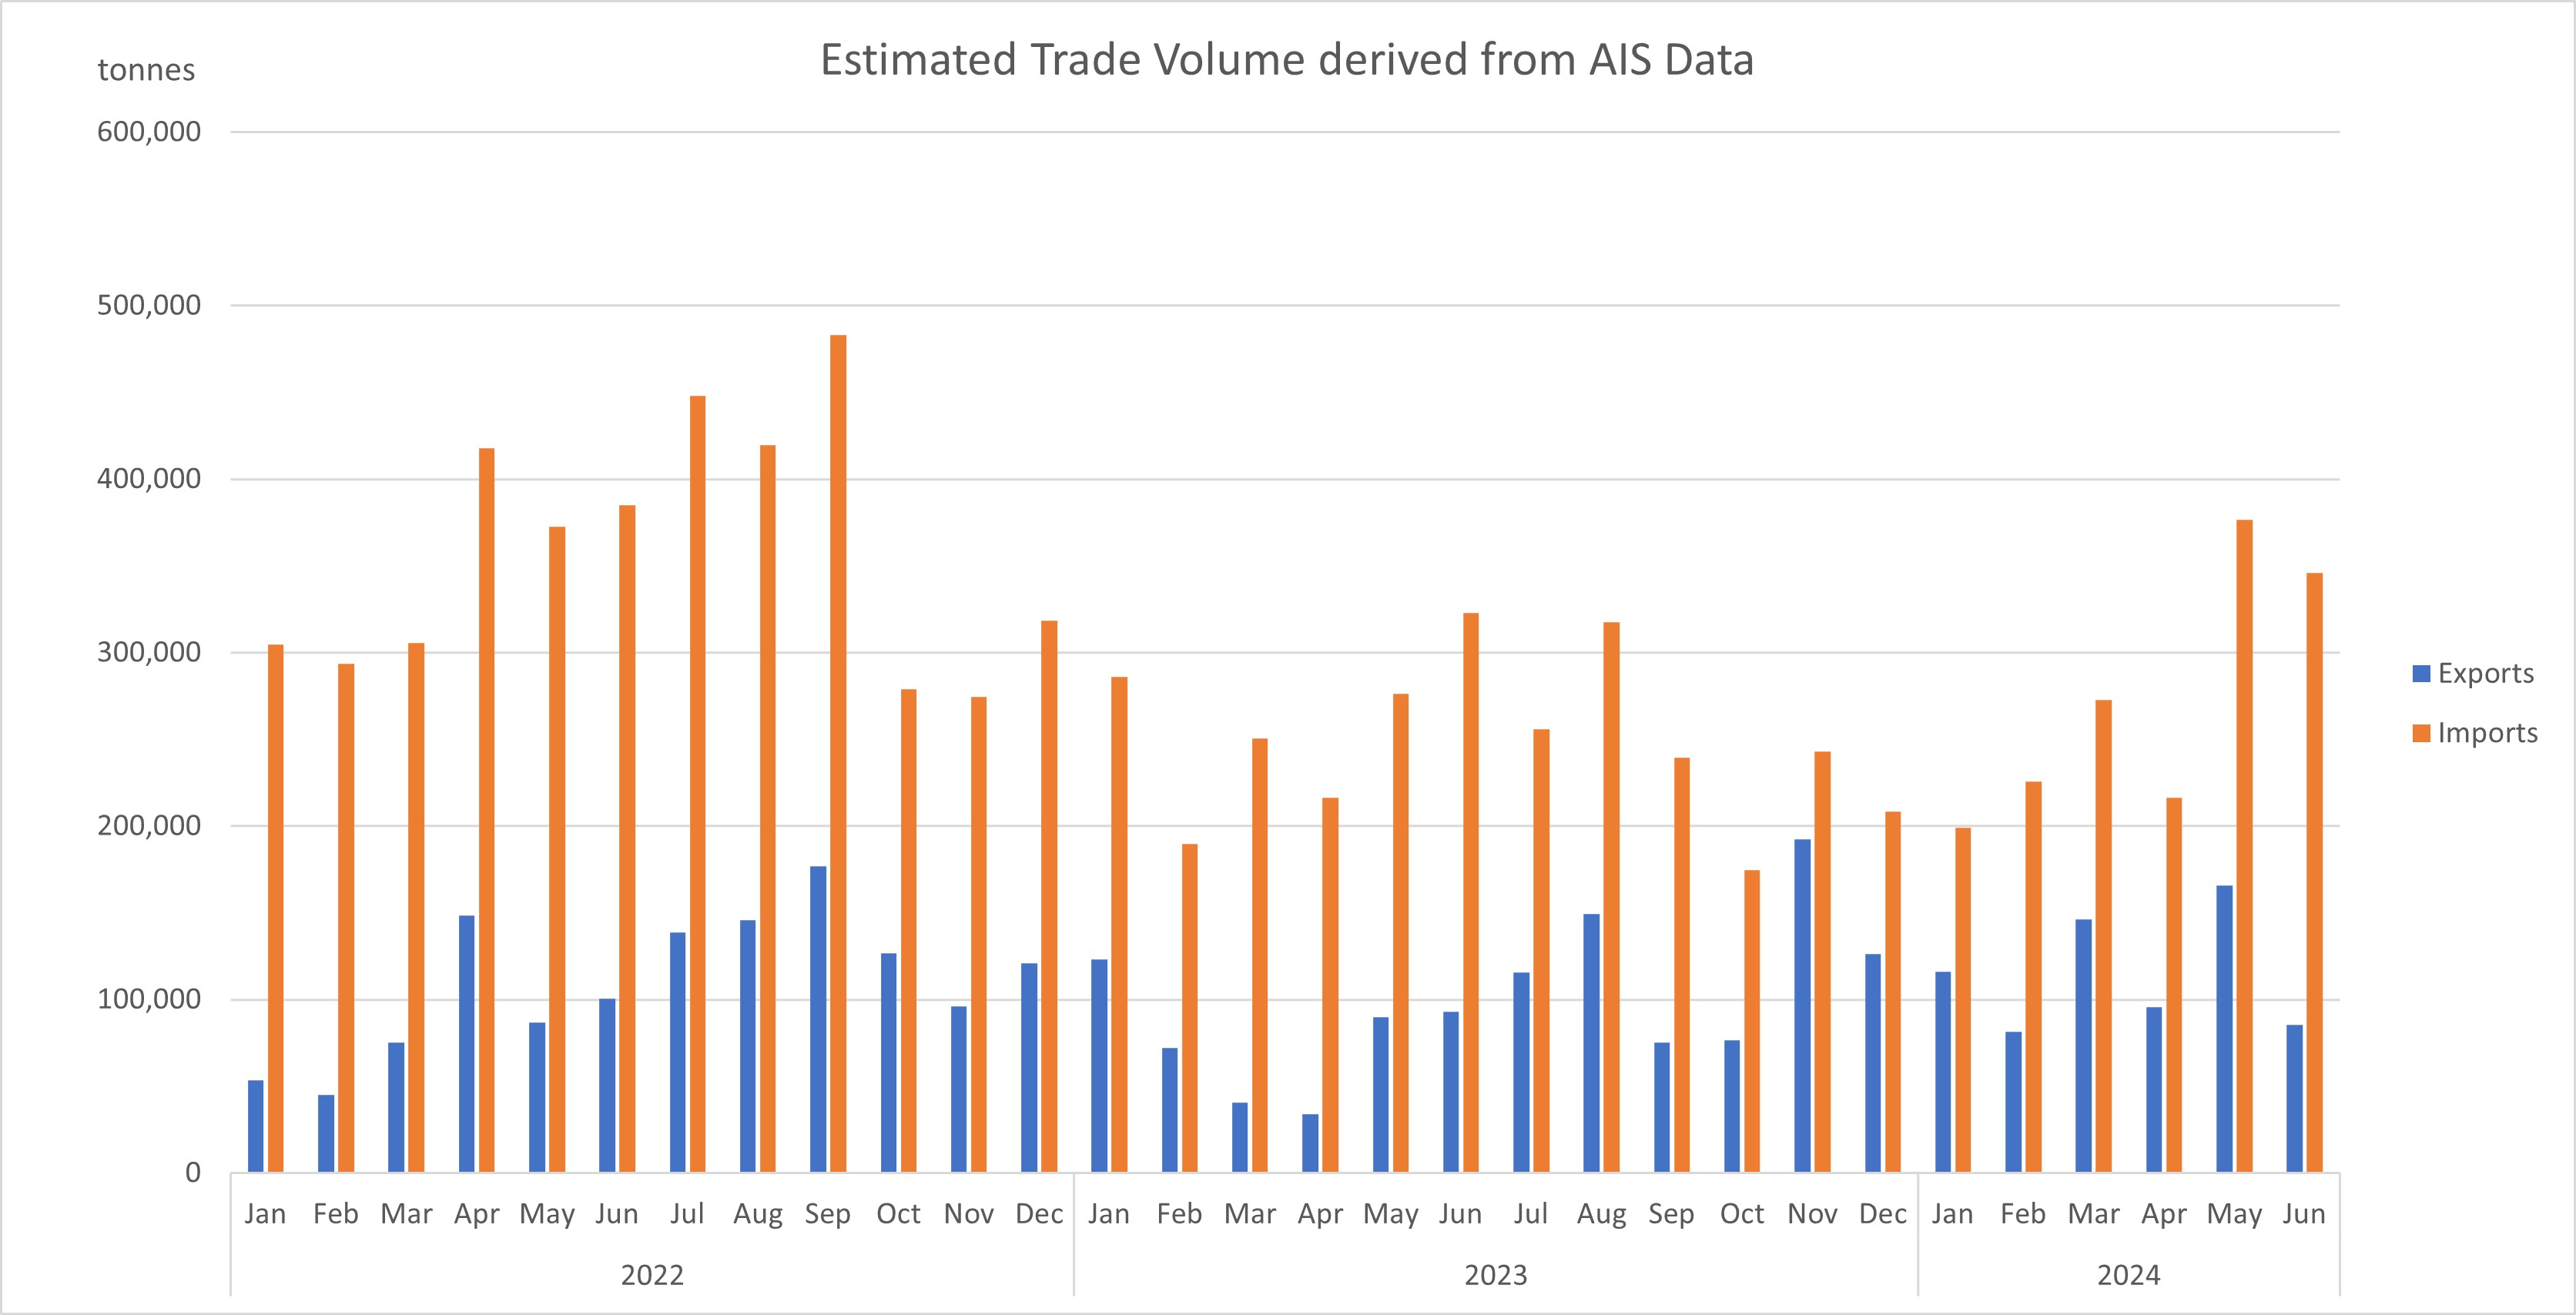
Fig. 24 Estimated Monthly Trade Volume from AIS signals#
Limitations#
The accuracy of the trade estimation method depends heavily on the level of draft reporting in ports, which varies globally.
The methodology doesn’t currently account for transshipment (goods that are offloaded at a port and then loaded onto another vessel without going through customs).
AIS data can be noisy, and the methodology is sensitive to days with data blackouts.
References#
- AKV21(1,2)
Serkan Arslanalp, Robin Koepke, and Jasper Verschuur. Tracking trade from space: an application to pacific island countries. IMF Working Papers, 2021(225):A001, 2021. URL: https://www.elibrary.imf.org/view/journals/001/2021/225/article-A001-en.xml, doi:10.5089/9781513593531.001.A001.
- CKomaromiLS20
Diego A. Cerdeiro, András Komáromi, Y. Liu, and Mamoon M. Saeed. World seaborne trade in real time: a proof of concept for building ais-based nowcasts from scratch. IMF Working Papers, 2020.
- HT04
Ramaswamy Hariharan and Kentaro Toyama. Project Lachesis: Parsing and Modeling Location Histories. In Geographic Information Science. Volume 3234, volume 3234, 106–124. 2004. doi:10.1007/978-3-540-30231-5_8.
- JPS19
Haiying Jia, Vishnu Prakash, and Tristan Smith. Estimating vessel payloads in bulk shipping using ais data. International Journal of Shipping and Transport Logistics, 11:25, 01 2019. doi:10.1504/IJSTL.2019.096864.
- VKH21a(1,2)
Jasper Verschuur, Elco E Koks, and Jim W Hall. Global economic impacts of COVID-19 lockdown measures stand out in high-frequency shipping data. PLoS One, 16(4):e0248818, April 2021.
- VKH21b
Jasper Verschuur, Elco E. Koks, and Jim W. Hall. Observed impacts of the covid-19 pandemic on global trade. Nature Human Behaviour, 5(3):305–307, Mar 2021. URL: https://doi.org/10.1038/s41562-021-01060-5, doi:10.1038/s41562-021-01060-5.