Night Time Lights in Lebanon#
Nighttime lights have become a commonly used resource to estimate changes in local economic activity. This section shows where nighttime lights are concentrated across Lebanon and observed changes over time.
Data#
We use nighttime lights data from two sources: for data from 1992 to 2012, we use data from DMSP-OLS; for data from 2013 to present, we use VIIRS Black Marble data. Raw nighttime lights data requires correction due to cloud cover and stray light, such as lunar light. Both nighttime lights datasets apply algorithms to correct raw nighttime light values and calibrate data so that trends in lights over time can be meaningfully analyzed.
The raw values of nighttime lights are radiance of lights, and the values themselves are not readily interpretable in an economic context. Nighttime light values should be viewed as an index, with larger values reflecting brighter lights—and more economic activity.
For further information, please refer to foundational_datasets.
Methodology#
We create a harmonized time series from DMSP data and VIIRS data. Both data sources provide data in 2013. We scale find the difference between DMSP and VIIRs in 2013, and apply this scaling factor across DMSP data to merge the two time series. The below figure shows the individual VIIRS and DMSP series and the harmonized series.
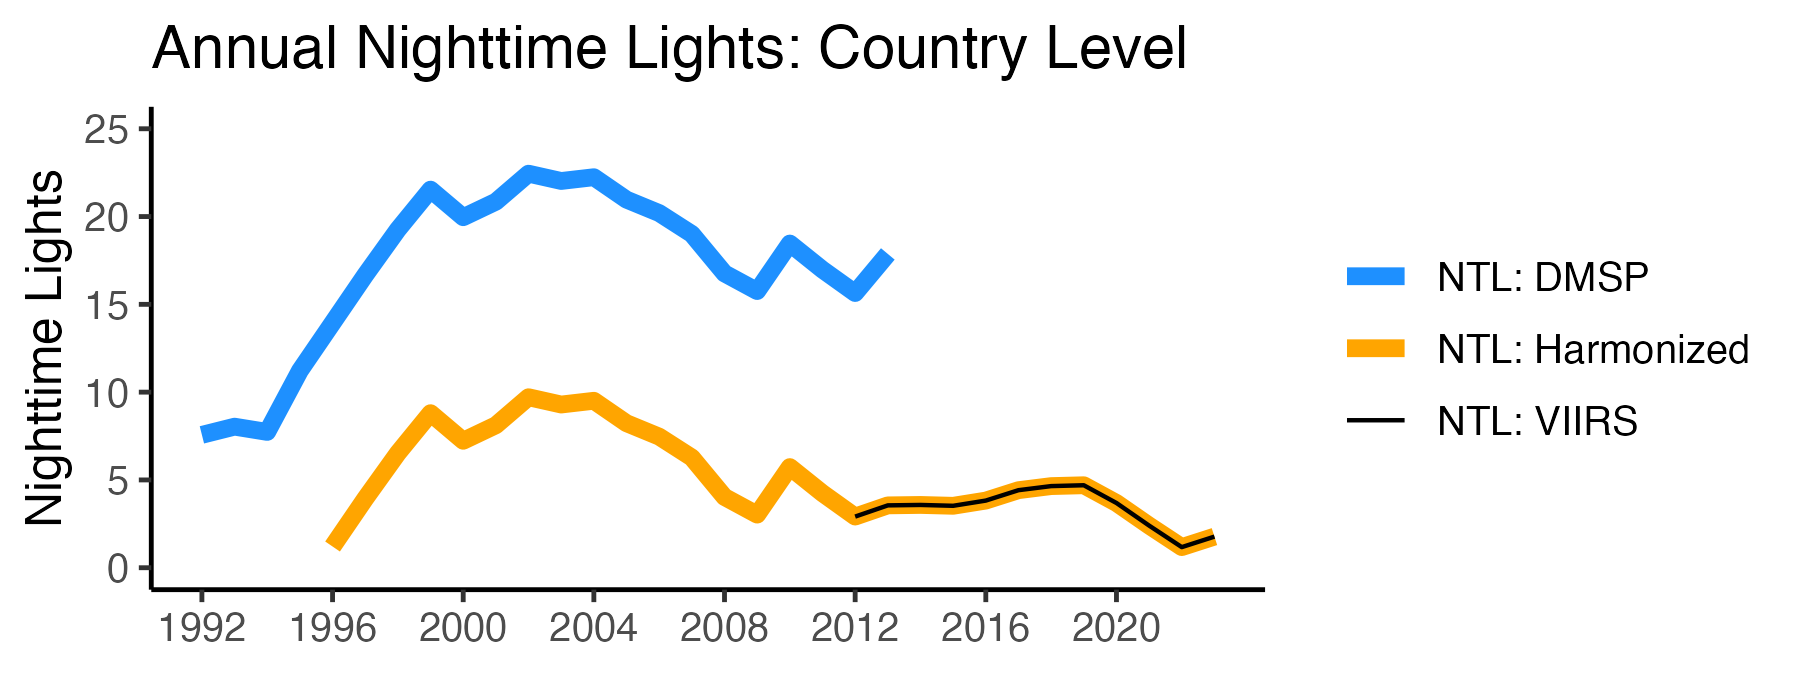
Fig. 1 Harmonizing VIIRS and DMSP#
While we rely on VIIRS data from BlackMarble, there are other sources of VIIRS data, specifically. Trends between all sources look similar.
VIIRS Raw, available from April 2012 to present
VIIRS Corrected, available January 2014 to present.
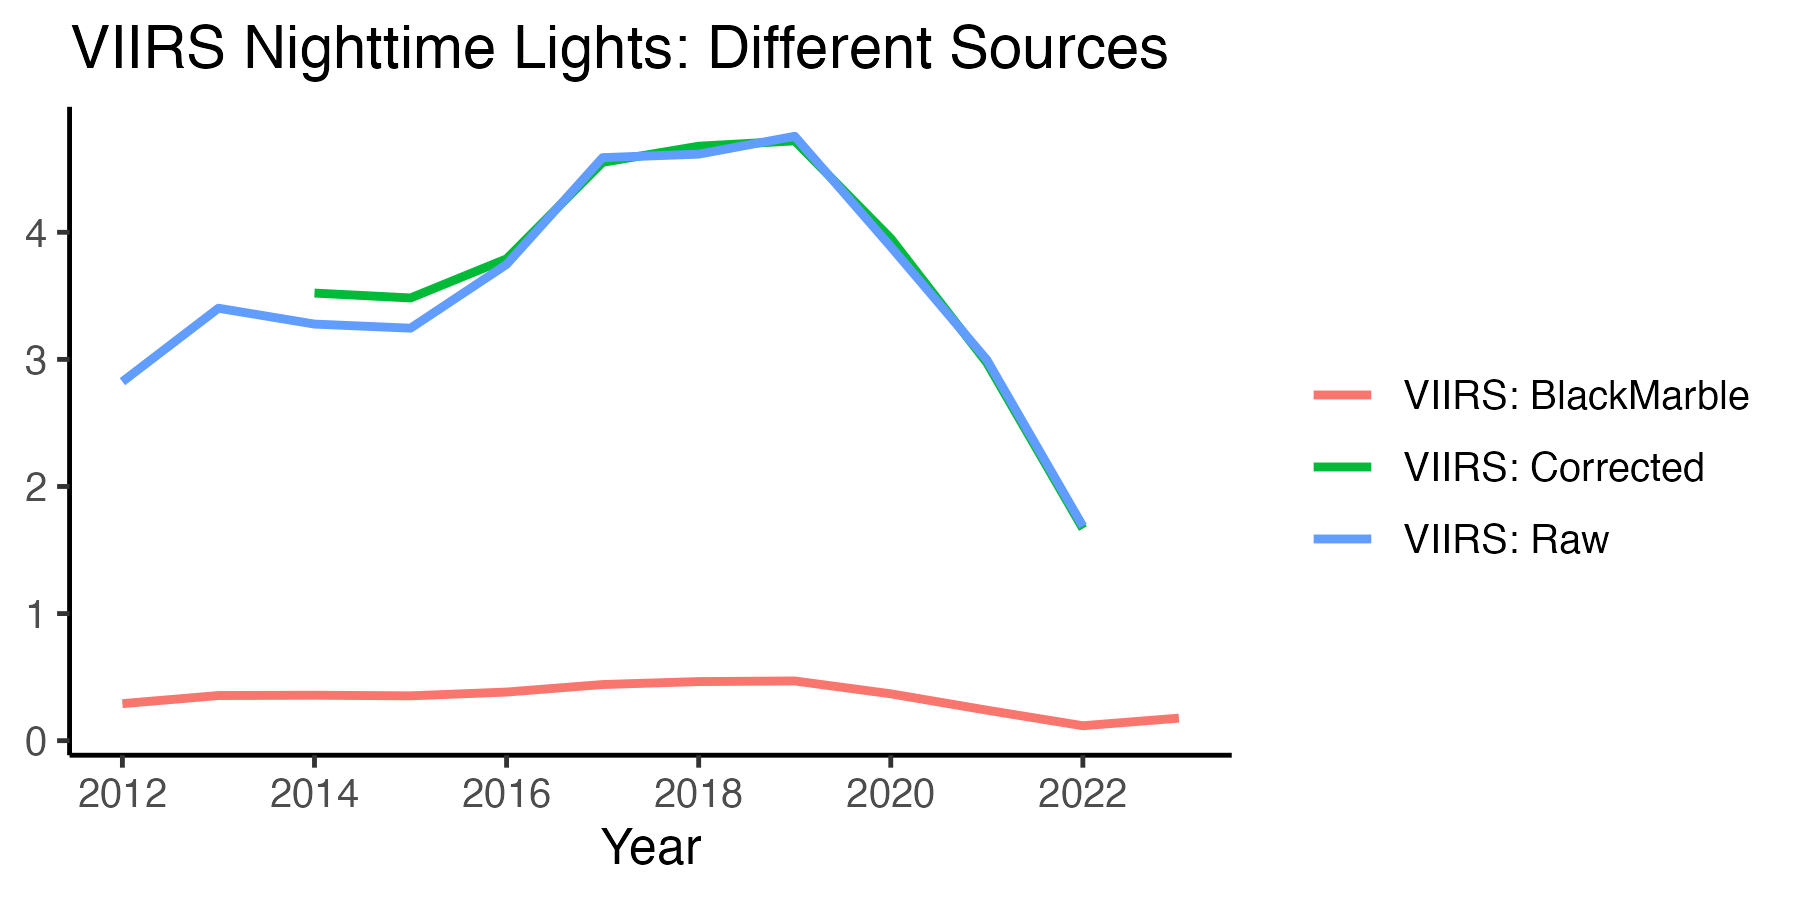
Fig. 2 VIIRS Data from Different Sources#
The following code cleans the data:
Download VIIRS Black Marble data Downloads nighttime light BlackMarble data as raster files.
Aggregate Nighttime Lights to Polygons The code creates analysis-ready code files, in OneDrive in
Data/night-time-lights/aggregated-to-polygons. Data are aggregated to different administrative zones.
The following code produces the figures:
Results#
Map of Nighttime Lights#
The below figure shows nighttime lights in 2019 and 2023, illustrating the notable reduction in nighttime lights throughout the country.
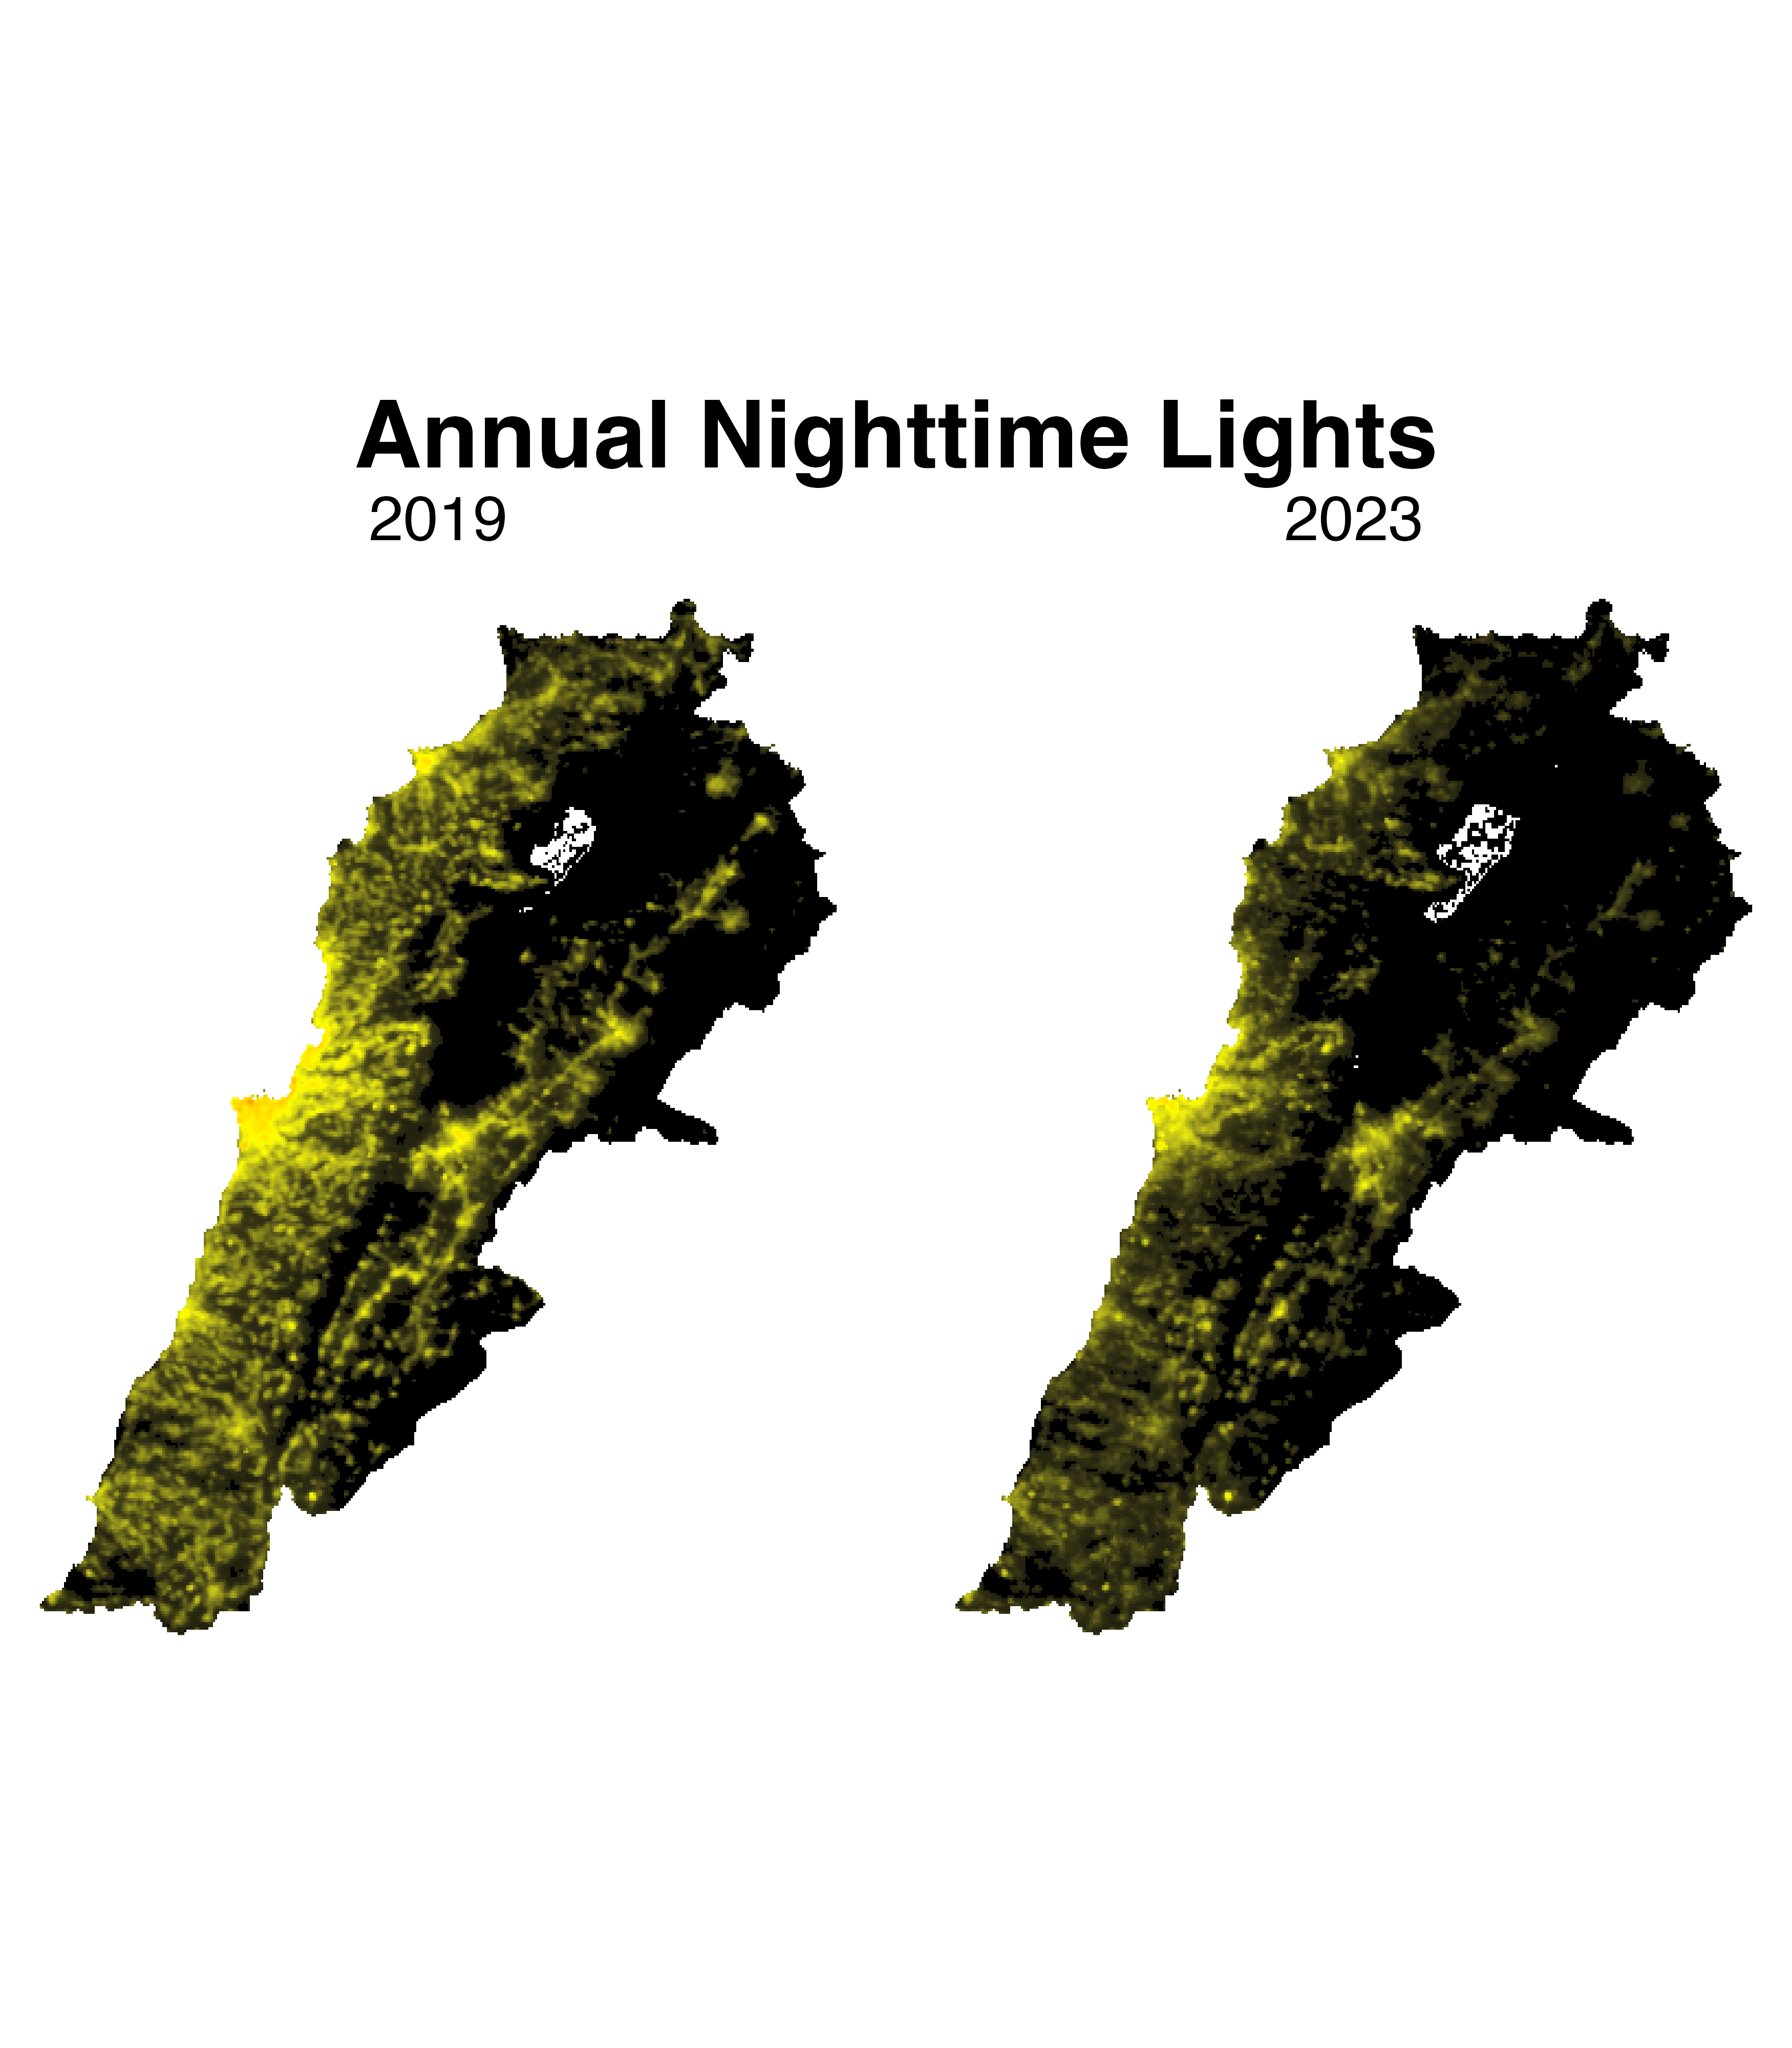
Fig. 3 Map of Nighttime Lights in 2019 and 2023#
Trends in Nighttime Lights: Annual#
The below figures show trends in nighttime lights across the country (top figure) and at the first administrative division level (bottom figure). The figures show nighttime lights increasing across the country from 2015 to 2019, where nighttime lights then started to notably decline each year since.
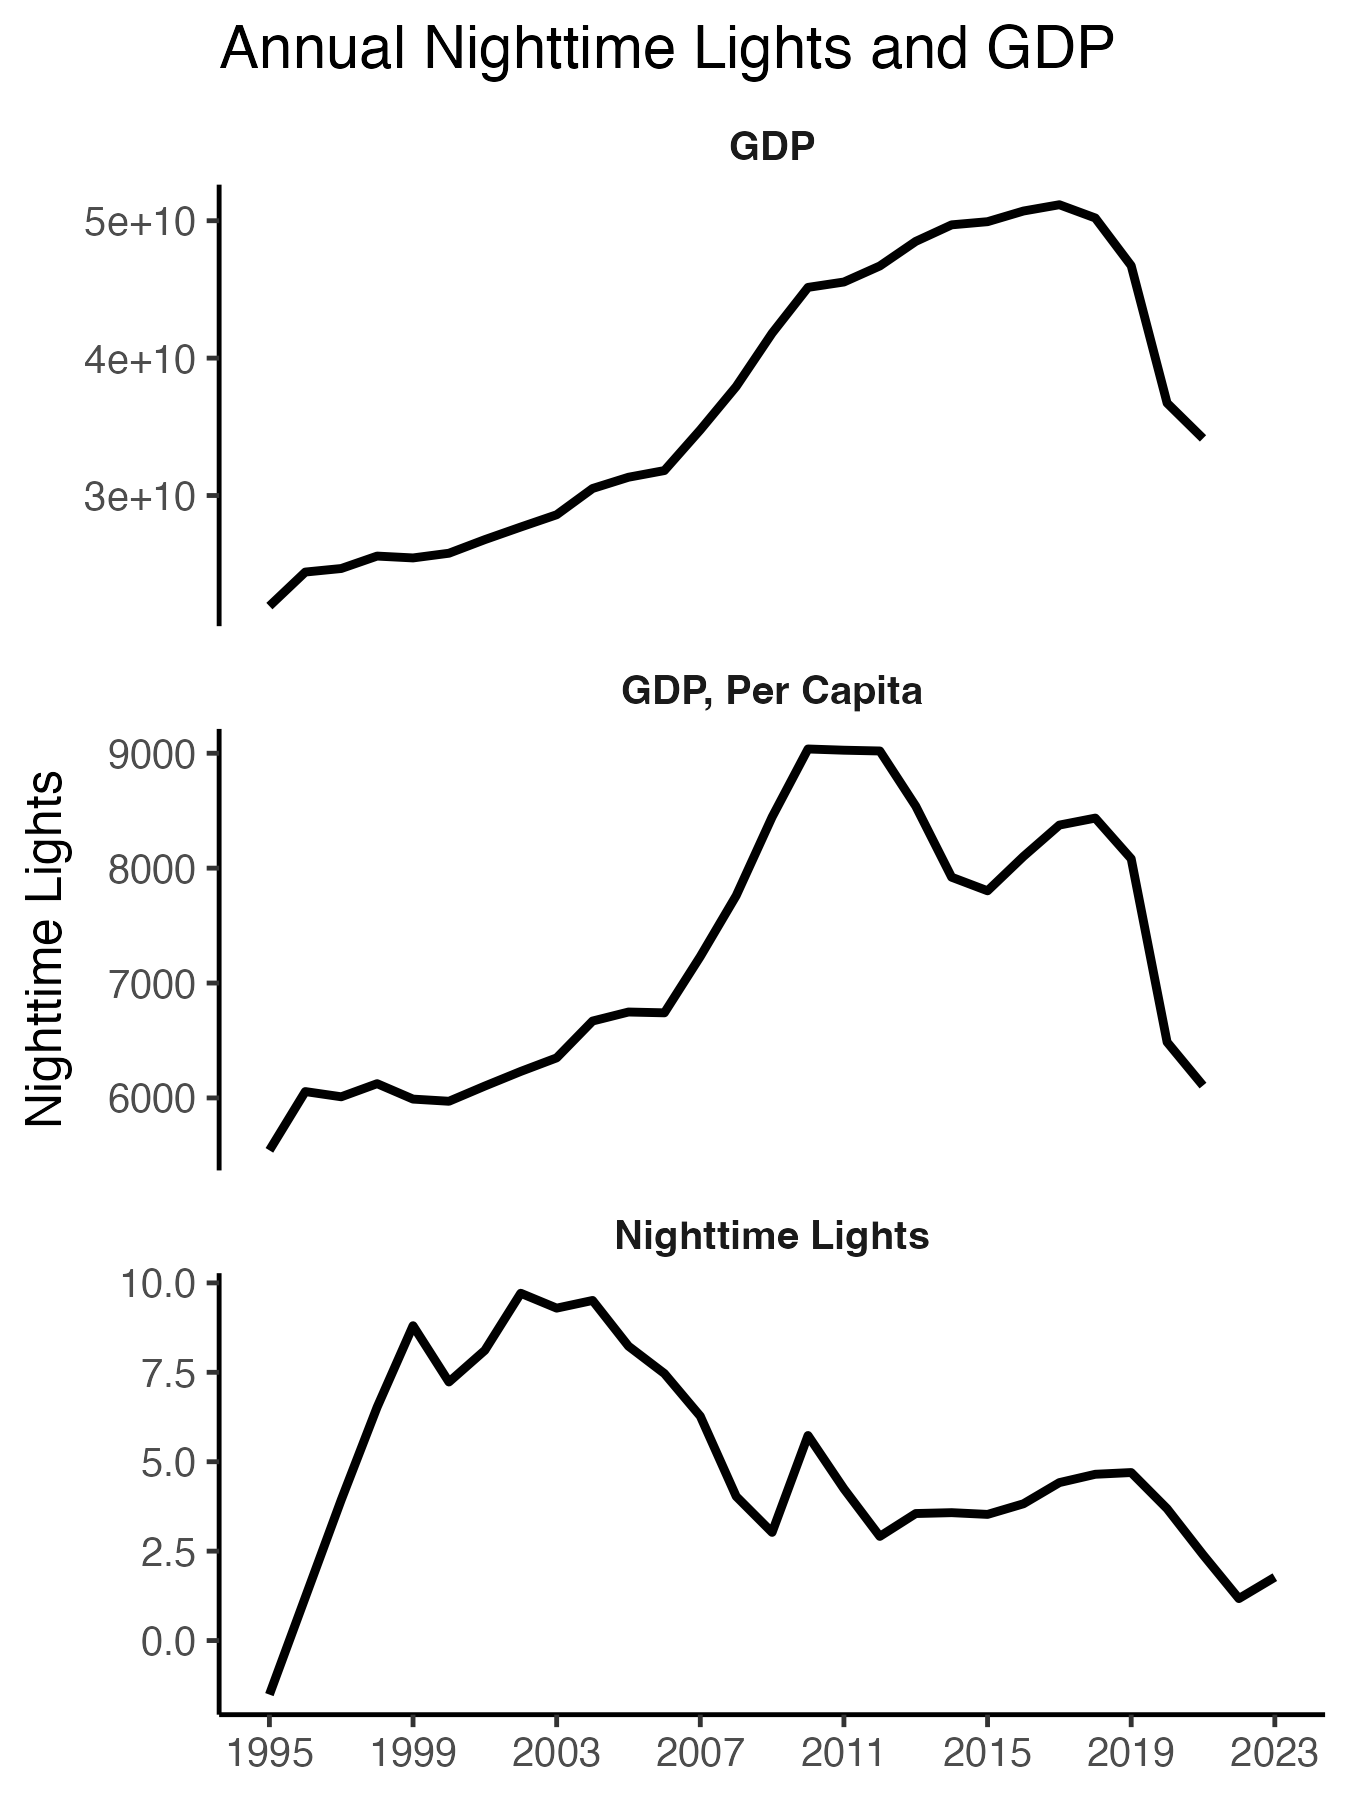
Fig. 4 Annual Trends in GDP Nighttime Lights: Country Level#
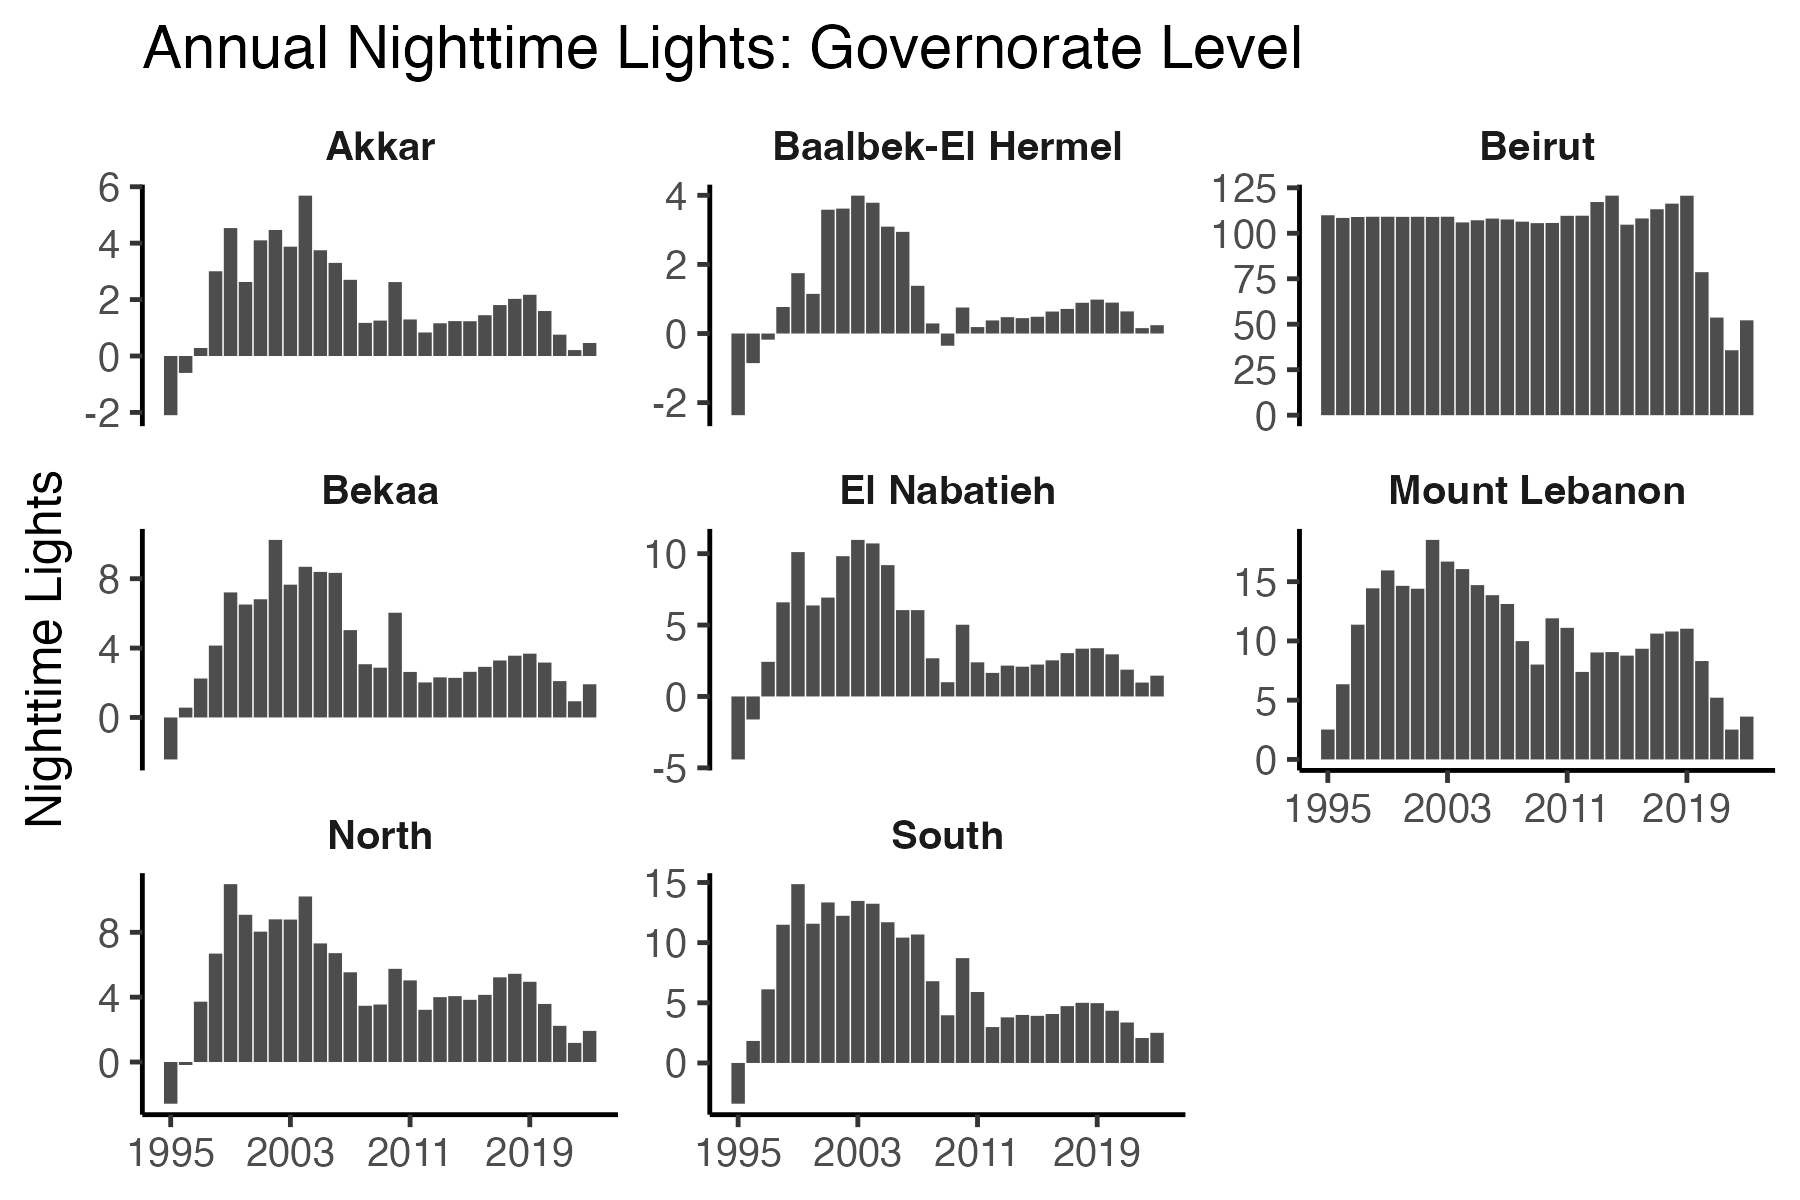
Fig. 5 Annual Trends in Nighttime Lights: Governorate Level#
Trends in Nighttime Lights: Monthly#
The below figures show trends in nighttime lights across the country (top figure) and at the first administrative division level (bottom figure). The figures show nighttime lights increasing across the country from 2015 to 2019, where nighttime lights then started to notably decline each year since.
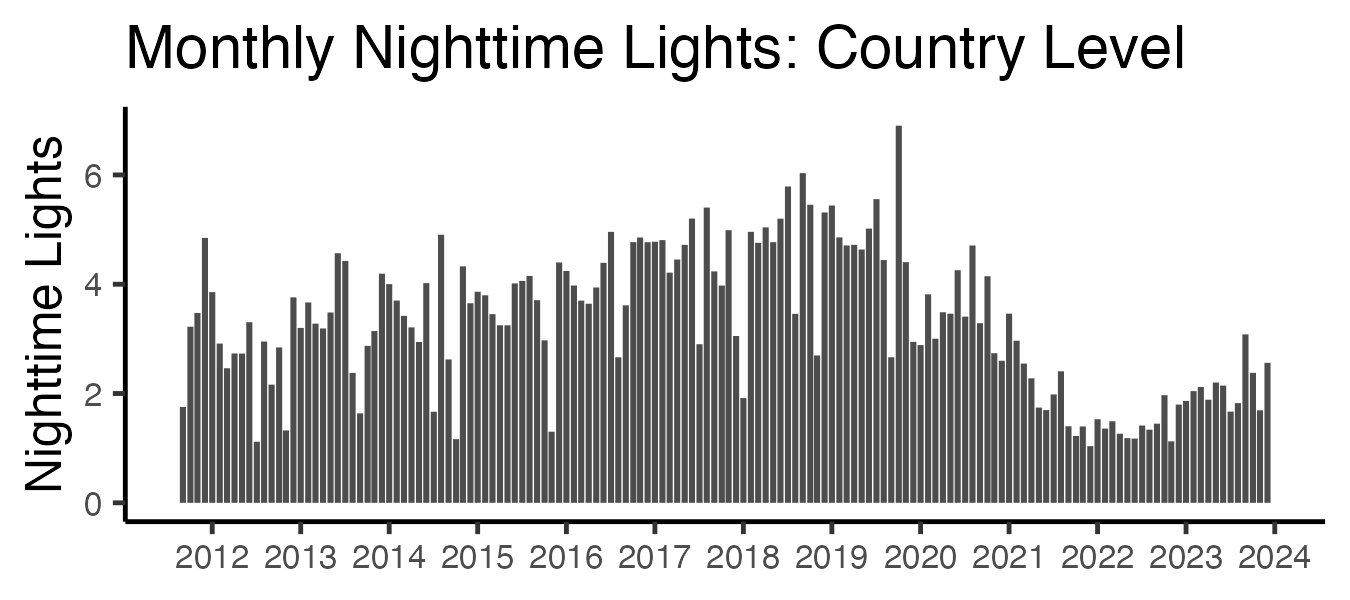
Fig. 6 Monthly Trends in GDP Nighttime Lights: Country Level#
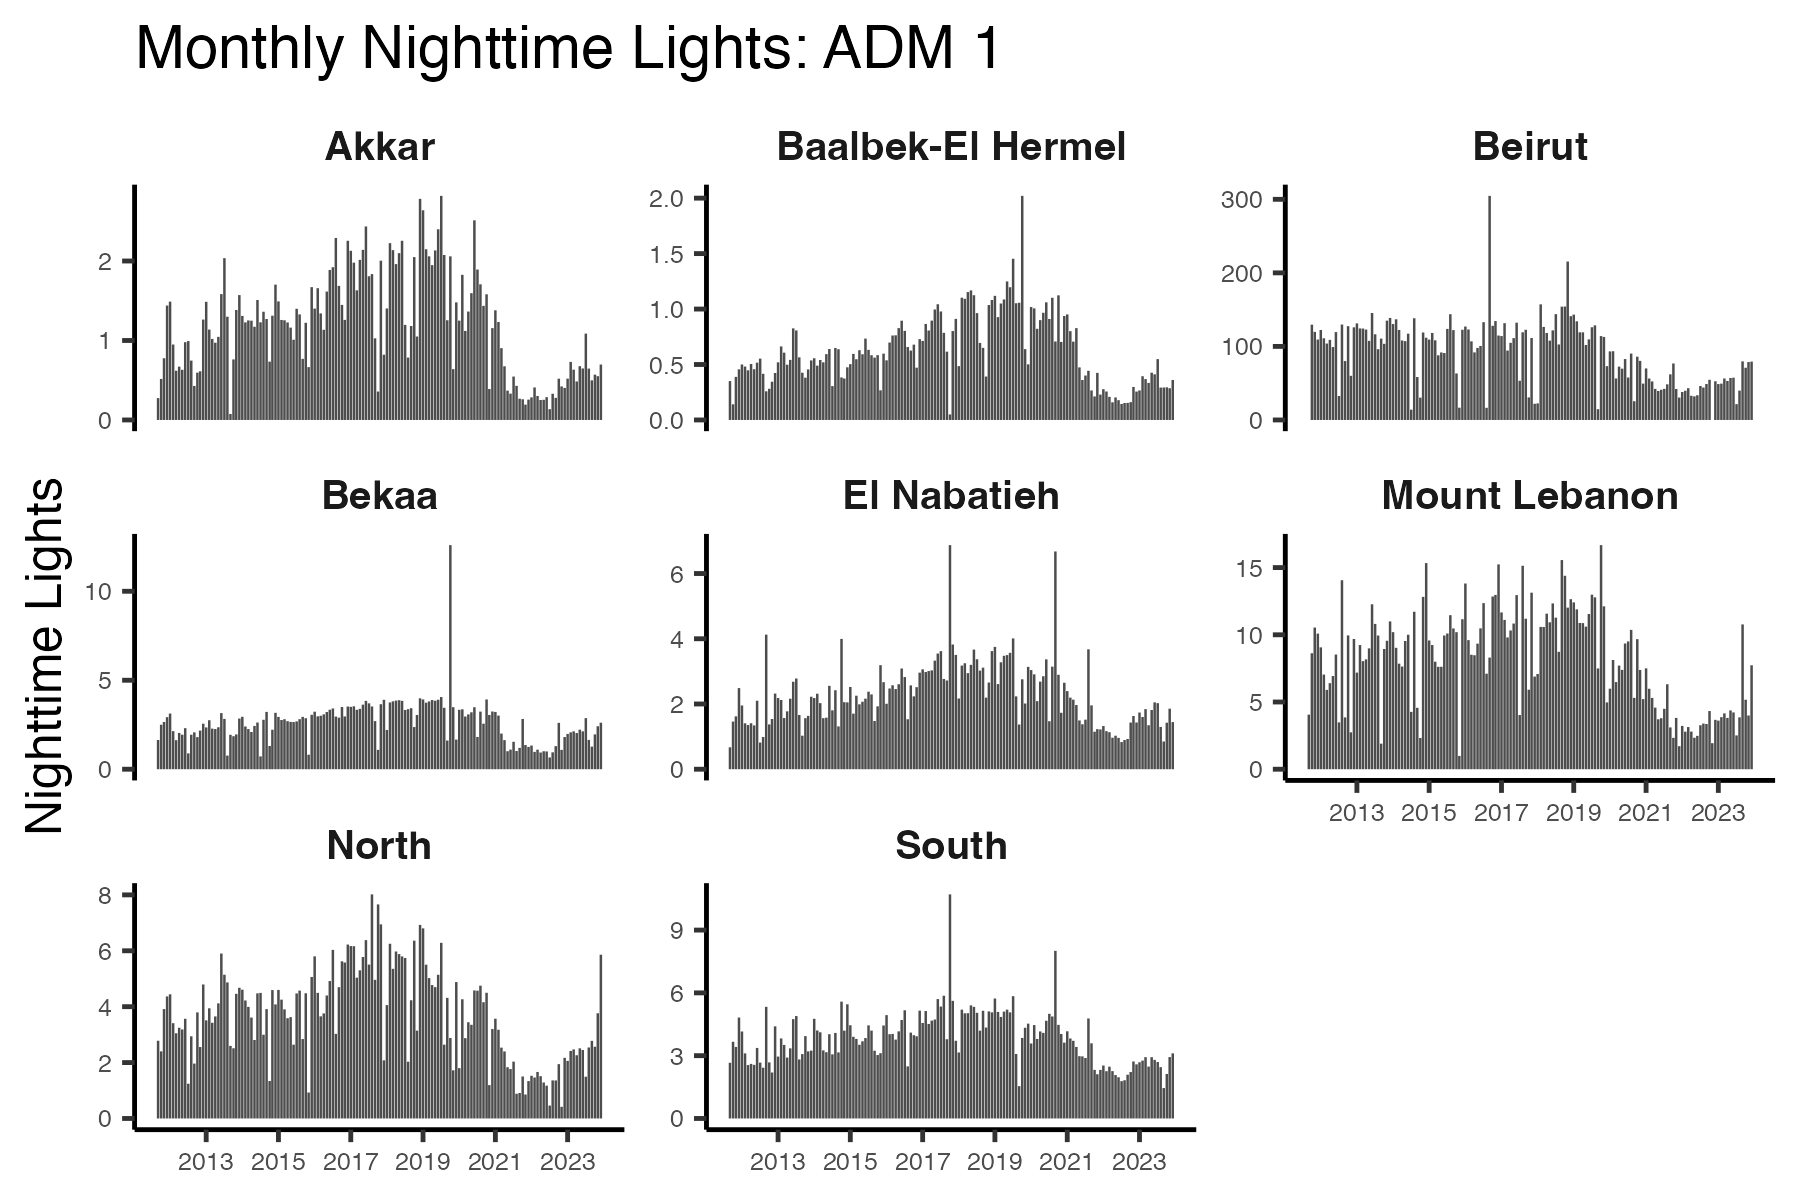
Fig. 7 Monthly Trends in Nighttime Lights: Governorate Level#
Trends in Nighttime Lights: Daily#
The below figures show trends in nighttime lights across the country (top figure) and at the first administrative division level (bottom figure). The figures show nighttime lights increasing across the country from 2015 to 2019, where nighttime lights then started to notably decline each year since.

Fig. 8 Daily Trends in GDP Nighttime Lights: Country Level#
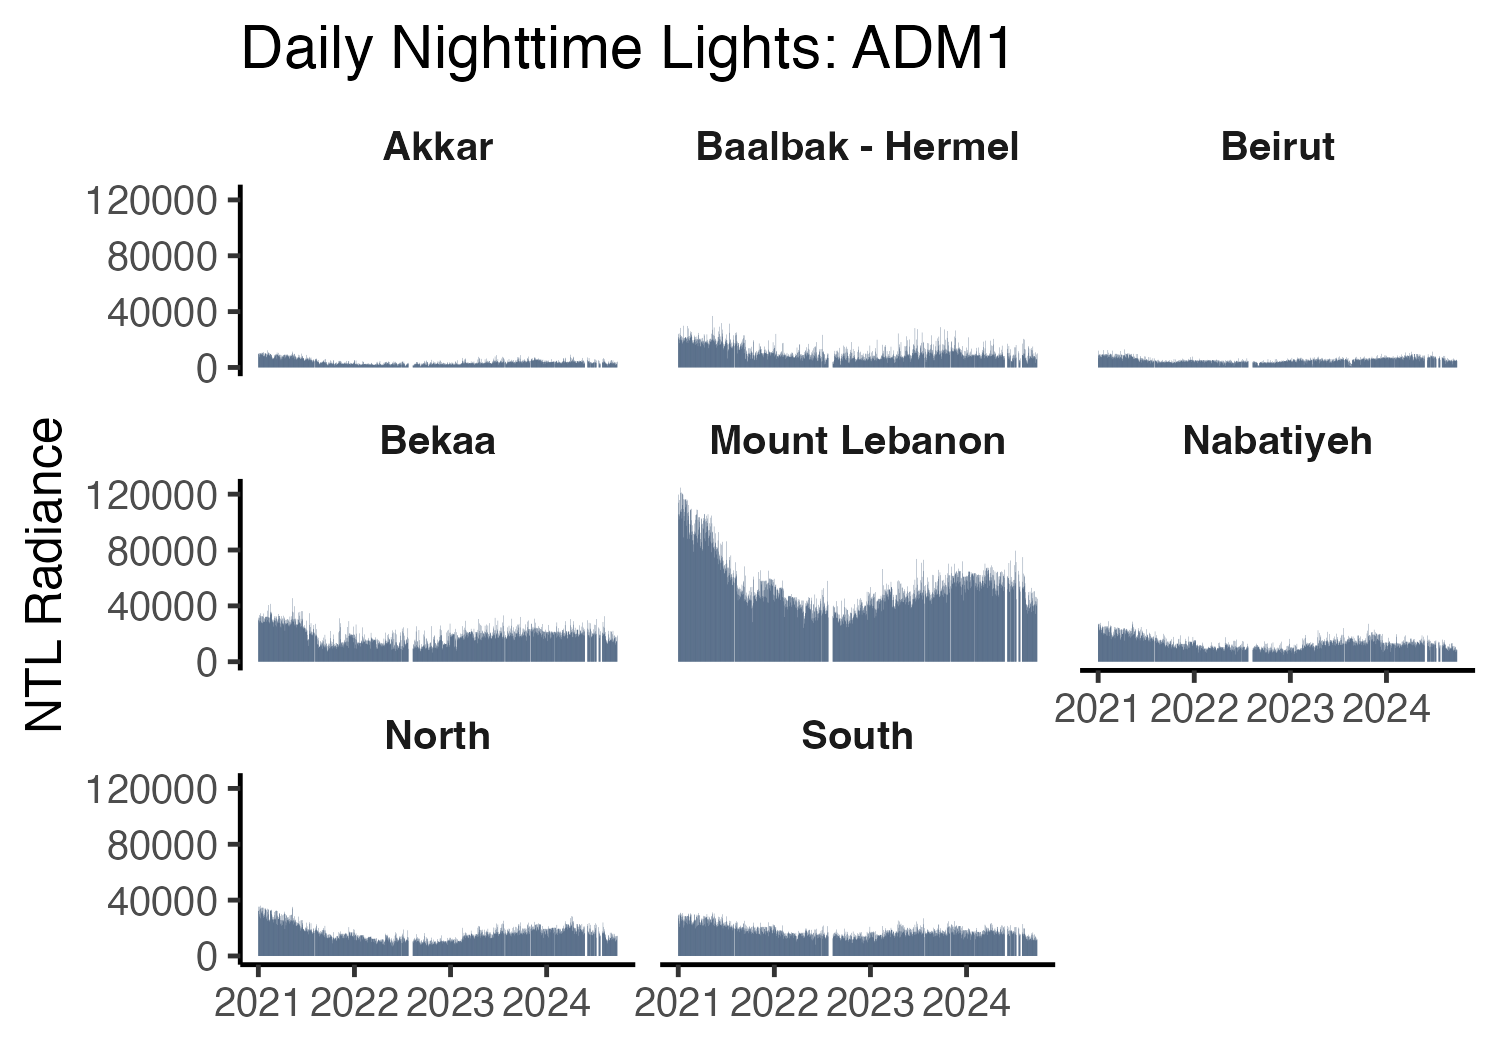
Fig. 9 Daily Trends in Nighttime Lights: Governorate Level#
Change in Nighttime Lights: Pixel Level#
2012 to 2023#
The below figures show changes at the 500 meter pixel level from 2012 to 2023.

Fig. 10 Change in Nighttime Lights#
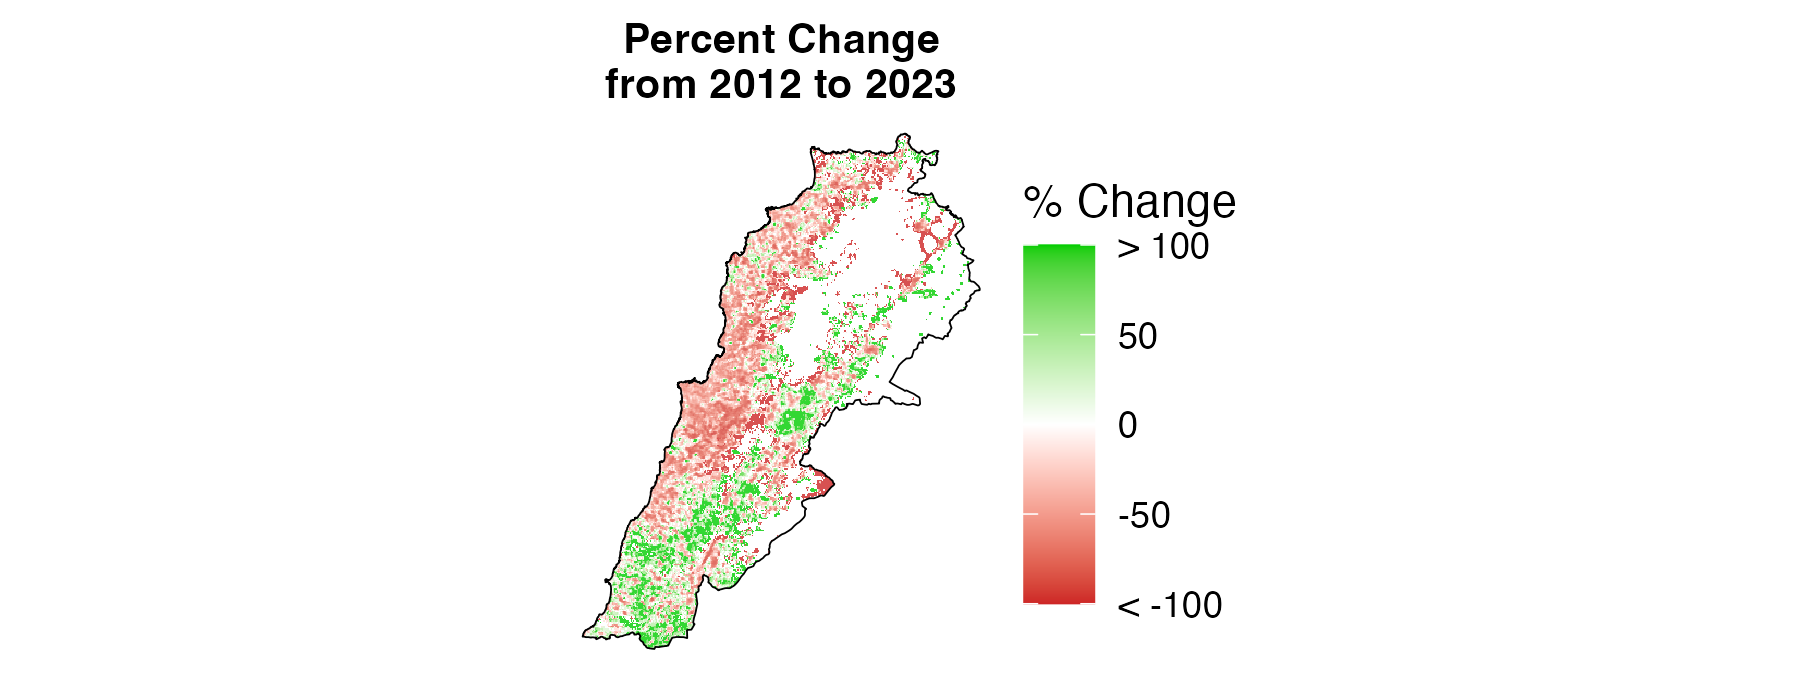
Fig. 11 Percent Change in Nighttime Lights#
2010 to 2012#
The below figures show changes at the 1 kilometer pixel level from 2010 to 2012.
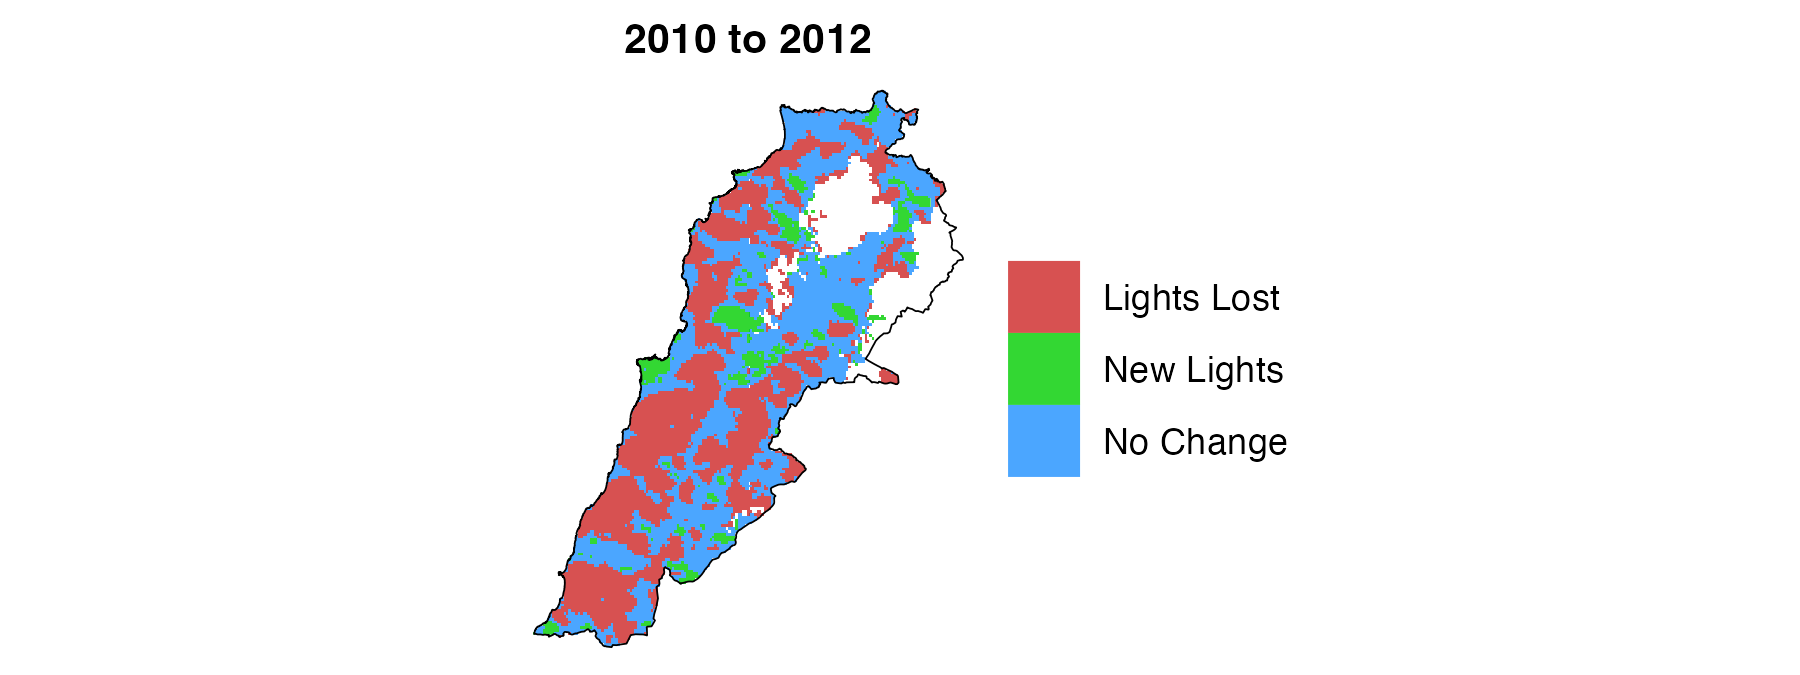
Fig. 12 Change in Nighttime Lights#

Fig. 13 Change in Nighttime Lights#
2011 to 2012#
The below figures show changes at the 1 kilometer pixel level from 2011 to 2012.
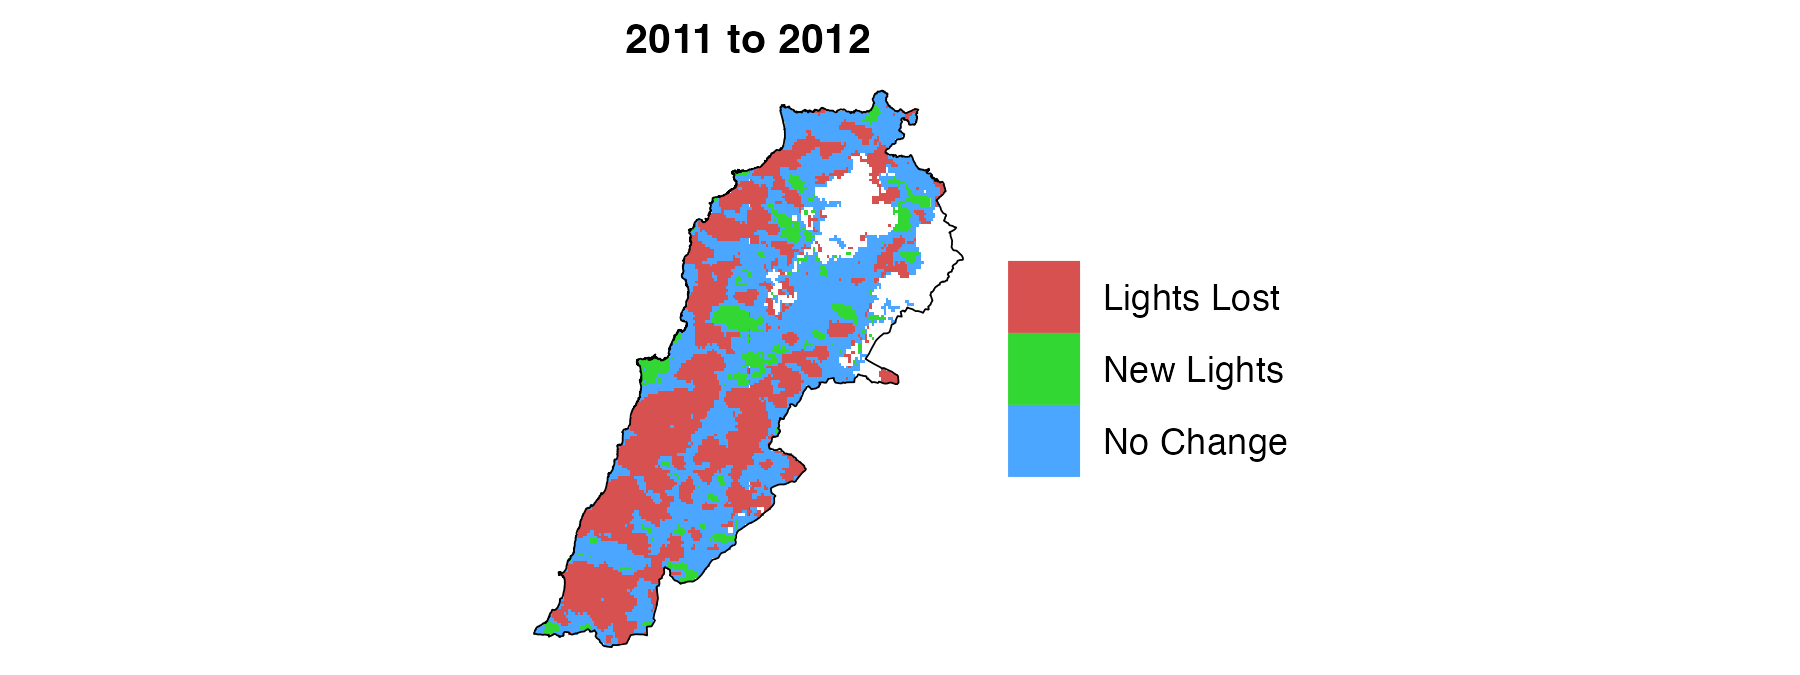
Fig. 14 Change in Nighttime Lights#

Fig. 15 Change in Nighttime Lights#
Change in Nighttime Lights: Different ADM Levels#
This section shows the percent change in nighttime lights from 2019, 2020, 2021, 2022 until 2023 at different administrative levels. The first set of figures show maps of the percent change, and the second set show tables of percent change. The maps and tables show that administrative regions throughout Lebanaon experienced a sharp reduction in nighttime lights from 2019 to 2023. At the first administrative 1 level, the smallest reduction in nighttime lights from 2019 to 2023 was about 60% (in the South)—while the largest was a 90% reduction (in Akkar). Lebanon’s two largest cities—Beirut and Tripoli—saw over a 70% reduction in nighttime lights.
Maps#
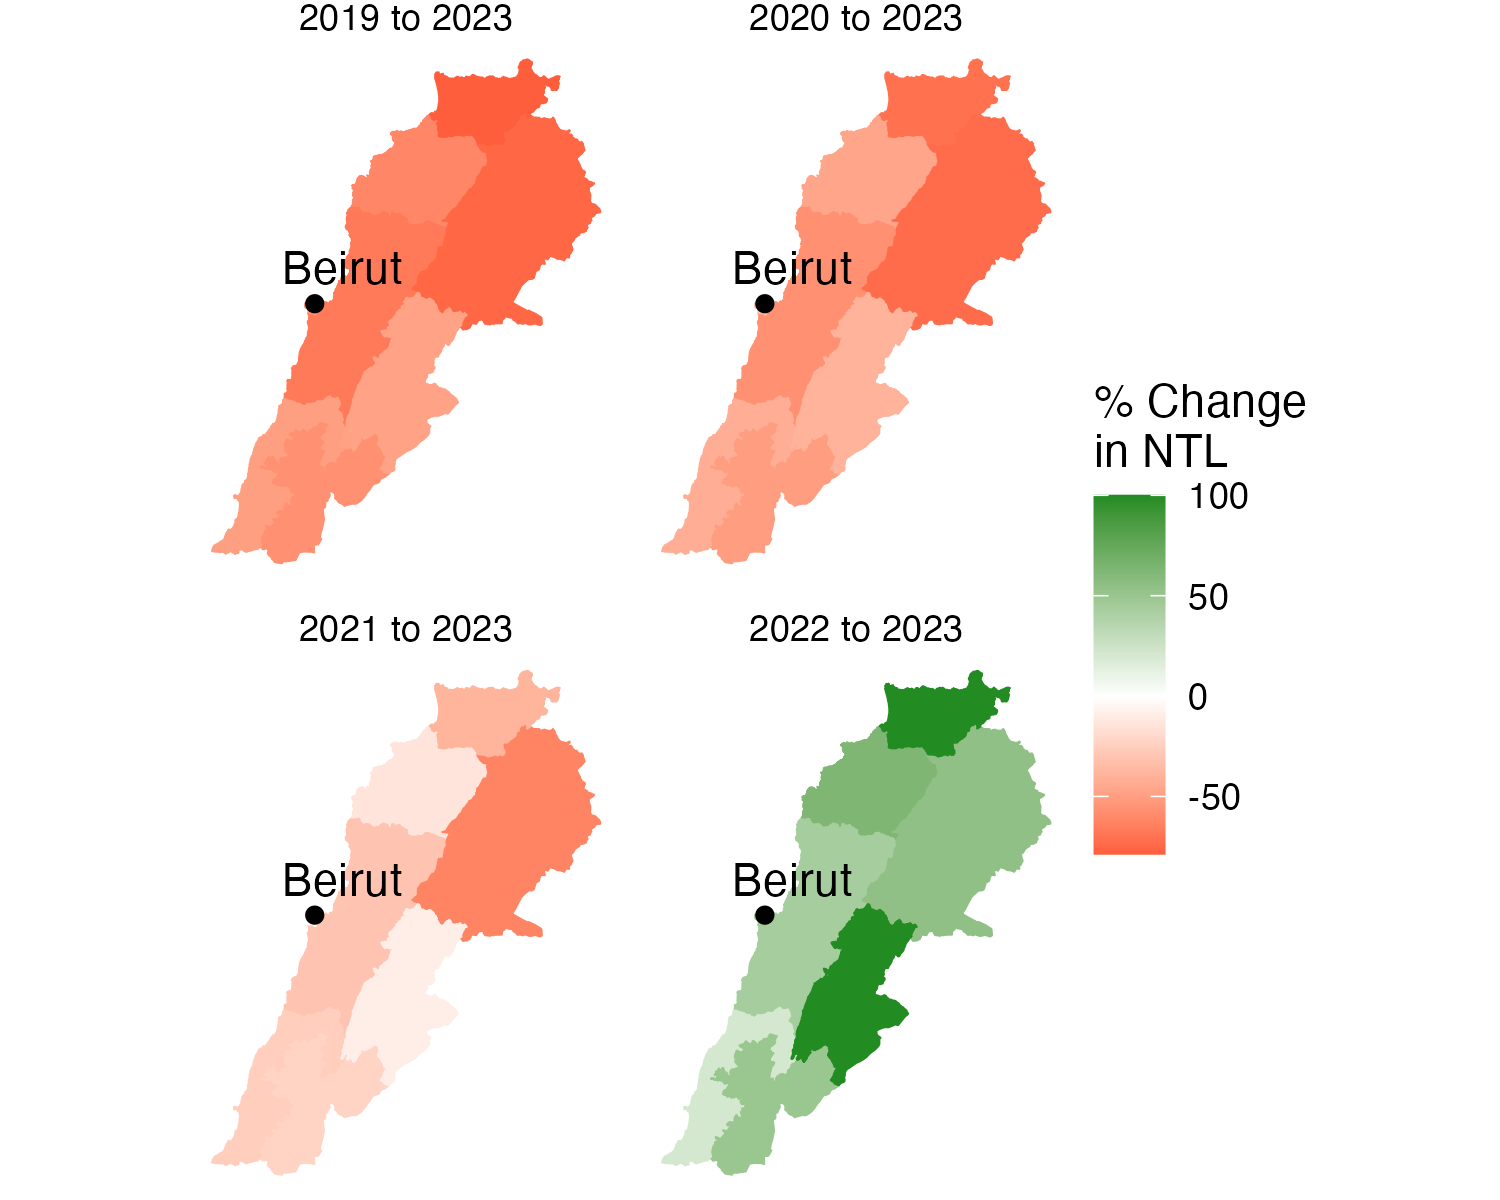
Fig. 16 Percent Change in Nighttime Lights: ADM 1#
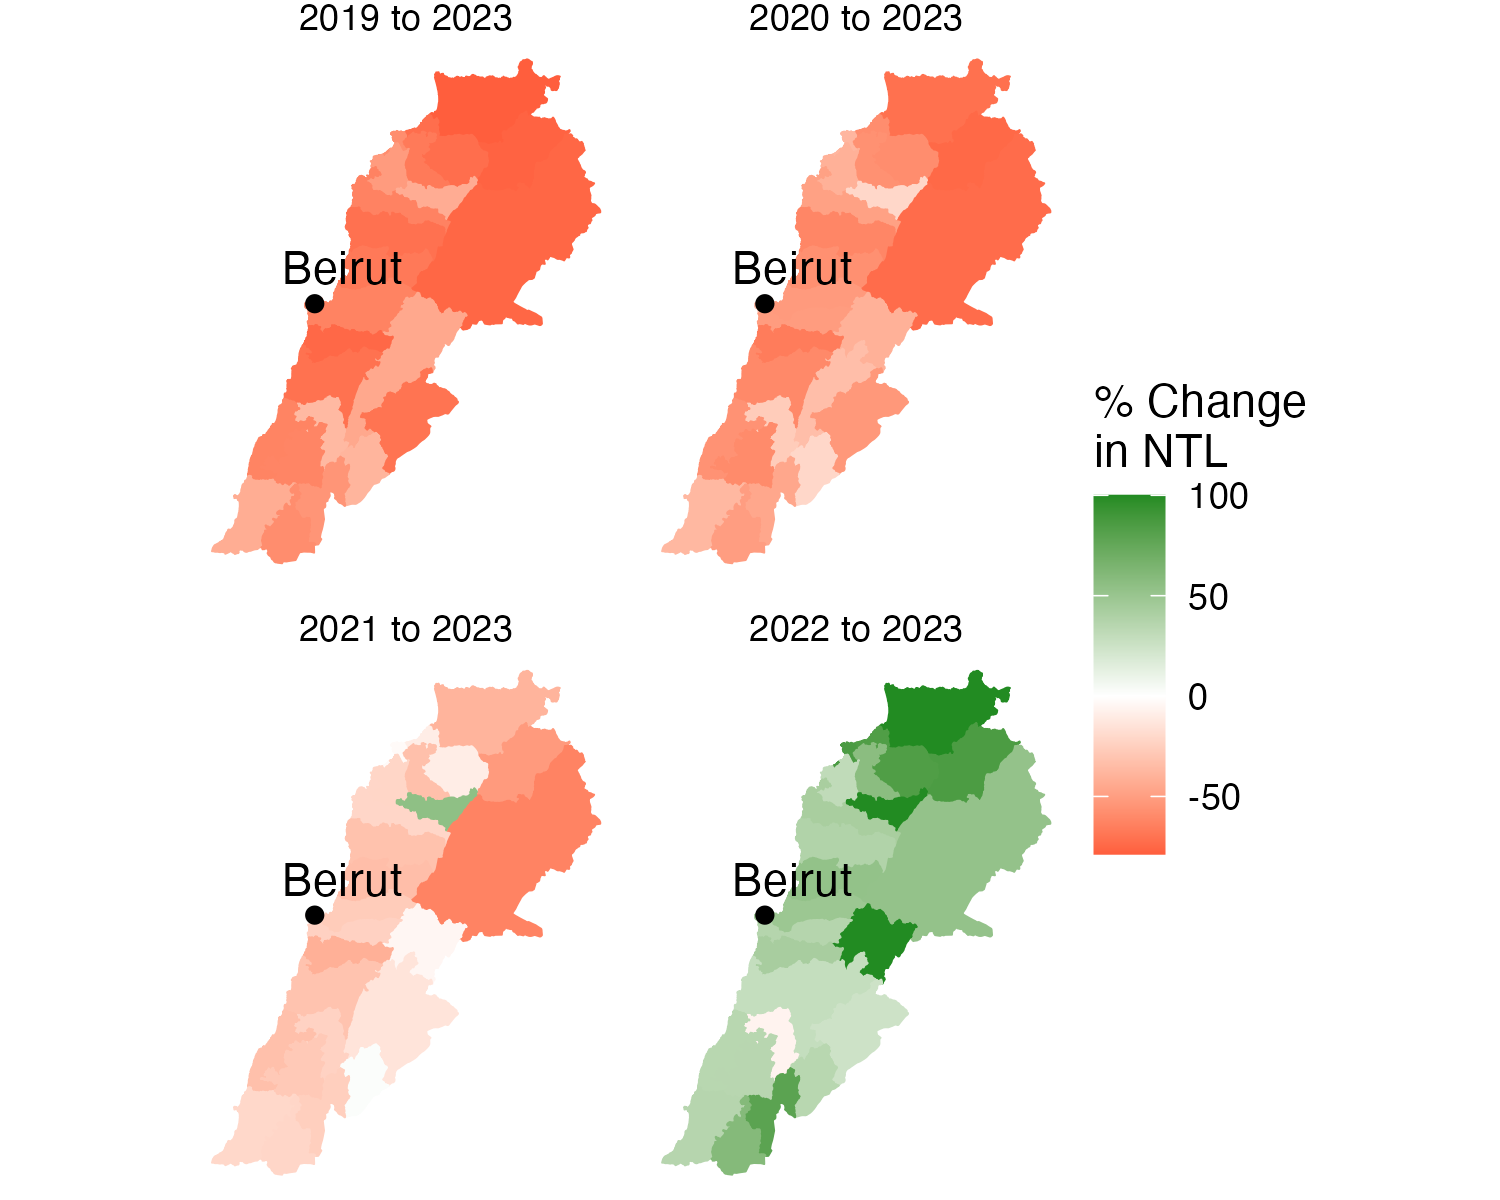
Fig. 17 Percent Change in Nighttime Lights: ADM 2#
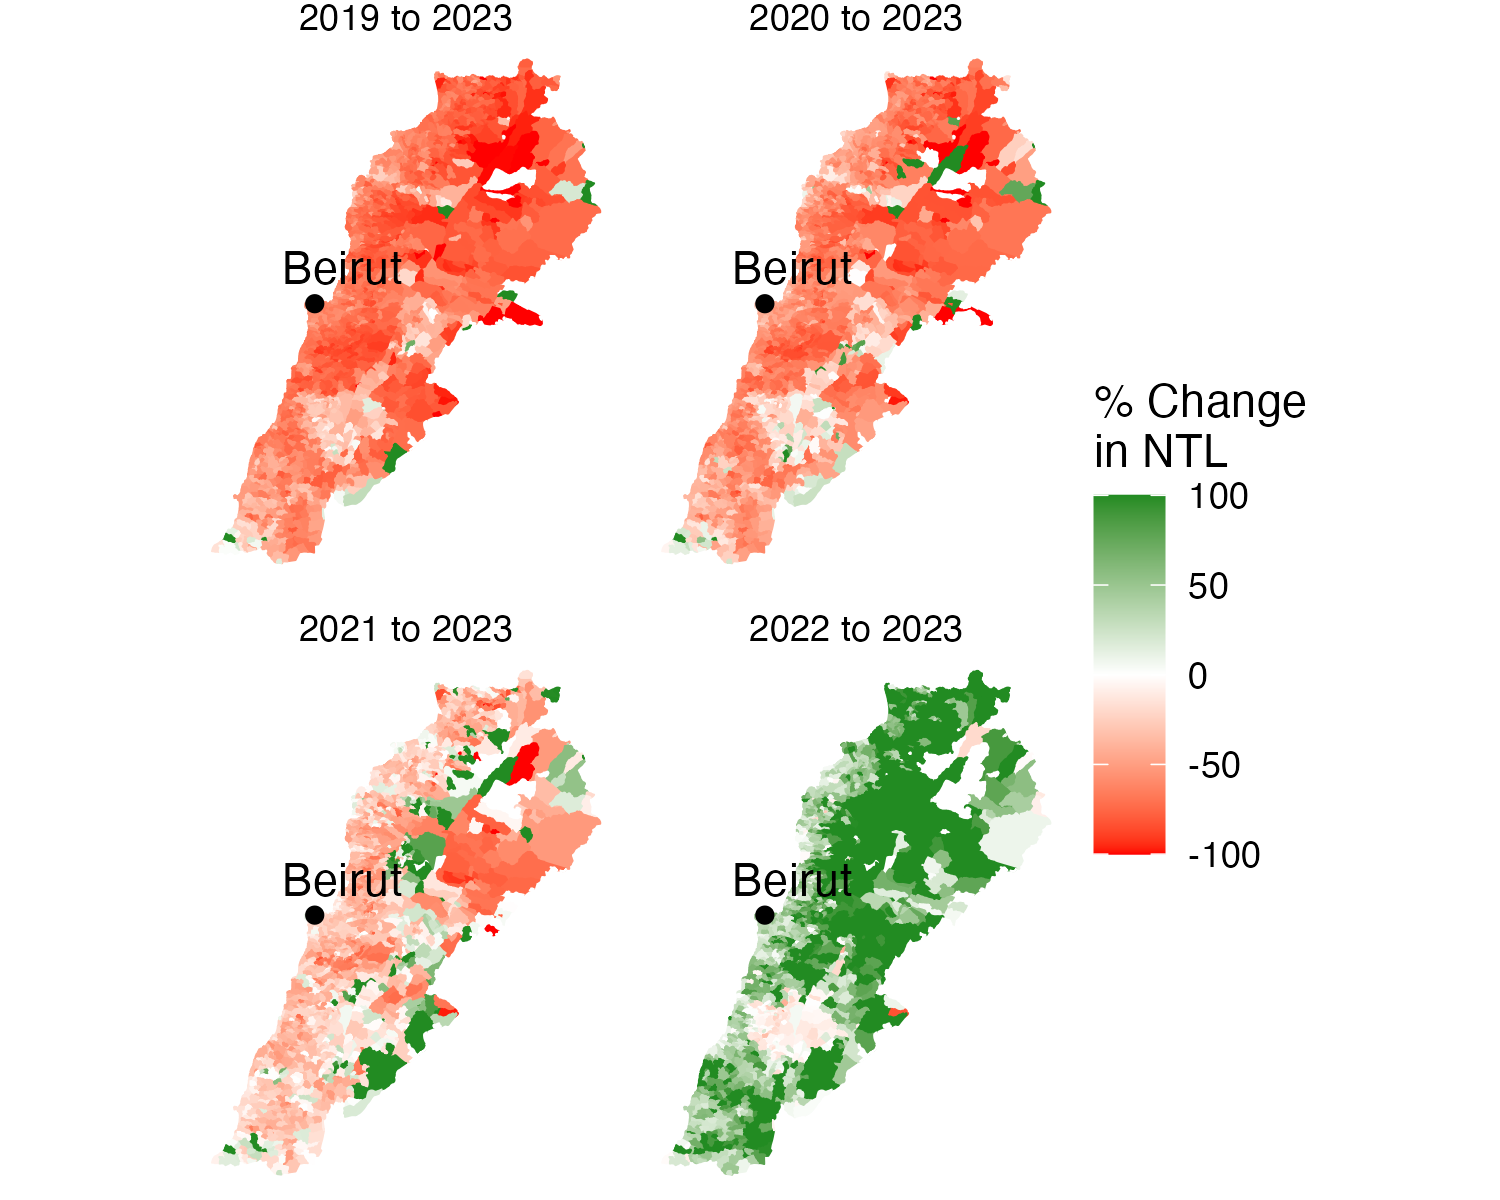
Fig. 18 Percent Change in Nighttime Lights: ADM 3#
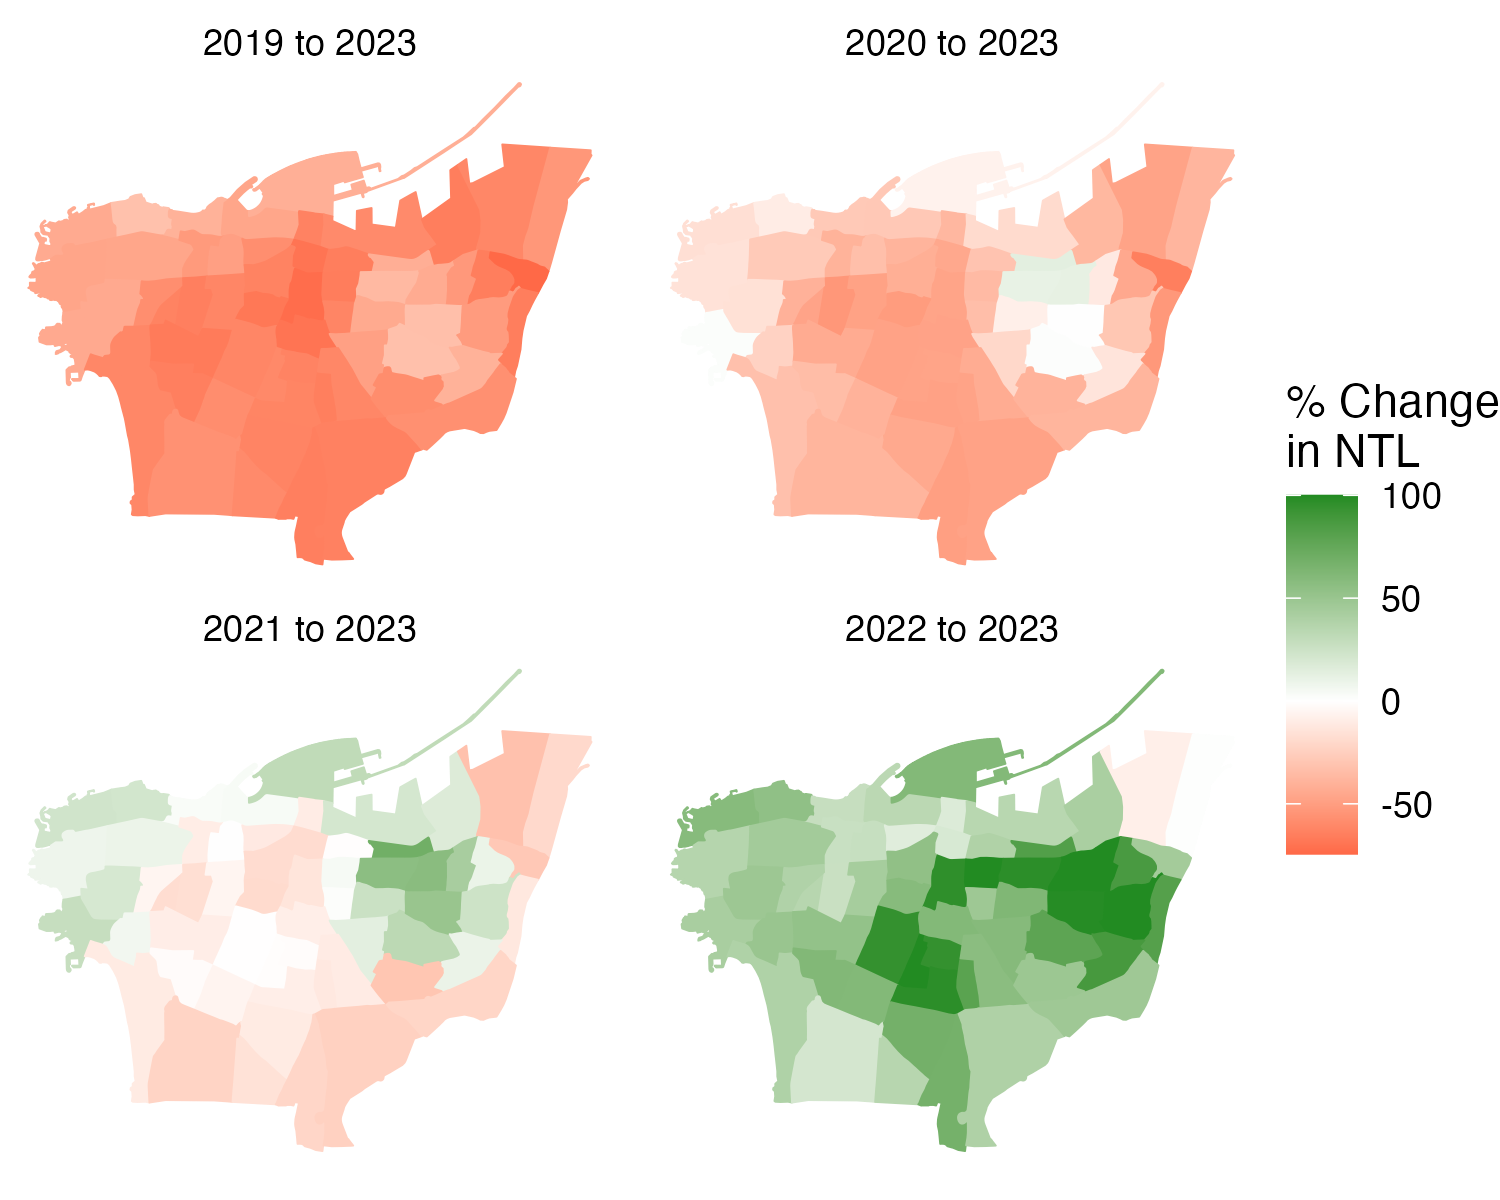
Fig. 19 Percent Change in Nighttime Lights: ADM 4 in Beirut#
Tables#
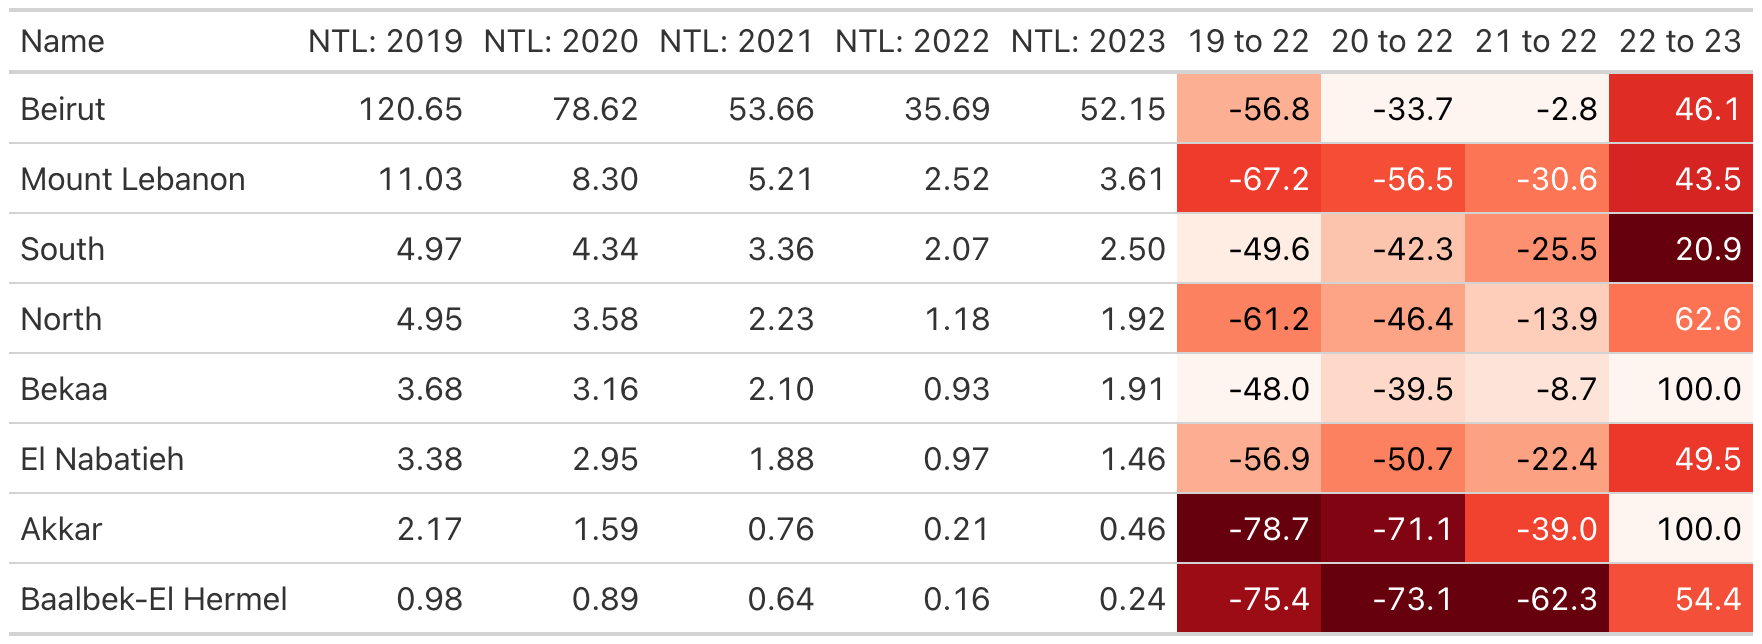
Fig. 20 Percent Change in Nighttime Lights: ADM 1 - Ordered by Nighttime Lights in 2019#
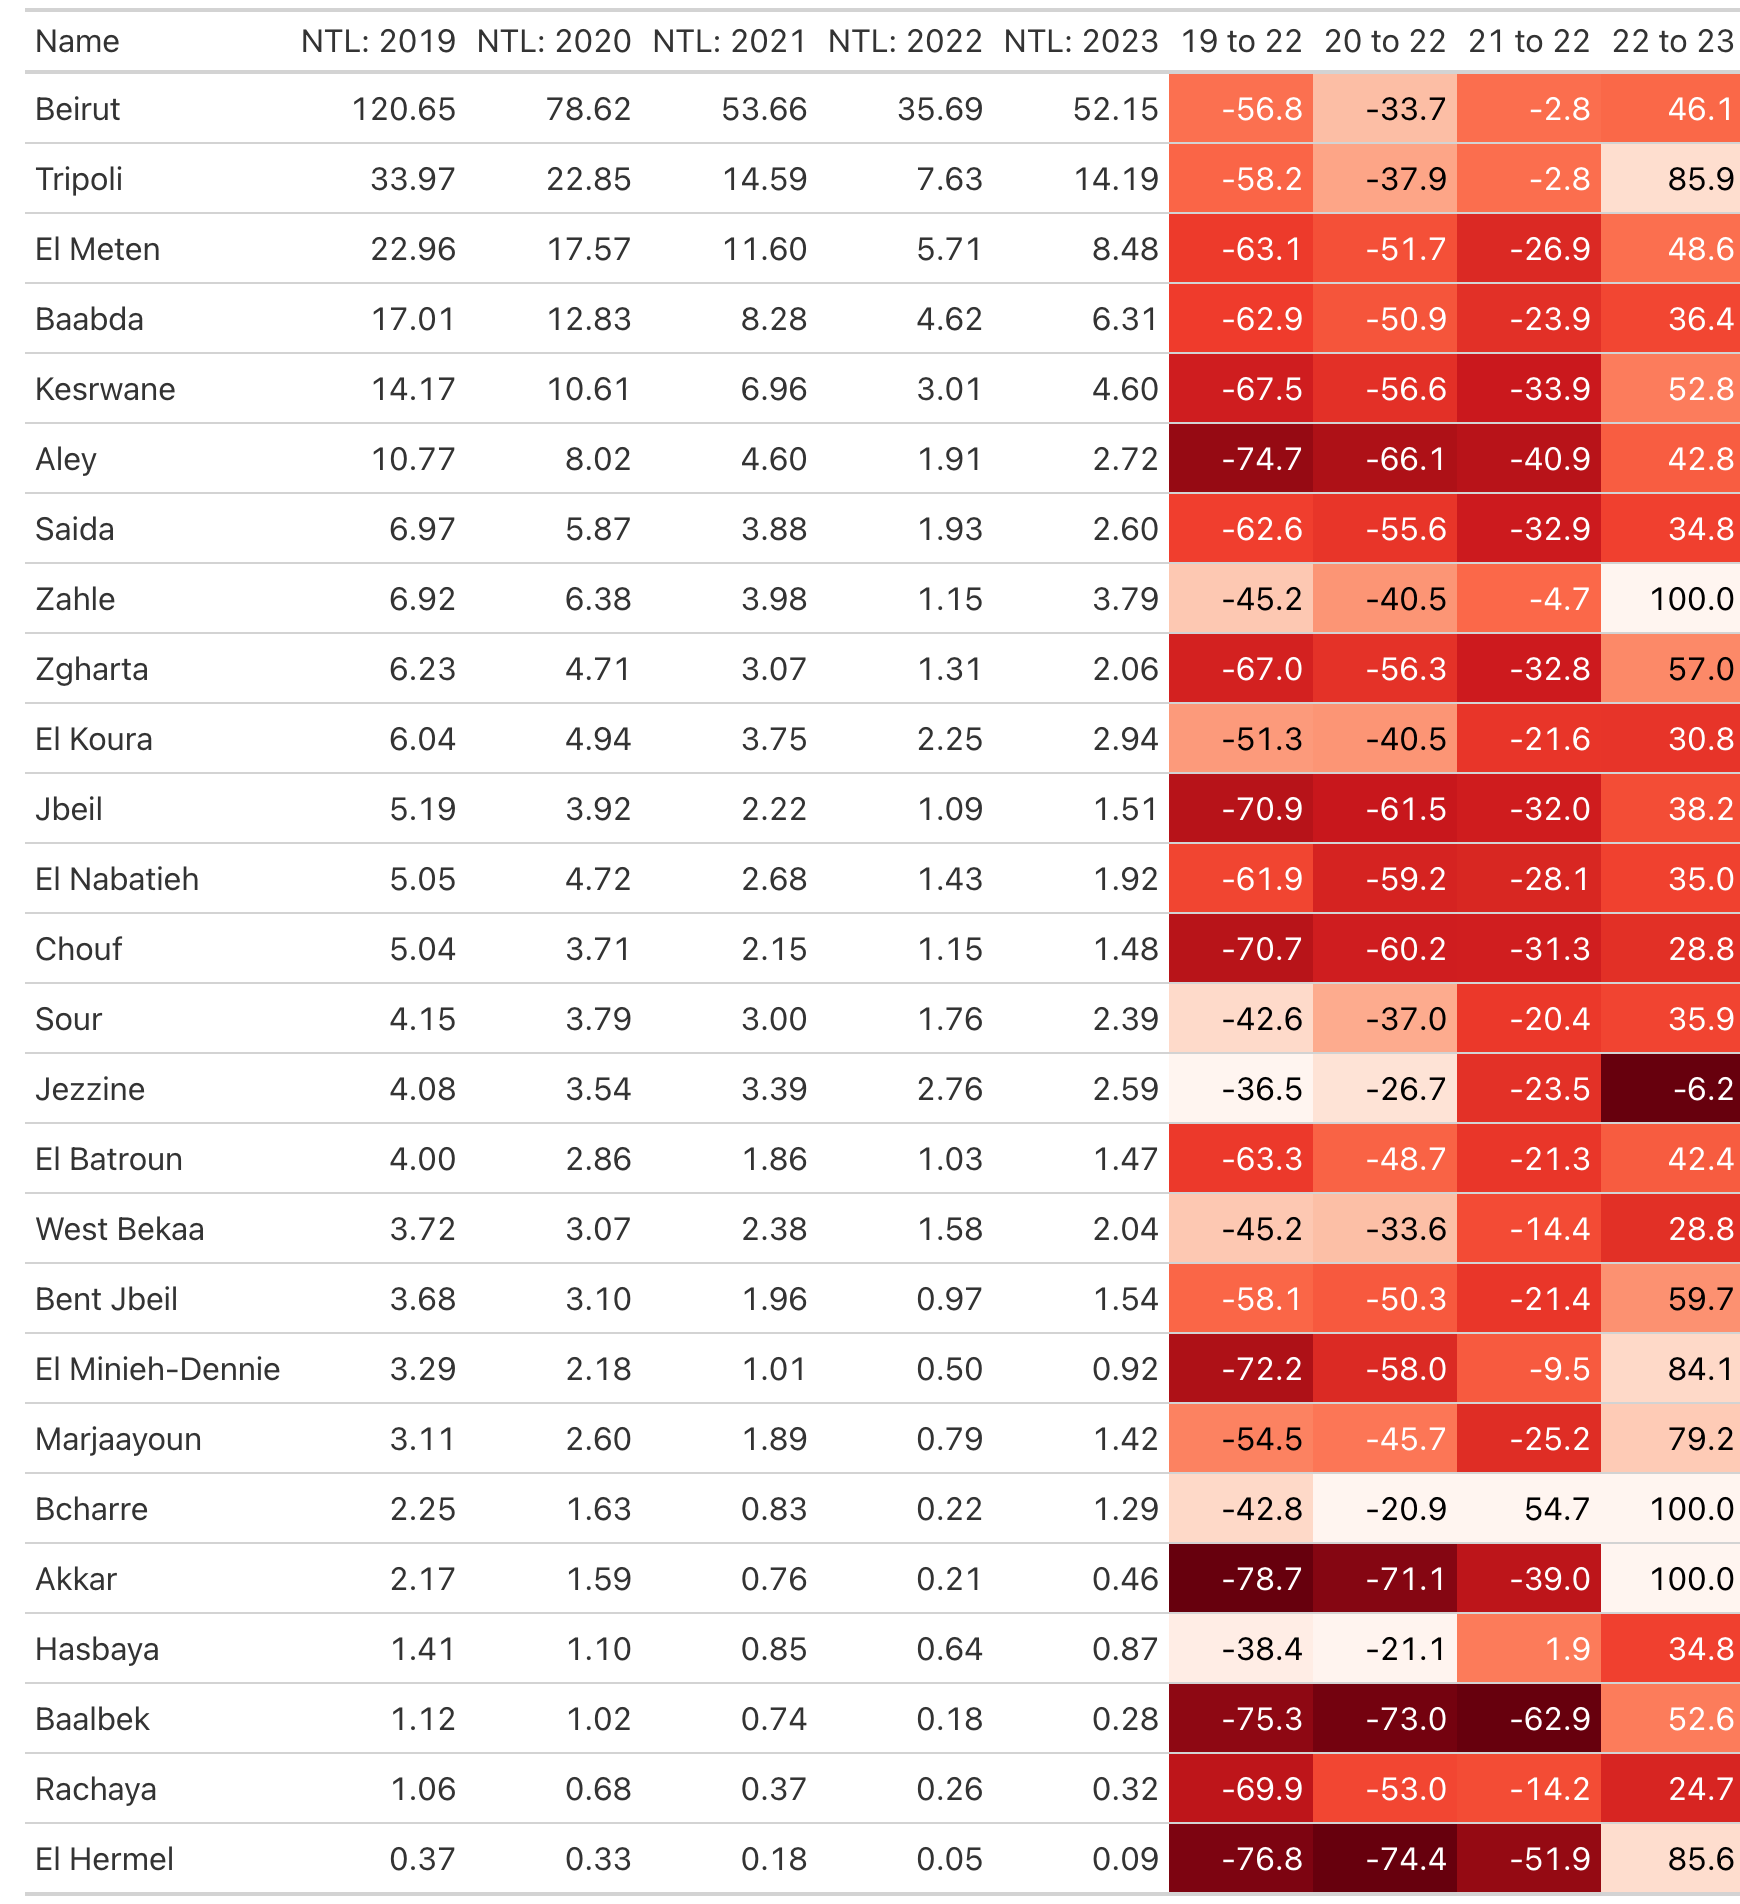
Fig. 21 Percent Change in Nighttime Lights: ADM 2 - Ordered by Nighttime Lights in 2019#
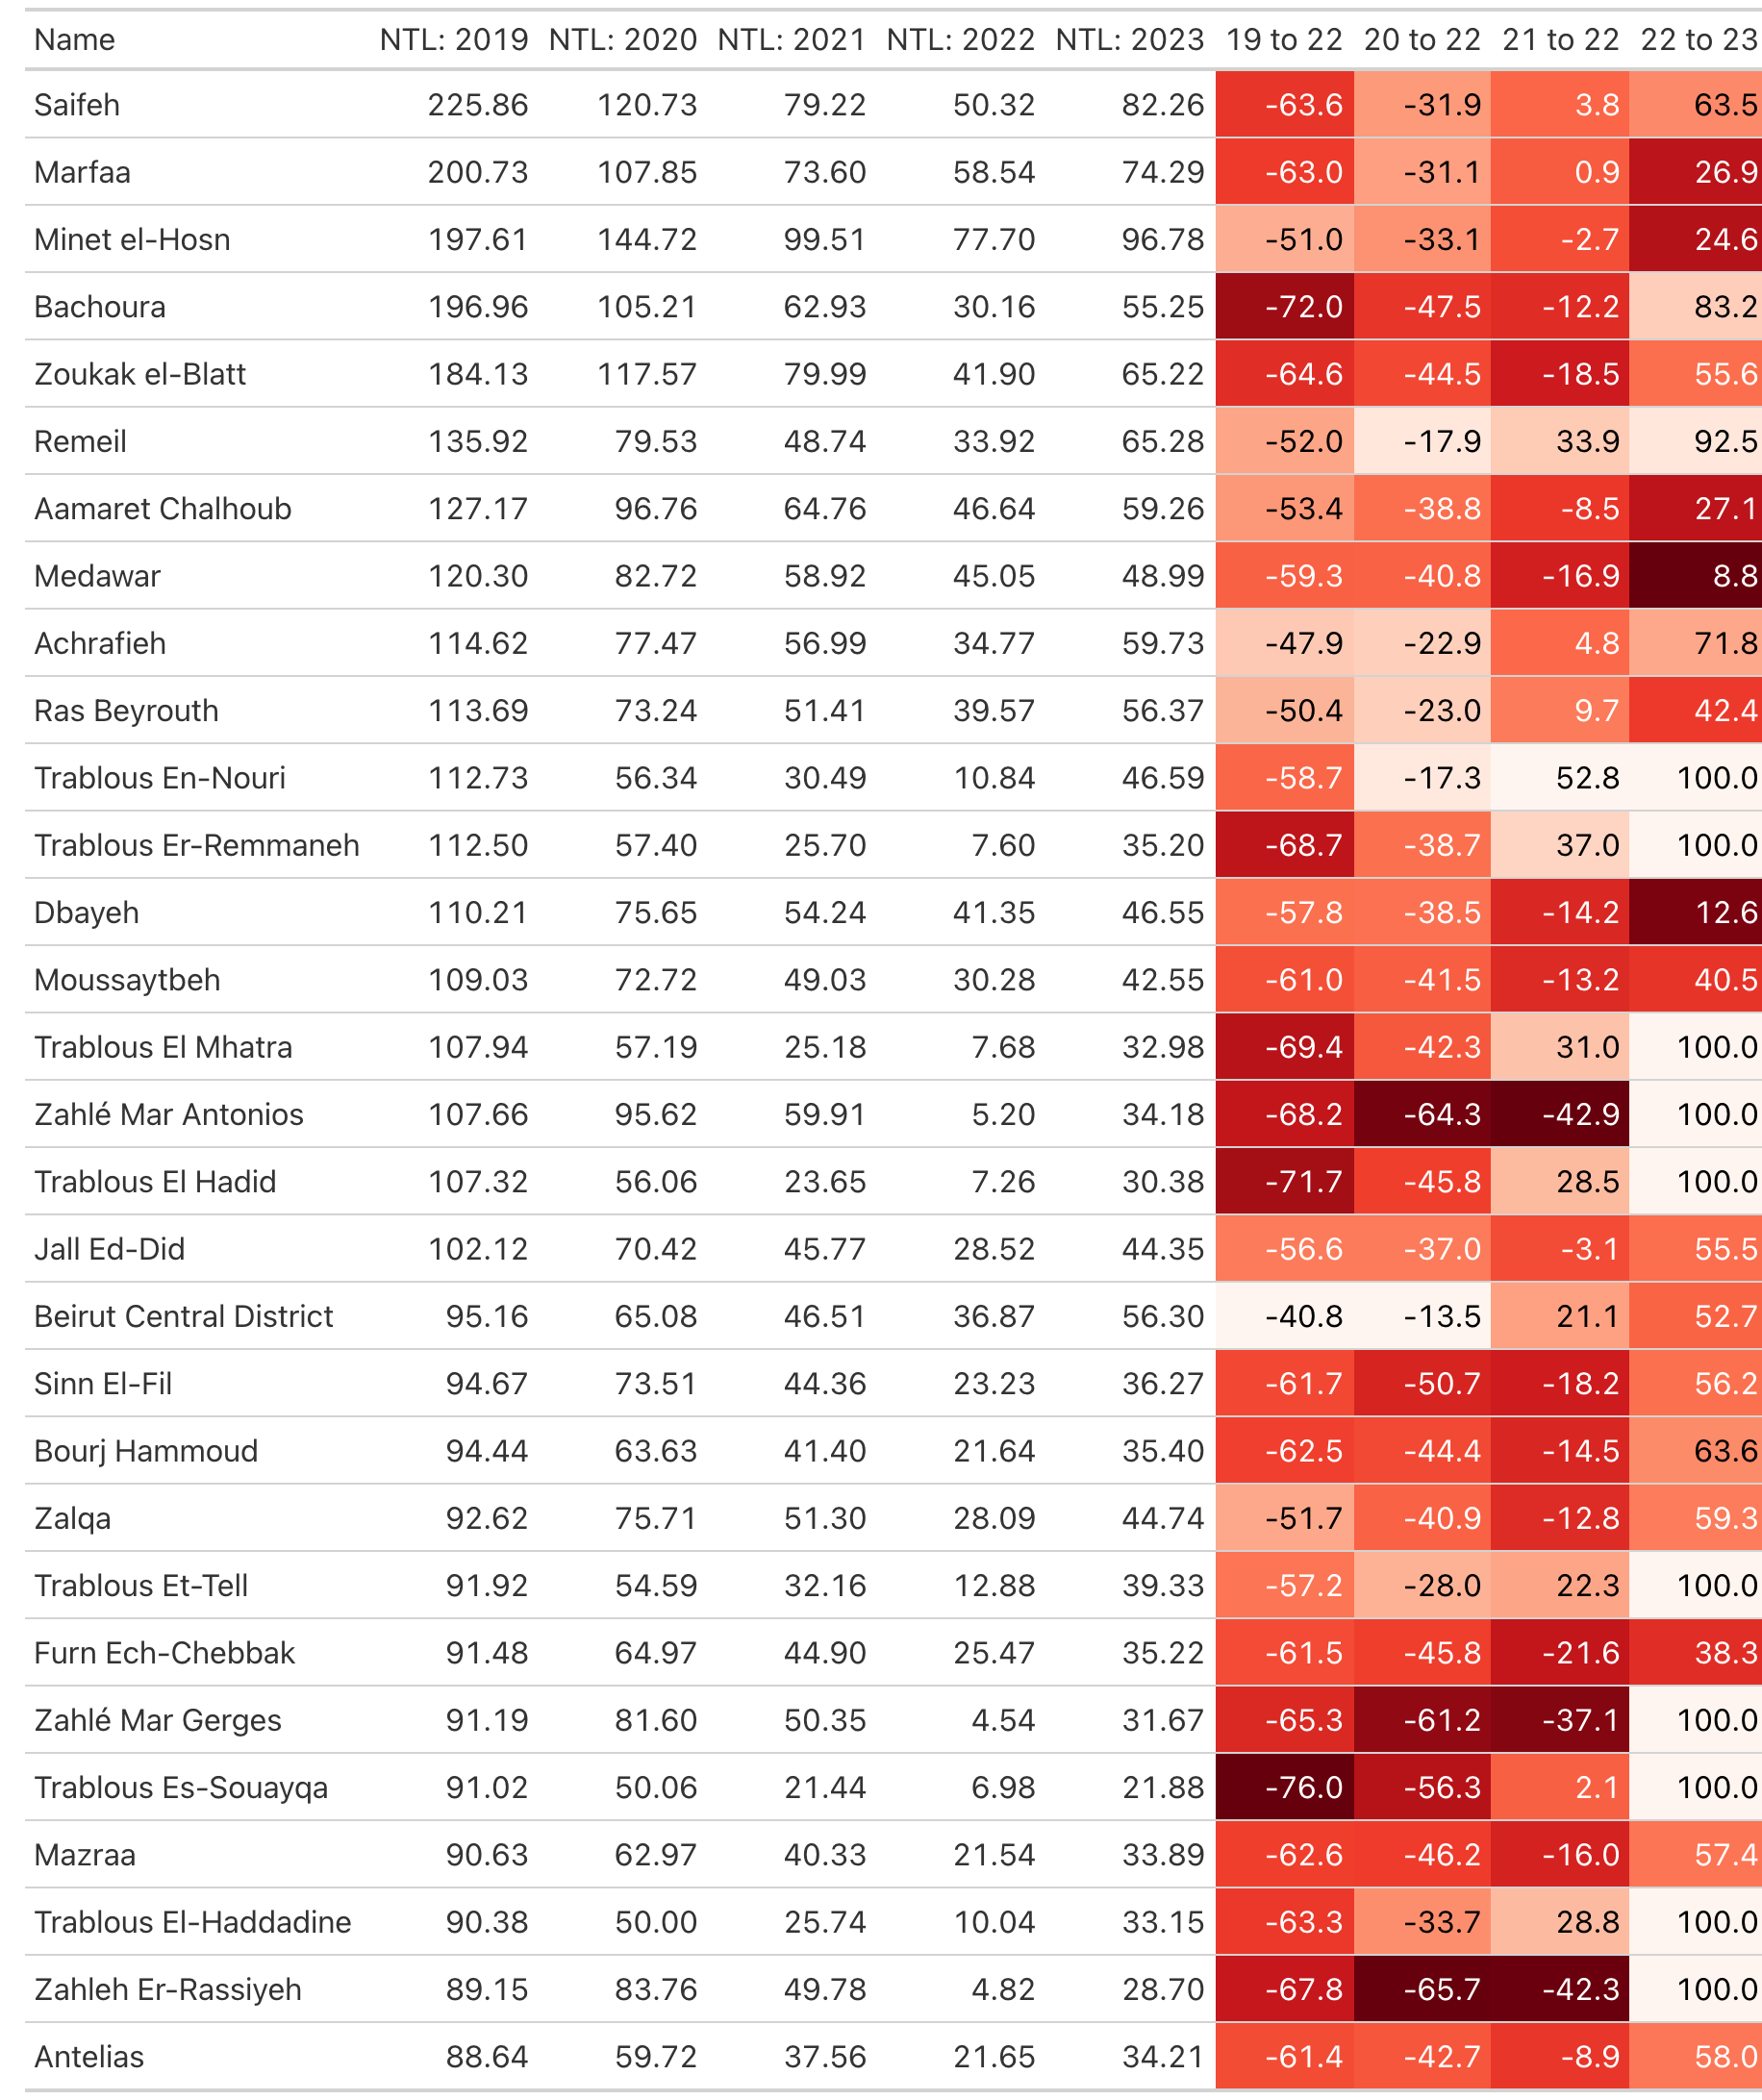
Fig. 22 Percent Change in Nighttime Lights: ADM 3 - Ordered by Nighttime Lights in 2019. The 30 locations with the largest nighttime lights in 2019 are shown.#
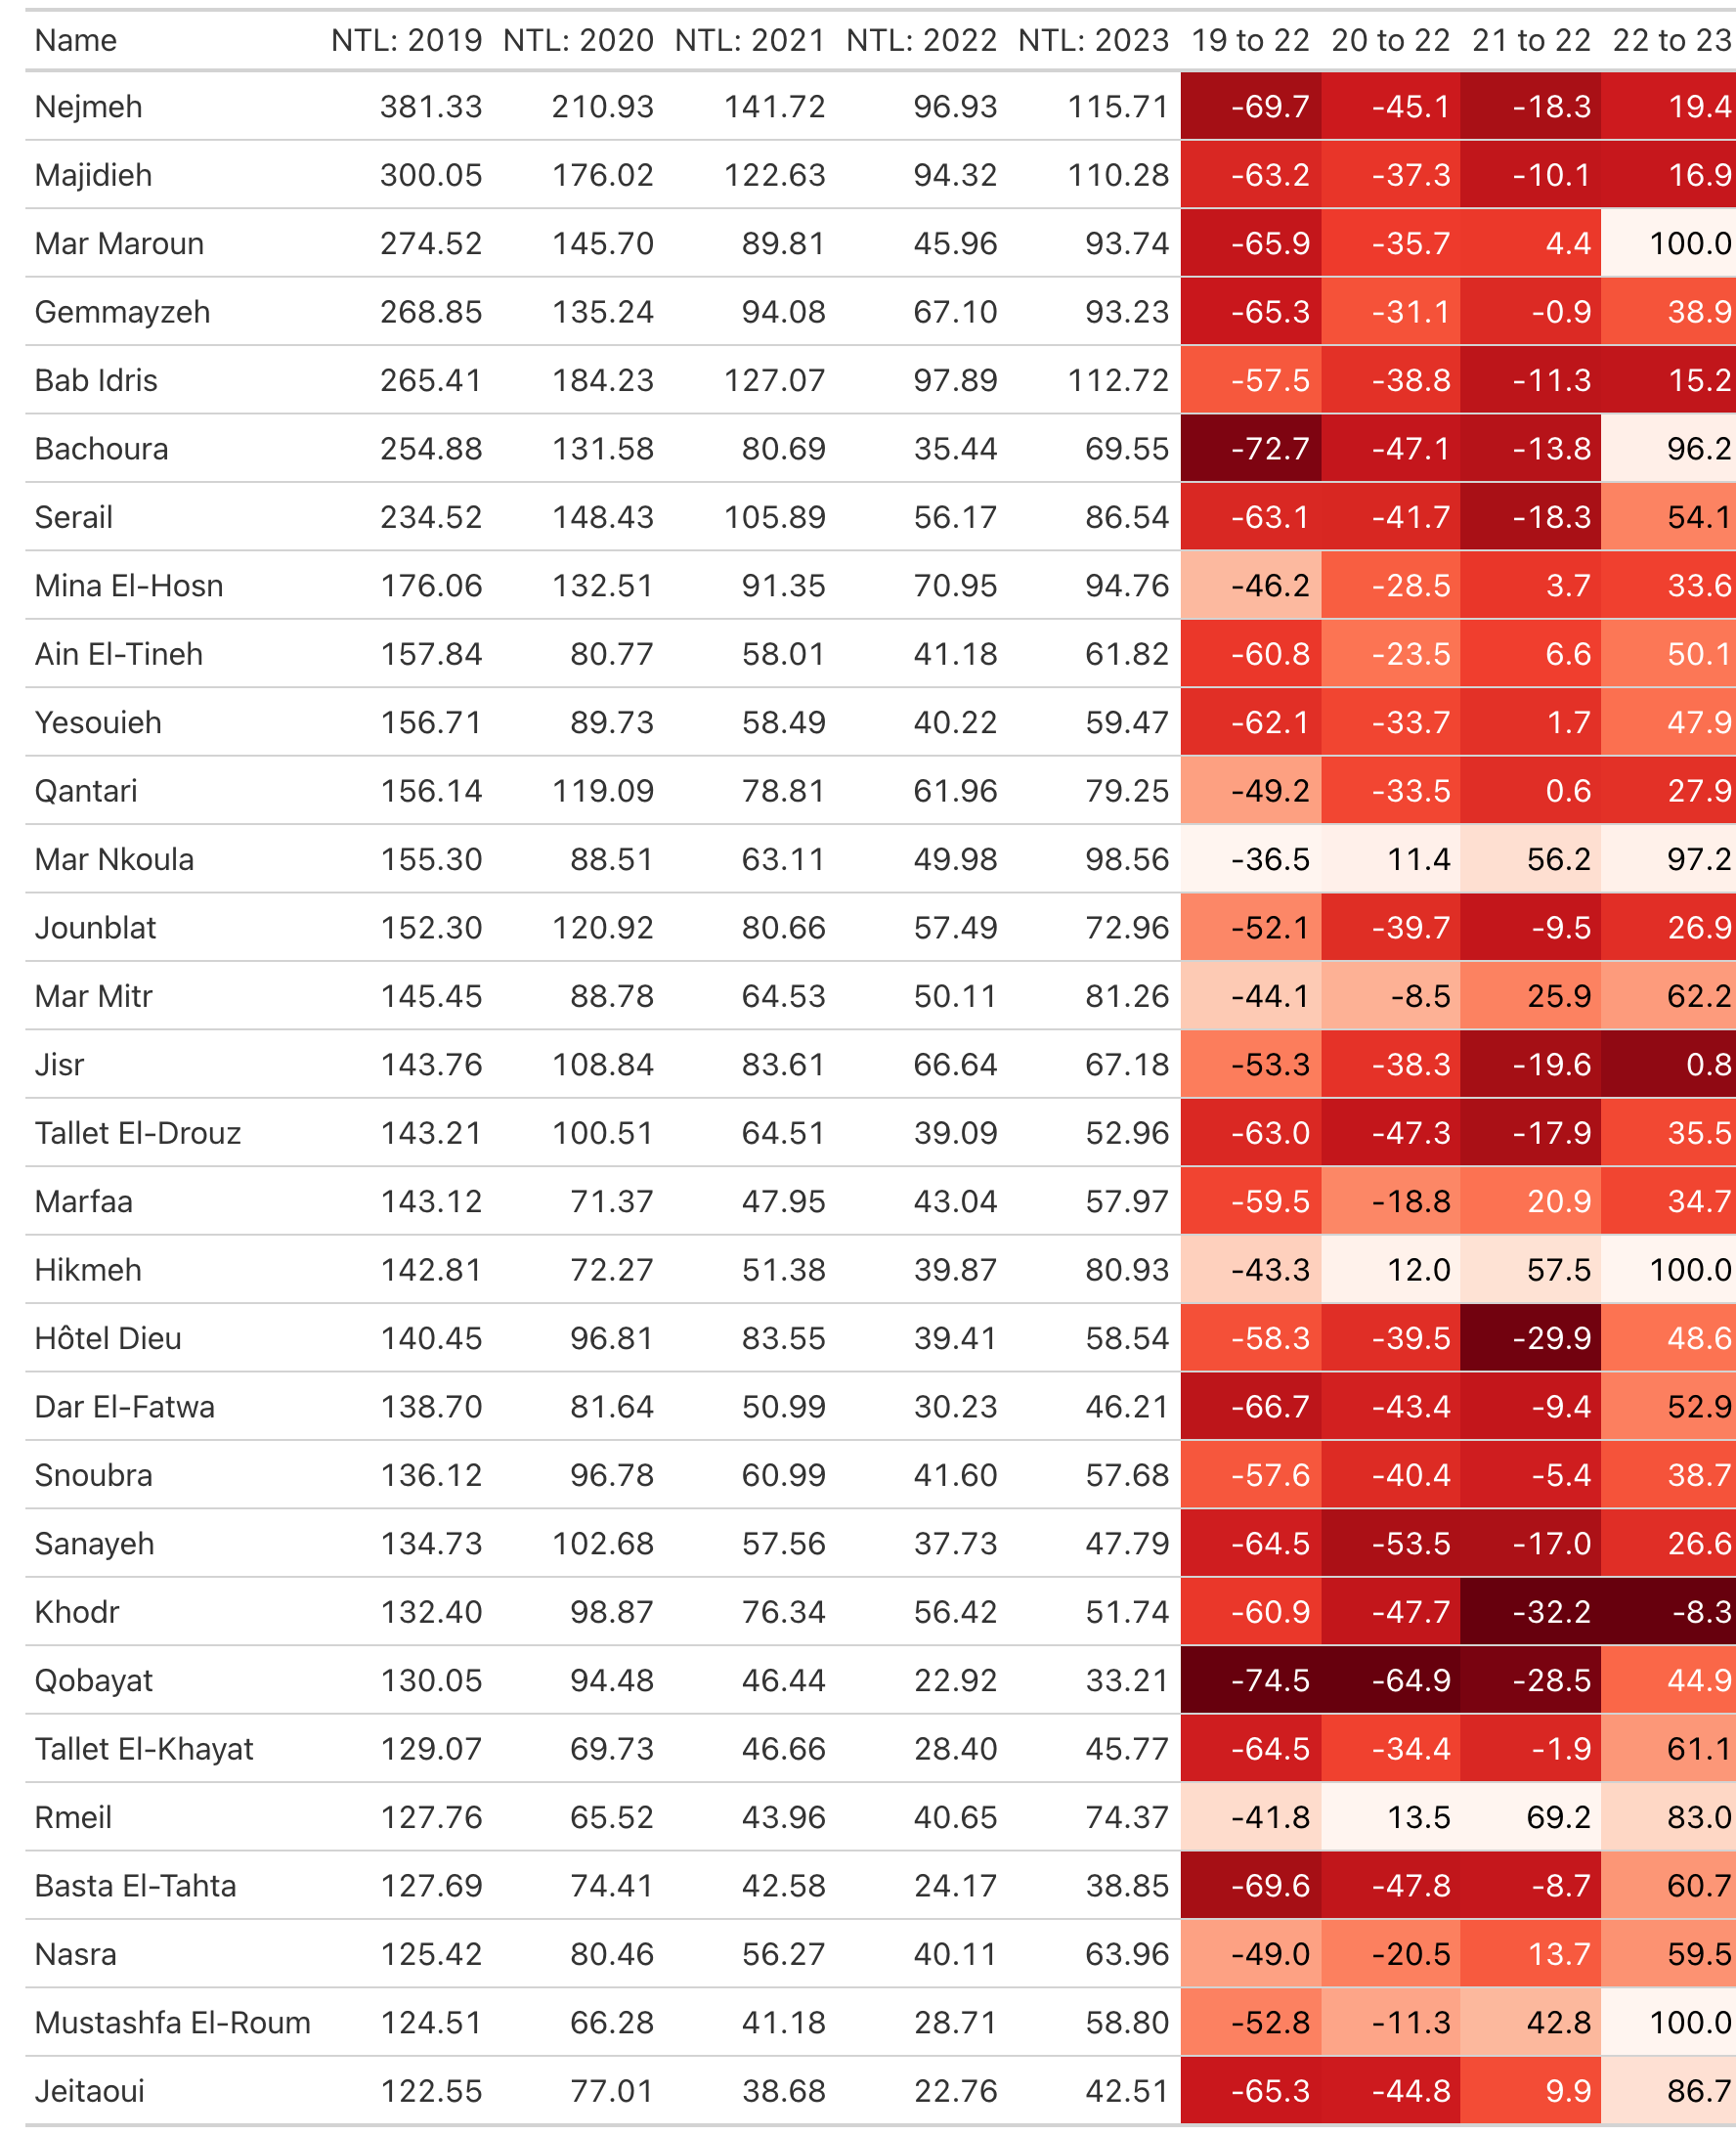
Fig. 23 Percent Change in Nighttime Lights: ADM 4 in Beirut - Ordered by Nighttime Lights in 2019#