NO2 Trends in Lebanon#
This notebook uses analyses the NO2 data in Lebanon and presents the insights from the analysis. Two datasets inform the analysis - NO2 dta obtained from Google Earth Engine and boundary files obtained from HDX.
Accessing the data#
SharePoint: The raw data queried from Google Earth Engine has been uploaded to SharePoint.
Boundary Files: The boundary files used to plot air pollution geospatially were obtained from HDX.
Insights#
Show code cell source
output_notebook()
bokeh.core.validation.silence(EMPTY_LAYOUT, True)
bokeh.core.validation.silence(MISSING_RENDERERS, True)

df = (
    monthly_no2_adm1.groupby(["admin1Name", "date"])
    .mean("NO2_column_number_density")
    .reset_index()
)

show(
    get_line_chart(
        df,
        category="admin1Name",
        title="Monthly Air Pollution in Lebanon by Admin 1",
        source="Copernicus",
        measure="NO2_column_number_density",
    )
)
Show code cell source
output_notebook()
bokeh.core.validation.silence(EMPTY_LAYOUT, True)
bokeh.core.validation.silence(MISSING_RENDERERS, True)

tabs = []

for adm in list(monthly_no2_adm2["admin1Name"].unique()):
    df = monthly_no2_adm2[monthly_no2_adm2["admin1Name"] == adm]

    tabs.append(
        Panel(
            child=get_line_chart(
                df,
                "Montly Air Pollution at Admin 2",
                "Source: Copernicus",
                category="admin2Name",
                measure="NO2_column_number_density",
            ),
            title=adm.capitalize(),
        )
    )

tabs = Tabs(tabs=tabs, sizing_mode="scale_both")
show(tabs, warn_on_missing_glyphs=False)
Show code cell source
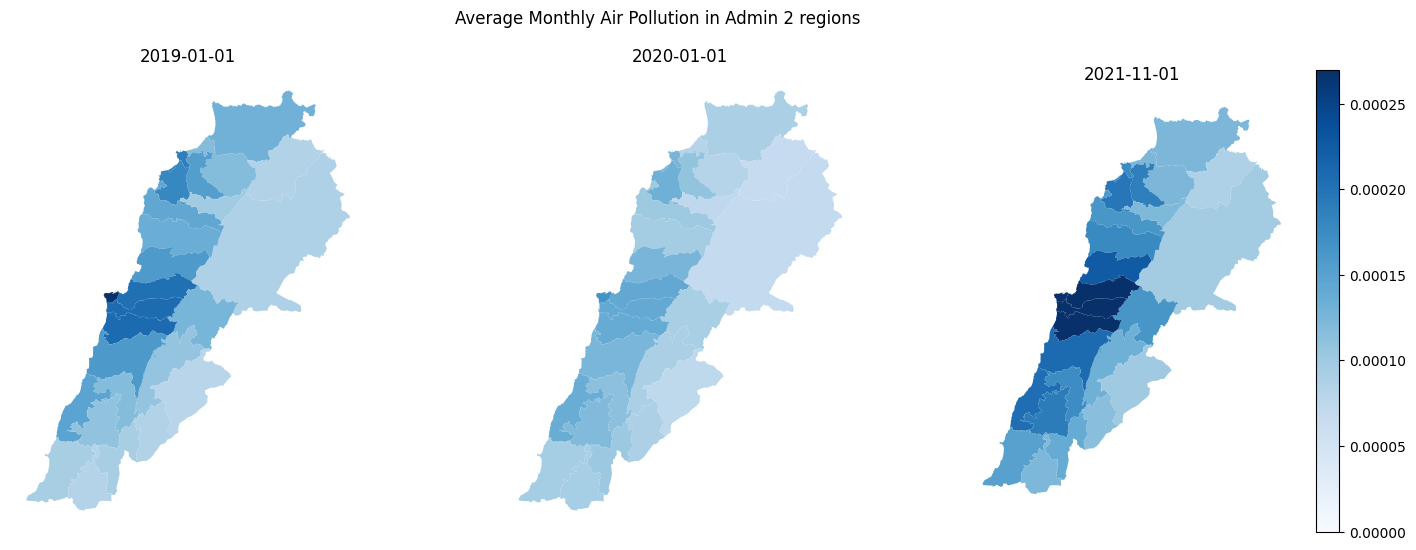
fig, ax = plt.subplots(1, 3, figsize=(18, 6))

for id, date in enumerate(["2019-01-01", "2020-01-01", "2021-11-01"]):
    if id == 2:
        legend_bool = True
    else:
        legend_bool = False
    monthly_no2_shp[monthly_no2_shp["date_y"] == date].plot(
        column="NO2_column_number_density",
        legend=legend_bool,
        vmin=0,
        vmax=0.00027,
        ax=ax[id],
        cmap="Blues",
    )
    ax[id].axis("off")
    ax[id].set_title(date)

plt.suptitle("Average Monthly Air Pollution in Admin 2 regions")
Text(0.5, 0.98, 'Average Monthly Air Pollution in Admin 2 regions')
Text(0.5, 0.98, 'Average Monthly Air Pollution in Admin 2 regions')
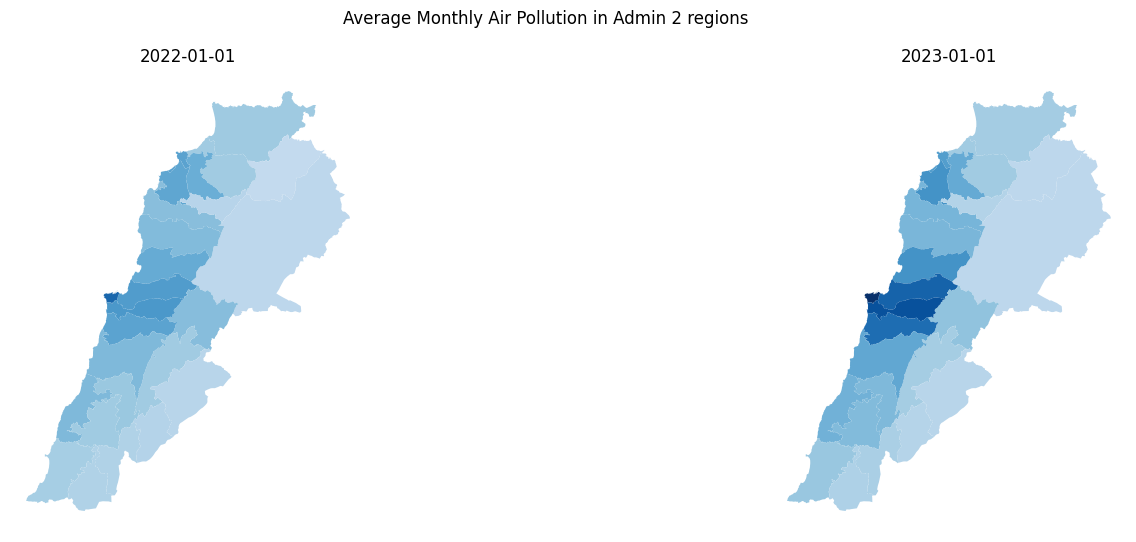
Observations#
2021 was worse than the two years before and after for NO2 levels in Lebanon.
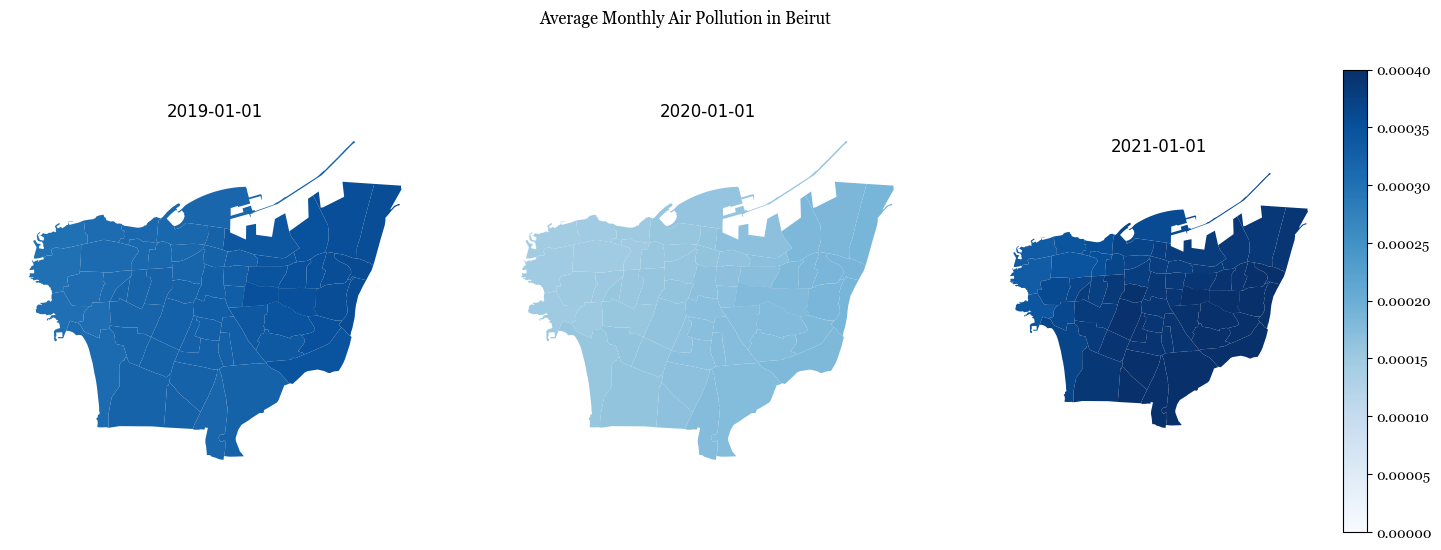
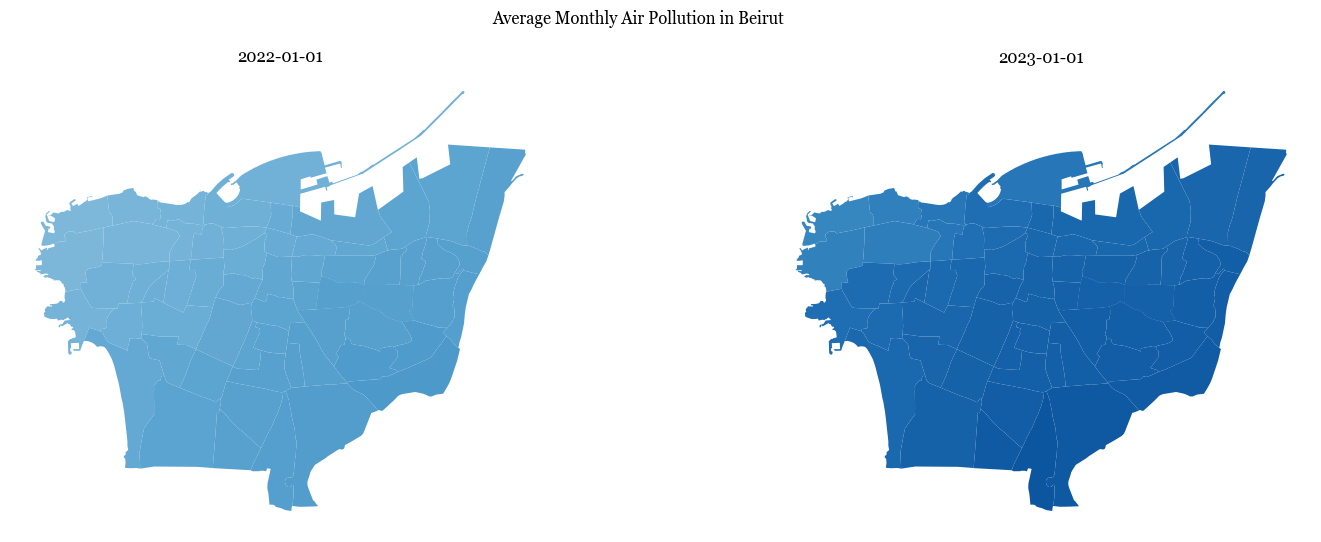
Beirut is the most polluted region
Show code cell source
fig, ax = plt.subplots(1, 3, figsize=(18, 6))
plt.rcParams["font.family"] = "georgia"

for id, date in enumerate(["2019-01-01", "2020-01-01", "2021-01-01"]):
    if id == 2:
        legend_bool = True
    else:
        legend_bool = False
    monthly_no2_adm4[monthly_no2_adm4["date"] == date].plot(
        column="NO2_column_number_density",
        legend=legend_bool,
        ax=ax[id],
        vmin=0,
        vmax=0.00040,
        cmap="Blues",
    )
    ax[id].axis("off")
    ax[id].set_title(date)

plt.suptitle("Average Monthly Air Pollution in Beirut");