Nighttime Lights Trends in Ethiopia#
This notebook provides an analysis on the temporal and spatial patterns of nighttime lights trends in Ethiopia from 2012 to 2024. The analysis includes visualizations of nighttime lights trends at national and regional levels.
Methodology#
We created a time series of weekly radiance using NASA’s Black Marble data which involves several steps, including data acquisition, pre-processing, zonal statistics calculation, and time series generation. The zonal statistics of the aggregated sum of nighttime lights is used to make inferences.
Insights#
National Trends of Nighttime Lights#
2024 Annual Nighttime Lights is not available yet. Monthly data is released and hence, the data for 2024 has been averaged over the months. The overall trend in nighttime lights saw a steady increase with additional increase in 2017 and minor dips in 2016 and 2019.
The Population and GDP of the country shows a similar increase as in NTL. However, the dips ain 2019 and 2019 and the rise in 2017 is not seen. The last available year for this data is also 2023.
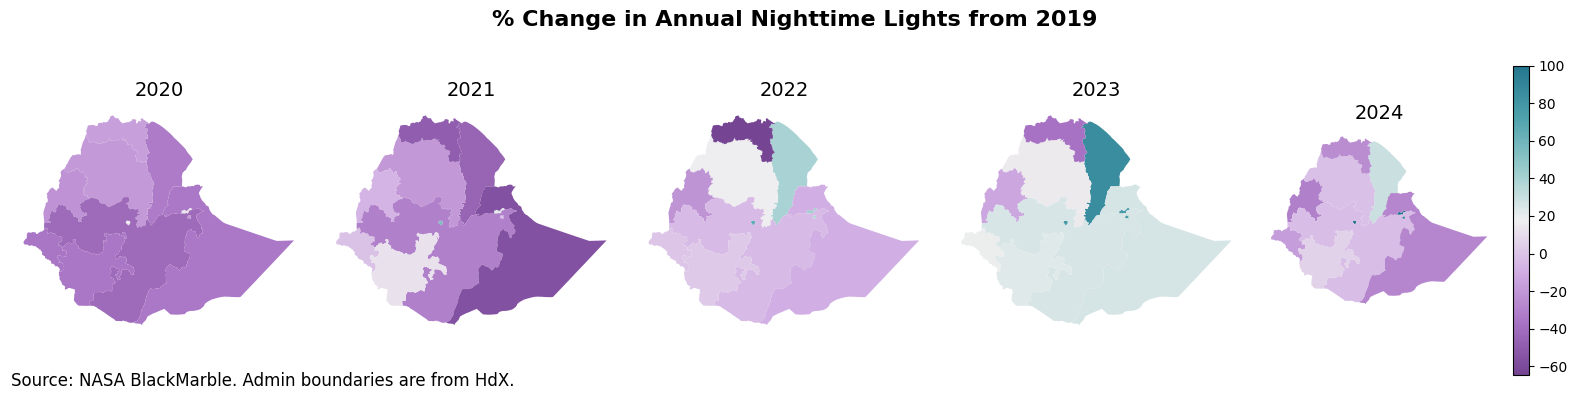
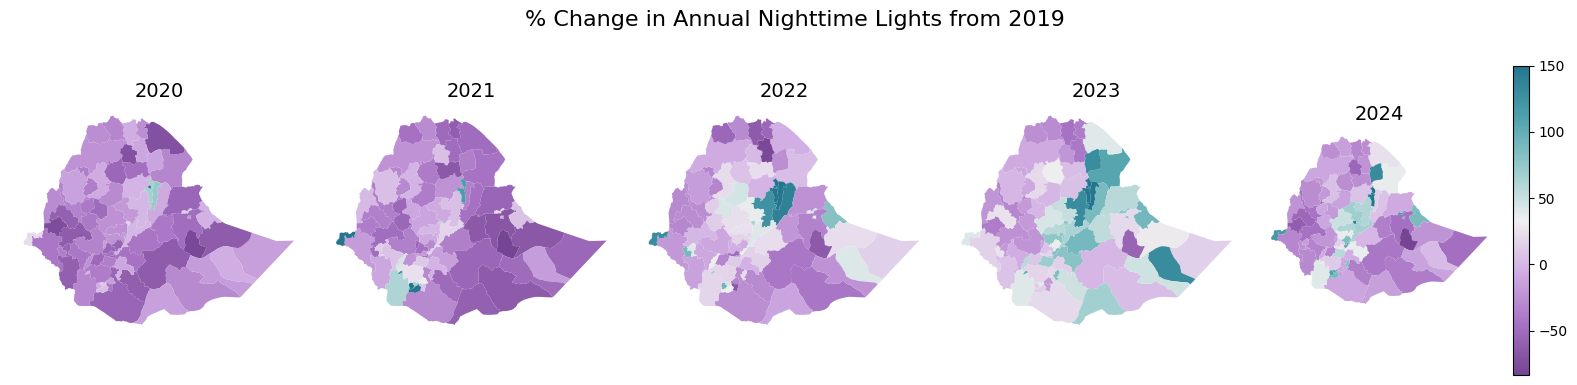
All percentage change values consider 2019 as a baseline year. 2024 saw a reduction in lights compared to 2023
Percentage change in subnational annual nighttime lights compared to 2019#
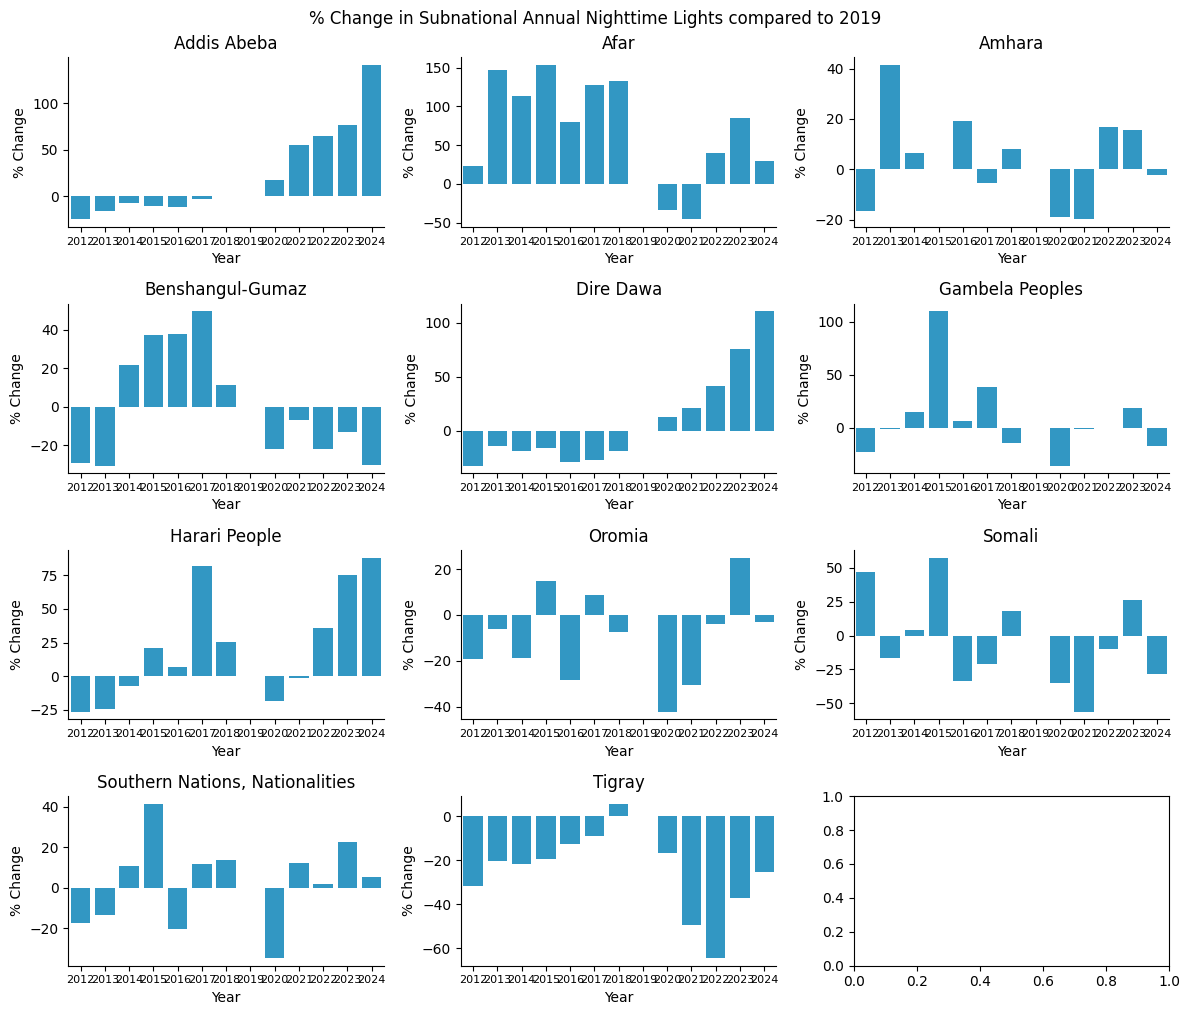
Not all admin regions saw an increase in NTL compared to 2019. Tigray region saw a reduction in lights since 2019. Afar and Benshangul-Gumaz saw little change in light from 2019.
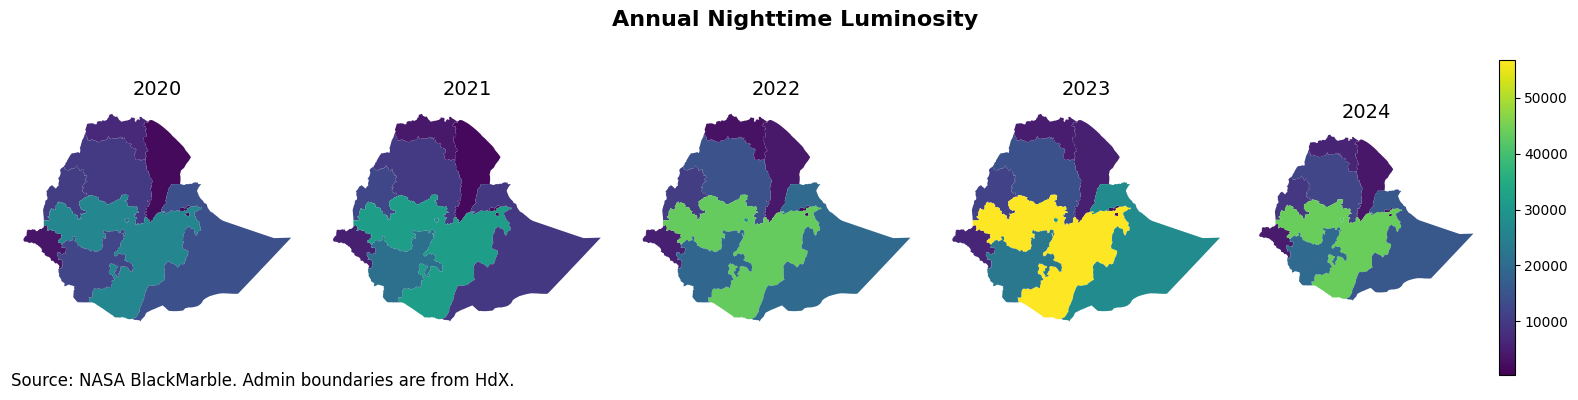
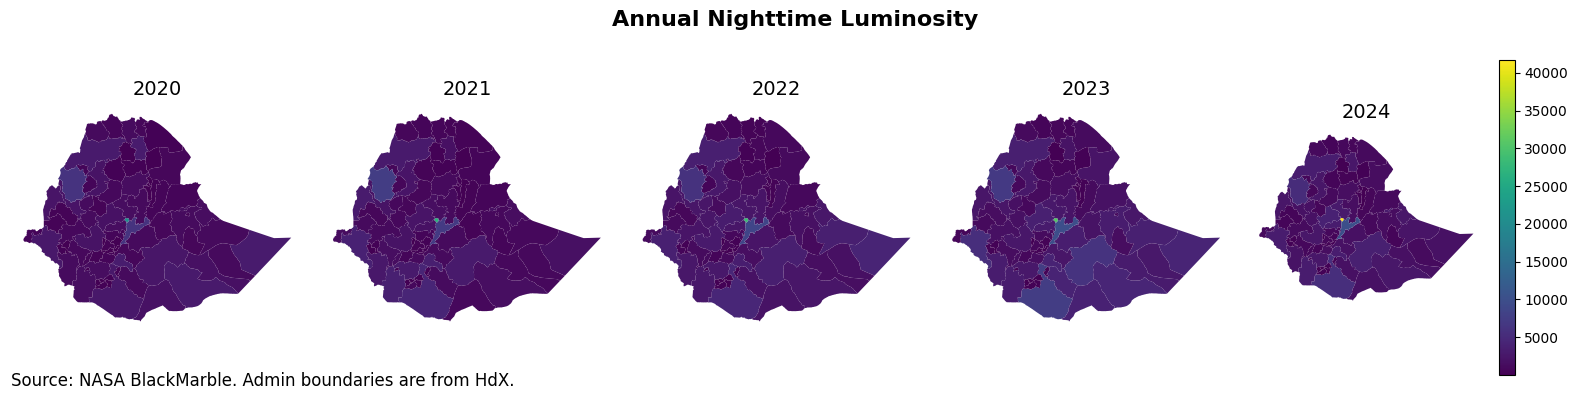
Trends in subnational annual nighttime lights#
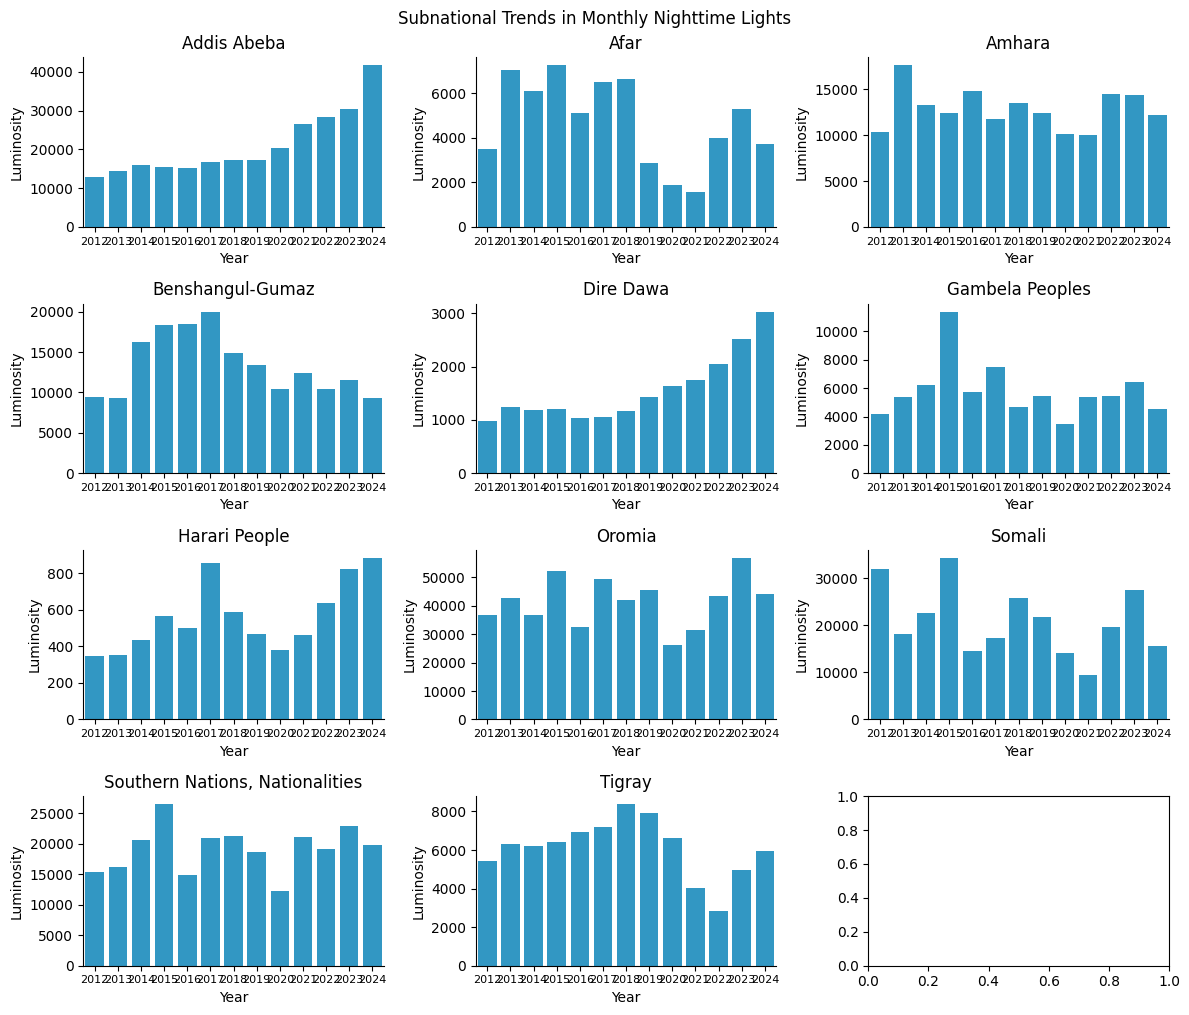
There was a considerable increase in light in Afar in 2017. Most other regions also saw an increase in light in that year. Somali and SNNR has shown a consistent rise in NTL. Tigray region saw a drop in NTL in 2022, potentially because of the war.
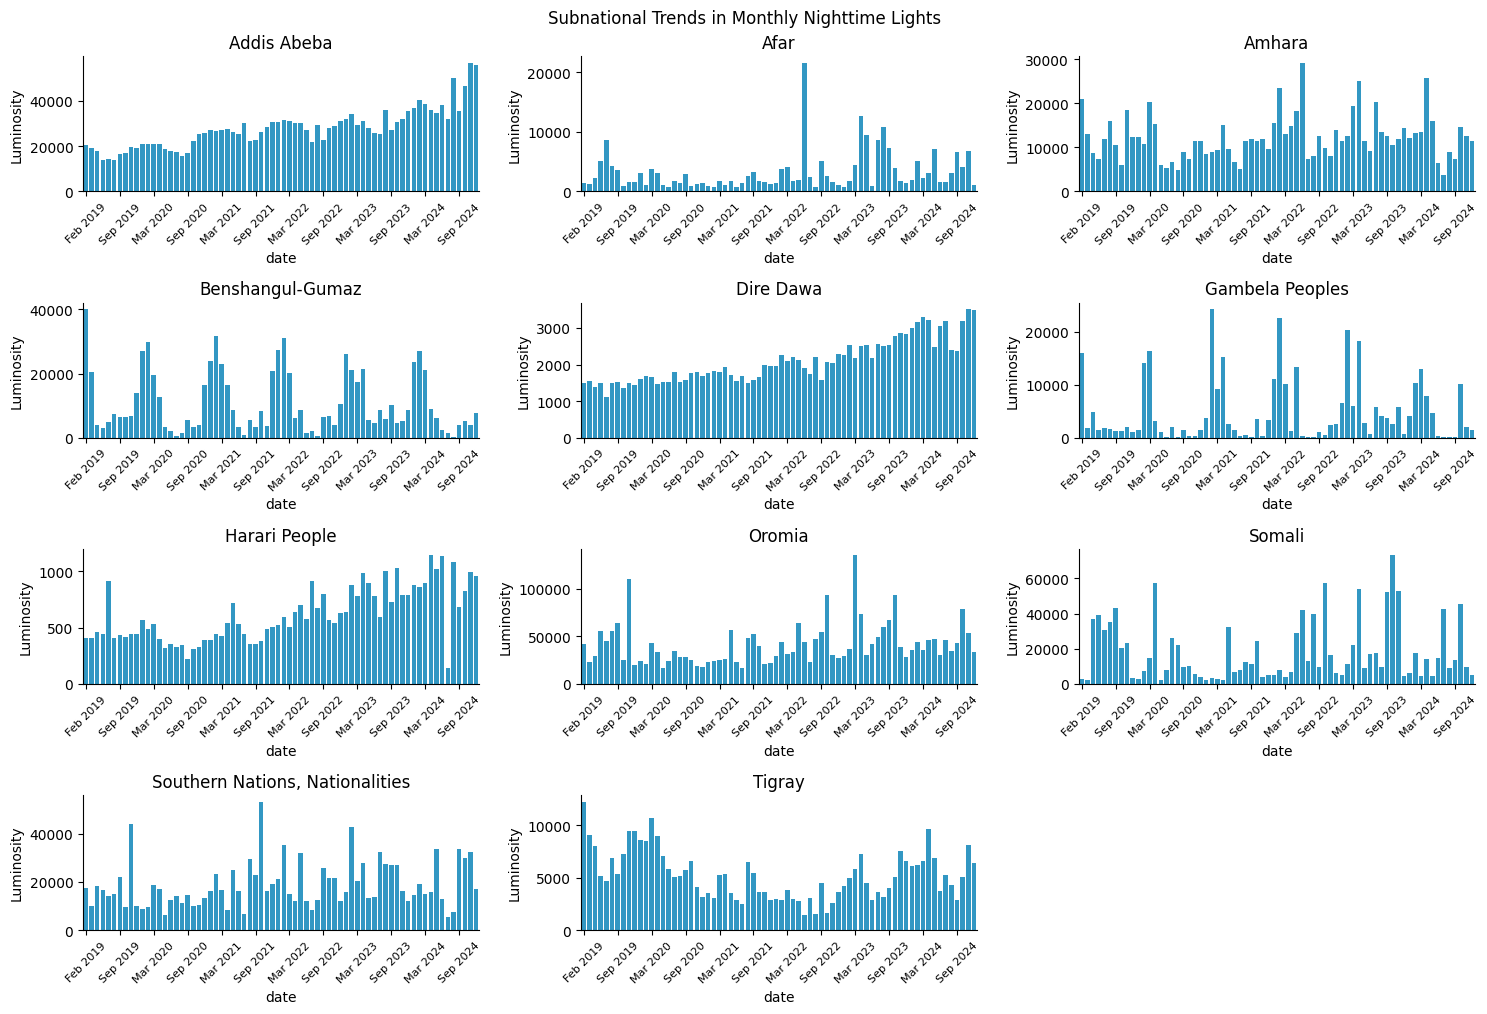
Monthly Trends in Nighttime Lights from 2019#
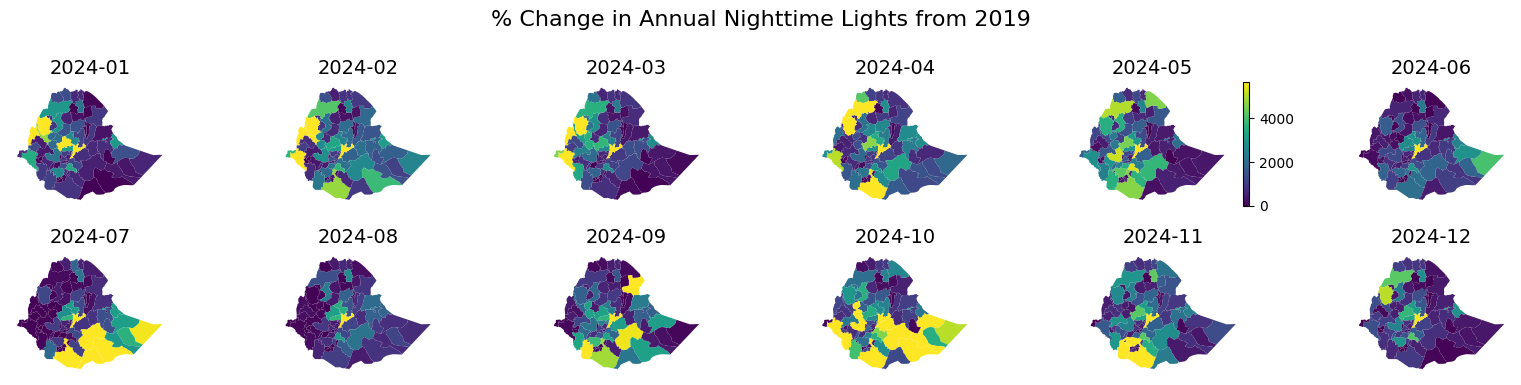
Geospatial Representation of Nighttime Lights#