Air Pollution in Addis Ababa#
This notebook analyses air pollution in Addis Ababa from 2019 till 2024. This is an ongoing methodology to understand economic activity using air pollution. This notebook does an exploratory analysis of the data and overlays the data with road networks to see the difference in pollution closer to major roads.
Methodology#
Extract Air Pollution data from Google Earth Engine
Plot it at a national level
Plot it at a woredas
Overlay road networks with air pollution
Estimate pollution closer to roads and farther away from it
Insights#
Monthly National Pollution#
Addis Ababa gets more polluted towards the end of the year in the winters. The summer months are the least polluted with NO2. This is an expected trend because pollution stays in the air for longer in the winters.This also results in higher particulate matter during the winters. However, the average value per year peaked in 2021 and fell after that. 2019 winter was also unexpectedly less polluted. The reasons for the peak in 2021 and dip in 2019 are yet unknown.
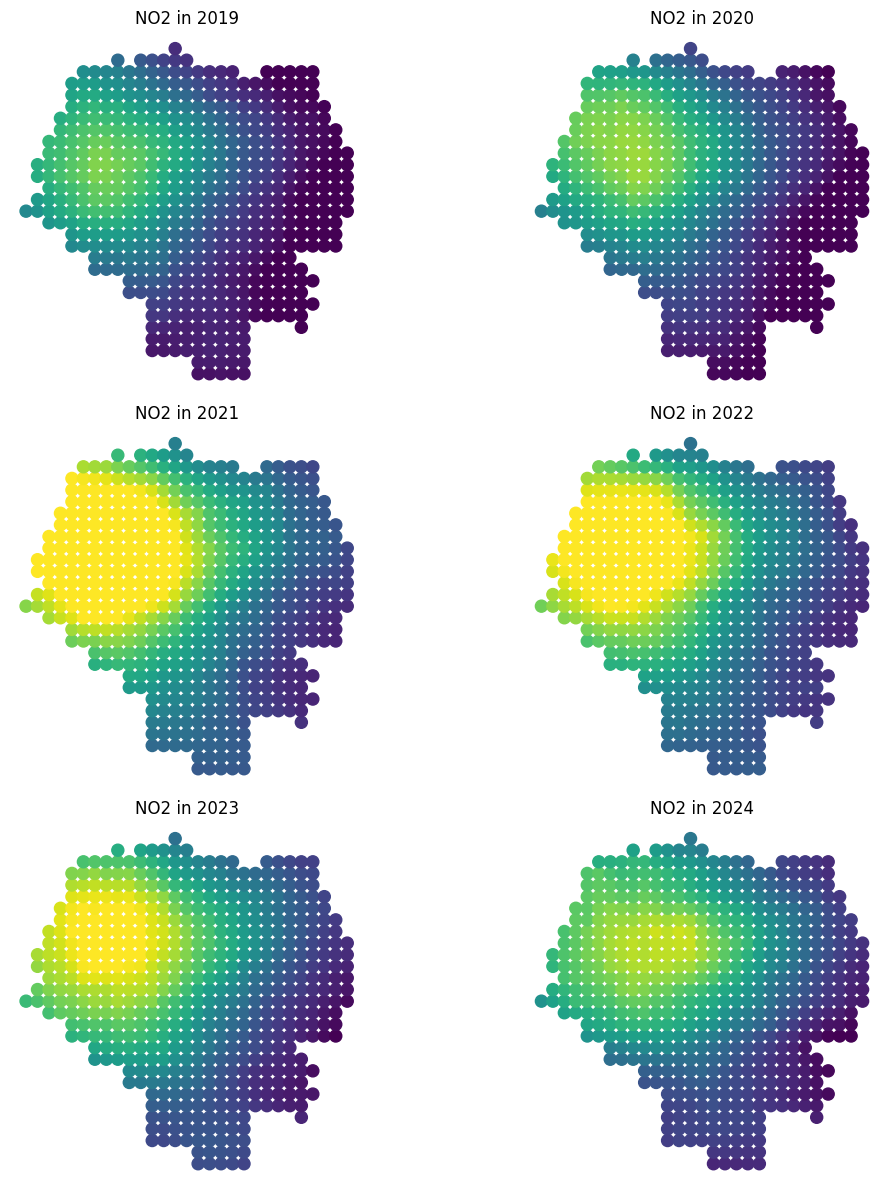
The northeastern parts of Addis are the most polluted compared to the rest across years. COVID years were unexepctedly more polluted than others.
Pollution by woredas in Addis#
Daily Shifts in Air Pollution#
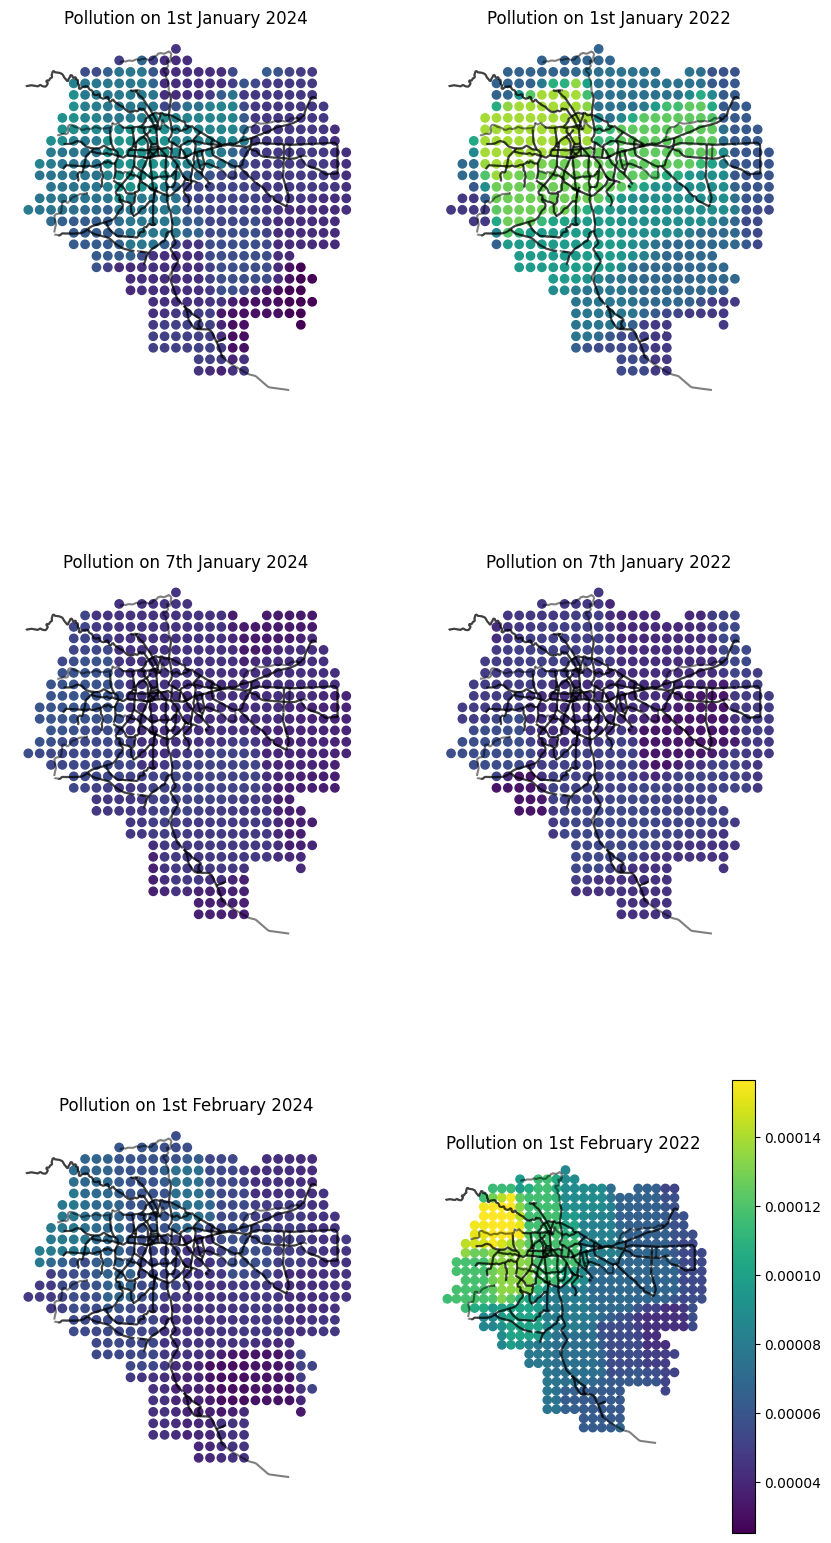
Christmas day seems less polluted tha New Years day both in 2024 and 2022. However, 2022 was more polluted than 2024.
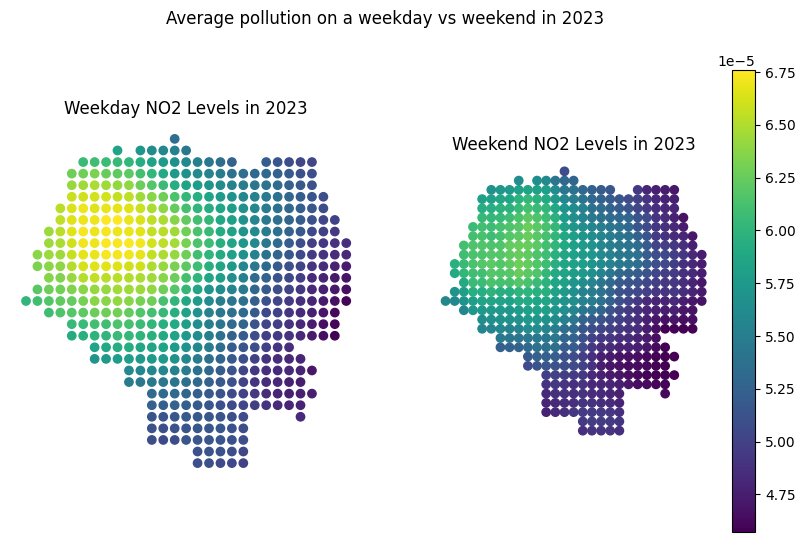
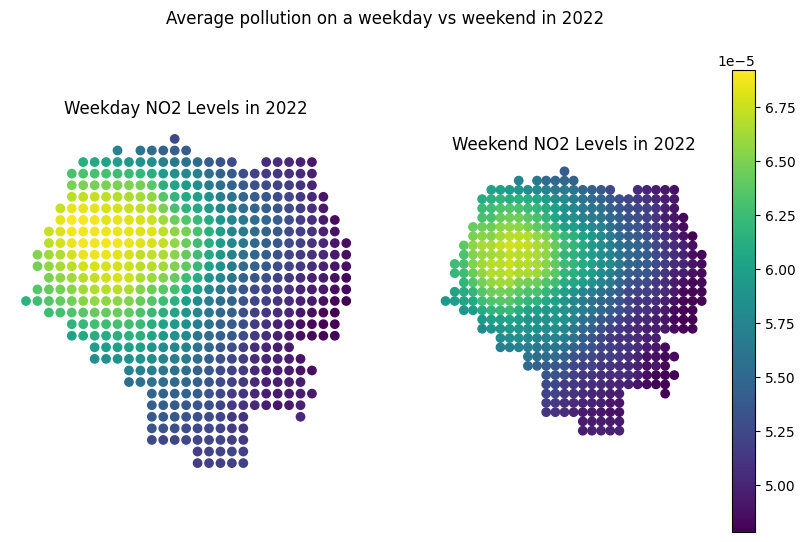
Weekdays vs Weekends#
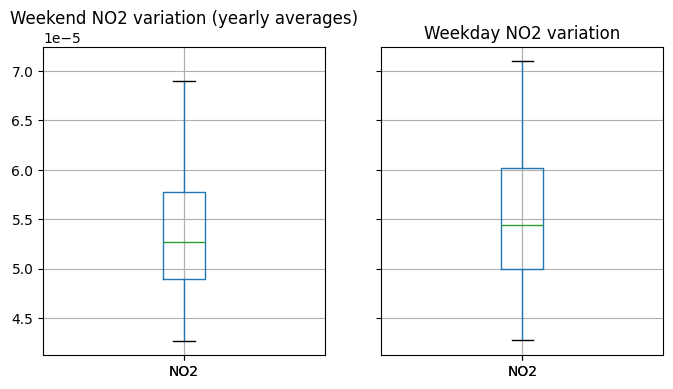
Comparing weekday and weekend average pollution shows that when you average all the weekdays in a year across 2019-2024, the air pollution is higher on weekdays than weekends