Basemaps for Ethiopia#
Overview#
This notebook aims to download, preprocess, and display various base layers, or basemaps, for Ethiopia. The following layers will be included:
Administrative boundaries
Population
Places and Points of Interest (POIs)
Buildings
Roads
These basemaps have two main functions. First, they provide essential contextual information, such as demographic and infrastructure details. Second, they serve as crucial inputs for further advanced analysis in the project.
Summary of Data Sources#
The section below provides a summary of key information about the data sources for the basemaps.
Ethiopia administrative boundaries. The administrative boundaries are available up to level 3 and the data was downloaded from UNOCHA or populary known as HDX
Population. THere two sources for population data: for populatoin density, we use Meta while for population counts we use WorldPop gridded population data.
Places and Points of Interest (POIs).
Buildings. The buildings footprints are downloaded from Overturemaps
Roads. The road network data is downloaded from UNOCHA
1. Administrative boundaries#
Administrative boundaries were downloaded from HDX. The dataset provides administrative boundaries up to level 3. According to the metadata on this page, the data originates from the Central Statistics Agency (CSA) and the Regional Bureau of Finance and Economic Development (BoFED).
==============================
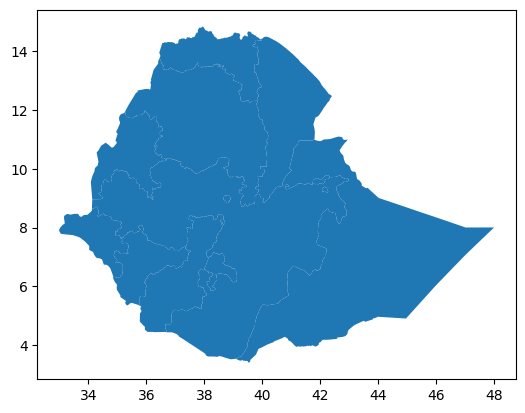
Ethiopia Admin-1-Regions
==============================
There are 13 regions in the HDX dataset
----------------------------------------
<Axes: >
==============================
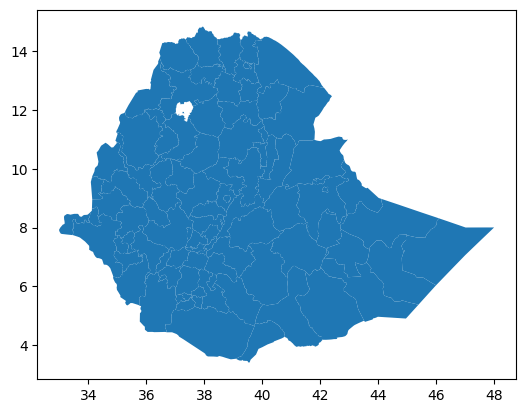
Ethiopia Admin-2-Zones
==============================
There are 92 zones in the HDX dataset
----------------------------------------
<Axes: >
========================================
  Ethiopia Admin-3-Districts/Woredas
========================================

 There are 1082 districts in the HDX dataset
---------------------------------------------
<Axes: >

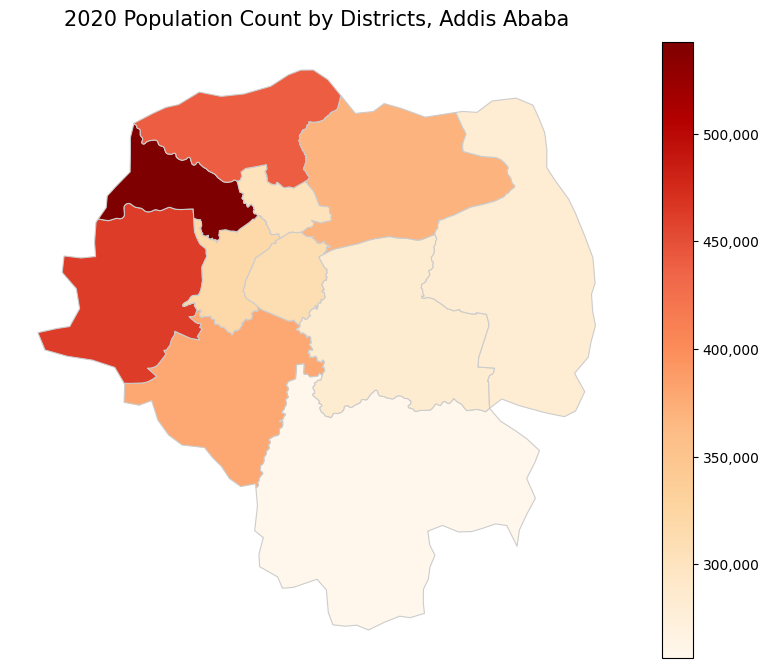
2. Population#
Two sources are used for population, one providing population density and the other population counts as follows.
World Pop gridded population counts#
Data source.(https://hub.worldpop.org/geodata/summary?id=26183).
This data provides estimated number of people per grid cell with resolution 100m. This is 2020 population.
Meta population density estimates#
Data source.. The data was downloaded from HDX website.
In partnership with the Center for International Earth Science Information Network (CIESIN) at Columbia University, Meta uses state-of-the-art computer vision techniques to identify buildings from publicly accessible mapping services to create these population datasets. These maps are available at 30-meter resolution. These maps aren’t built using Facebook data and instead rely on applying machine vision AI to satellite imagery and census information. This data is publicly accessible on their AWS Server and detailed documentation can be found here.
The Population Data is demographically disaggregated into the following categories
Men
Women
Children under 5
Elderly
Women of Reproductive Age (15-49)
Youth (15-24)
Senior
This data is available at administrative level 3.
3. Points of Interest (POIs)#
These are also called places. We are considering two sources for this data.
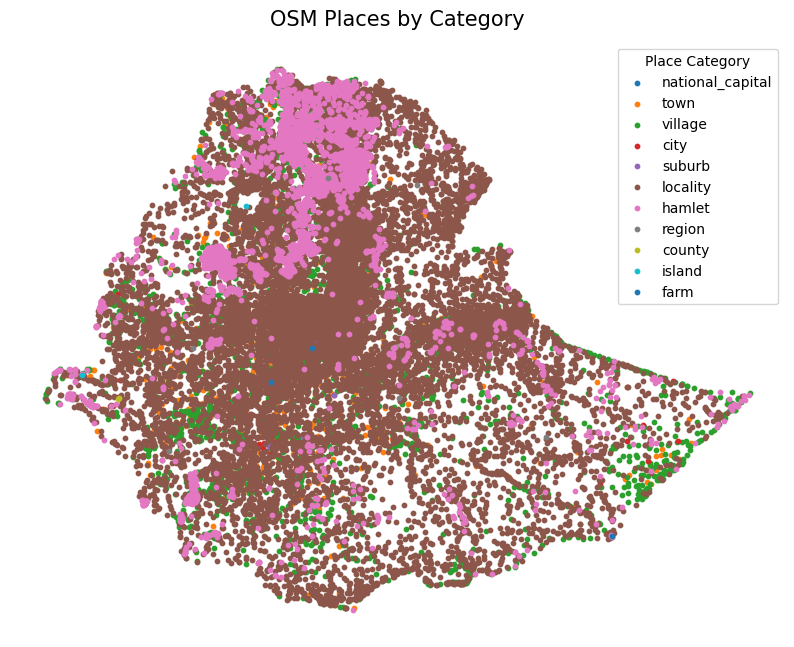
OSM places. OSM places refer to geographical entities such as cities, towns, villages, neighborhoods, or other types of settlements. They represent populated or named areas on the map.The two main attributes available in this dataset are category, for example town, city, village and place name.
OSM POIs.Refer to specific, identifiable locations that offer a service, facility, or a specific function. They represent individual objects or amenities that people might visit or interact with.
3.1 Summary of OSM places and POIs data#
Number of places for Ethiopia in OSM dataset: 24,420
Number of POIs for Ethiopia in OSM dataset: 13,205
3.1.1 OSM Places#
==================================================
              OSM Places Categories
==================================================
| Category | Count | Percent | Cum. Percent |
|---|---|---|---|
| locality | 14,442 | 59.14% | 59.14% |
| hamlet | 5,413 | 22.17% | 81.31% |
| village | 3,590 | 14.70% | 96.01% |
| town | 781 | 3.20% | 99.21% |
| suburb | 131 | 0.54% | 99.74% |
| city | 49 | 0.20% | 99.94% |
| region | 6 | 0.02% | 99.97% |
| farm | 3 | 0.01% | 99.98% |
| county | 2 | 0.01% | 99.99% |
| island | 2 | 0.01% | 100.00% |
| national_capital | 1 | 0.00% | 100.00% |
--------------------------------------------------
3.1.2 OSM POIs#
==================================================
        Top-20 Categories in OSM POIs Data
==================================================
| Category | Count | Percent | Cum. Percent |
|---|---|---|---|
| bank | 1,551 | 11.75% | 11.75% |
| hotel | 1,244 | 9.42% | 21.17% |
| restaurant | 1,010 | 7.65% | 28.81% |
| school | 753 | 5.70% | 34.52% |
| cafe | 710 | 5.38% | 39.89% |
| viewpoint | 597 | 4.52% | 44.41% |
| toilet | 486 | 3.68% | 48.10% |
| attraction | 405 | 3.07% | 51.16% |
| comms_tower | 397 | 3.01% | 54.17% |
| clinic | 317 | 2.40% | 56.57% |
| guesthouse | 317 | 2.40% | 58.97% |
| pharmacy | 290 | 2.20% | 61.17% |
| bar | 288 | 2.18% | 63.35% |
| supermarket | 250 | 1.89% | 65.24% |
| community_centre | 248 | 1.88% | 67.12% |
| bakery | 240 | 1.82% | 68.94% |
| atm | 212 | 1.61% | 70.54% |
| tower | 162 | 1.23% | 71.77% |
| water_well | 145 | 1.10% | 72.87% |
| bench | 138 | 1.05% | 73.91% |
--------------------------------------------------