Premise crowdsourced surveys#
Premise crowdsourced surveys are a way of validating, verifying the ground truth and understanding the needs of people on ground, especially in regions impacted by a crisis
community_needs = pd.read_csv("../../data/premise/Community_Needs.csv")
displacement = pd.read_csv("../../data/premise/Displacement.csv")
recent_earthquake = pd.read_csv("../../data/premise/Recent_Earthquake_in_Turkey.csv")
fuel_prices = pd.read_csv("../../data/premise/Premise  Turkey Fuel Prices Update.csv")
household_needs = pd.read_csv("../../data/premise/Premise  Household Needs TR.csv")
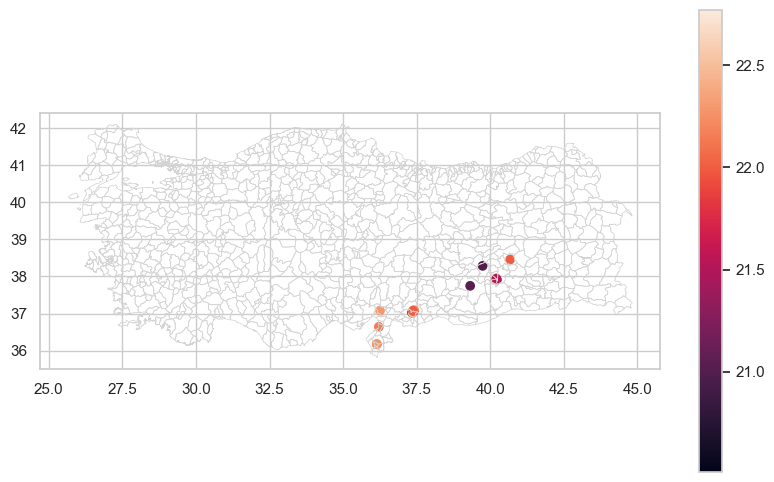
Price of a litre of petrol#
The survey provides data and evidence in the form of photos to capture the price of one litre of petrol and diesel in the areas where the earthquake impact is the highest
fig, ax = plt.subplots(figsize=(10, 6), sharex=True)

turkey_adm2.boundary.plot(ax=ax, edgecolor="#D3D3D3", linewidth=0.5)
gdf.plot(column=" what_is_the_price_of_a_liter_of_diesel", ax=ax, legend=True)
# gdf.sjoin(turkey_adm2).plot(column=' what_is_the_price_of_a_liter_of_petrol', ax=ax, legend = True)
<Axes: >
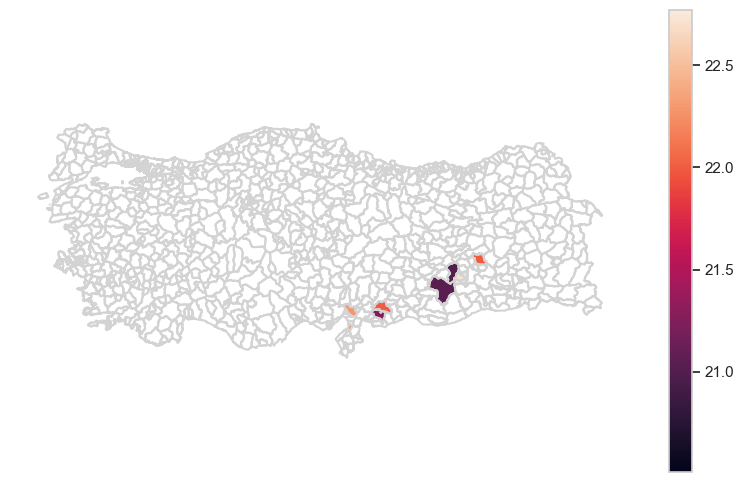
Price of a litre of diesel#
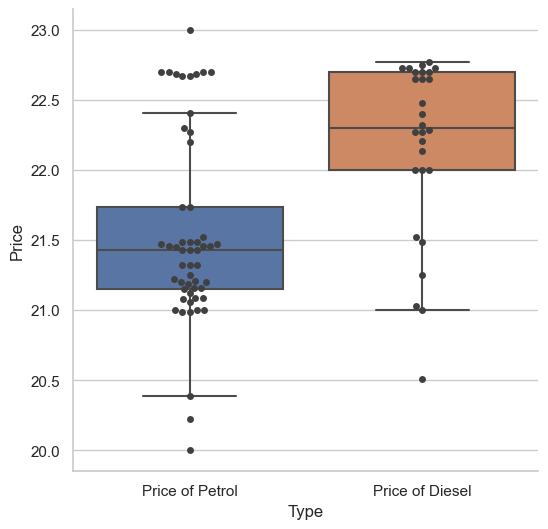
Comparing the price of petrol and diesel#
Household Needs Survey from Premise#
## Picking the relevant columns
household_columns = [
    " is_the_primary_health_care_facility_closest_to_you_currently_functional",
    " is_the_closest_hospital_to_you_currently_functional",
    "observation_lat",
    "observation_lon",
    " is_the_university_reference_hospital_near_you_functional",
    " do_you_have_access_to_functioning_food_markets",
    " in_the_past_six_months_has_the_amount_of_food_in_your_household_decreased_due_to_a_shortage",
]
Exploring the results in the admin region of Sahinbey#
Analysing Community needs, Displacement and Recent earthquake needs surveys#
columns_of_interest_community = [
    "in_your_neighborhood_is_lack_of_income_money_or_resources_to_survive_a_severe_problem",
    "in_your_neighborhood_is_lack_of_access_to_safe_drinking_or_cooking_water_a_severe_problem",
    "in_your_neighborhood_is_lack_of_access_to_functional_hygienic_bathrooms_a_severe_problem",
    "in_your_neighborhood_is_lack_of_access_to_personal_hygiene_products_and_services_a_severe_problem",
    "in_your_neighborhood_is_there_a_severe_problem_related_to_nutrition",
    "what_are_the_principal_concerns_related_to_nutrition_in_your_neighborhood",
    "have_there_been_significant_changes_in_the_total_quantity_of_food_available_to_people_in_your_neighborhood",
    "in_your_neighborhood_is_lack_of_access_to_medical_attention_a_severe_problem",
    "which_of_the_following_health_services_are_easily_accessible_in_your_local_area",
    "what_are_the_primary_issues_faced_by_children_in_your_neighborhood_in_relation_to_access_to_education",
]

columns_displacement = [
    "are_you_originally_from_the_area_you_are_located_in_now",
    "how_likely_are_you_to_return_to_your_place_of_origin_in_the_next_1_month",
    "do_you_live_in_a_refugee_or_idp_camp?",
    "how_long_have_you_been_displaced_for?",
    "to_your_knowledge,_does_your_community_have_a_positive_view_of_the_idps_and_refugees_residing_in_your_area?",
    "in_the_past_week_has_there_been_an_increase_or_decease_in_the_number_of_refugee_or_idps_present_in_your_local_area",
]

columns_recent_earthquake = [
    "did_you_observe_any_damage_to_your_home_during_the_recent_earthquake",
    "did_you_notice_any_damage_to_key_infrastructure_or_buildings_in_your_community_because_of_the_recent_earthquake",
    "was_your_local_school_house_damaged_or_destroyed_in_the_earthquake",
    "did_you_observe_any_damage_to_roads_as_a_result_of_the_earthquake",
    "are_there_currently_supplies_or_utilities_you_need_that_you_cannot_currently_access_as_a_result_of_the_earthquake",
    "what_supplies_or_utilities_do_you_need_that_you_cannot_currently_access_as_a_result_of_the_earthquake",
]
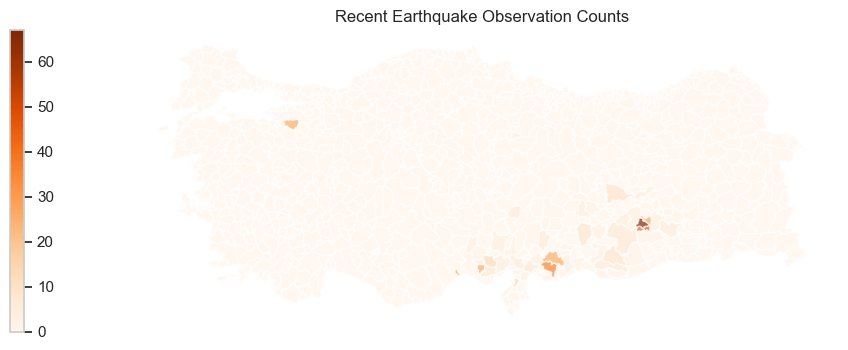
Visualizing number of observations from each admin region in the community needs dataset#
Text(0.5, 1.0, 'Recent Earthquake Observation Counts')
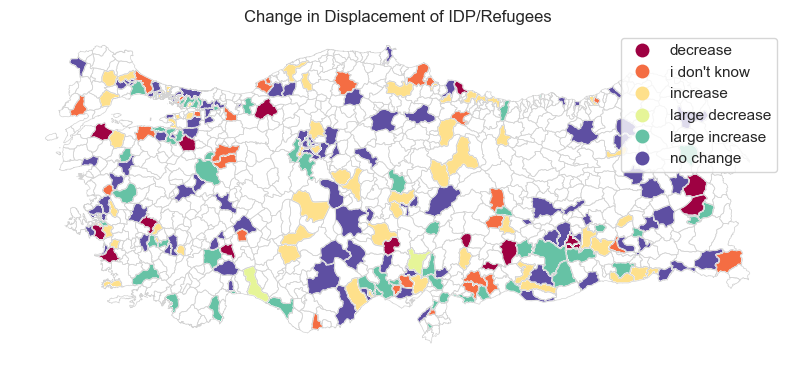
displacement["idp_color"] = displacement["idp_color"].str.replace("_", " ")
Change in Displcement of IDPs/refugees#
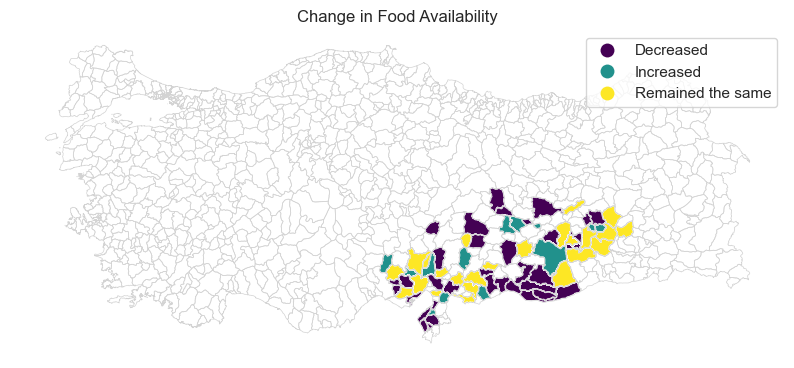
Food availability#
Text(0.5, 1.0, 'Change in Food Availability')
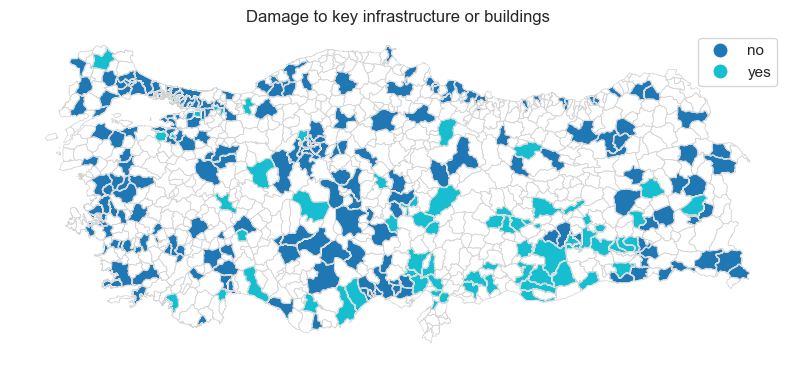
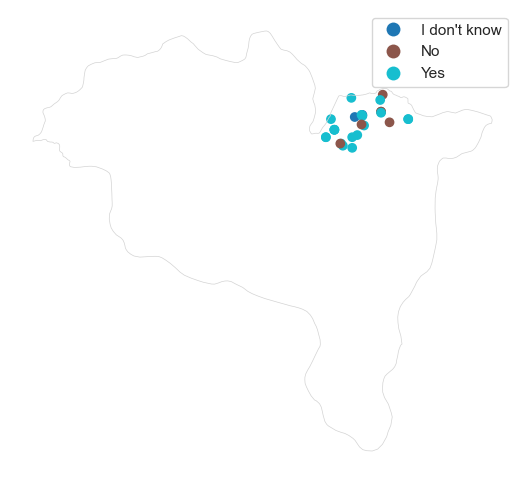
Damage to key infrstructure of buildings#
Interestingly, it was reported that there were damaged buildings even outside the earthquake impacted regions
fig, ax = plt.subplots(figsize=(10, 6))

turkey_adm2.boundary.plot(ax=ax, edgecolor="#D3D3D3", linewidth=0.5)
convert_to_gdf(recent_earthquake).plot(
    column="did_you_notice_any_damage_to_key_infrastructure_or_buildings_in_your_community_because_of_the_recent_earthquake",
    ax=ax,
    legend=True,
)

ax.set_xticks([])
ax.set_yticks([])
ax.spines["top"].set_visible(False)
ax.spines["bottom"].set_visible(False)
ax.spines["right"].set_visible(False)
ax.spines["left"].set_visible(False)

ax.set_title("Damage to key infrastructure or buildings")
Text(0.5, 1.0, 'Damage to key infrastructure or buildings')