Nighttime Lights#
Nighttime lights have become a commonly used resource to estimate changes in local economic activity. This section shows changes in nighttime lights in Turkiye from before and after the earthquake.
Data#
We use nighttime lights data from the VIIRS Black Marble dataset. Raw nighttime lights data requires correction due to cloud cover and stray light, such as lunar light. The Black Marble dataset applies advanced algorithms to correct raw nighttime light values and calibrate data so that trends in lights over time can be meaningfully analyzed. We use daily and monthly data from VIIRS Black Marble.
Methodology#
We extract average nighttime lights within each administrative unit in Turkiye. We distinguish lights between lights observed in gas flaring locations and lights in other locations. Oil extraction and production involves gas flaring, which produces significant volumes of light. Separately examining lights in gas flaring and other locations allows distinguishing between lights generated due to oil production versus other sources of human activity. We use data on the locations of gas flaring sites from the Global Gas Flaring Reduction Partnership; we remove lights within 5km of gas flaring sites.
Implementation#
Code to replicate the analysis can be found here.
The code largely relies on an R package (blackmarbler) that is currently being created to faciliate downloading and processing Black Marble nighttime lights data. The package documentation provides some generic examples for how to download data, make a map of nighttime lights, and show trends in nighttime lights. The below code leverages the package to produce analytics for Turkiye.
The main script (_main.R) loads all packages and runs all scripts for the analysis. Below we document scripts for (1) creating analysis-ready datasets and (2) producing analytics (eg, figures) of nighttime lights data.
Create Analysis-Ready Nighttime Lights Datasets#
The below code downloads and processes nighttime lights data.
01_clean_gas_flaring_data.R: Produces a clean dataset of the locations of gas flaring locations. This dataset is needed because we summarize nighttime lights for (1) all lights, (2) lights excluding gas flaring loations, and (3) lights only in gas flaring locations.
02_download_black_marble.R: Downloads Black Marble nighttime lights data for annual, monthly, and daily nighttime lights data. The script exports a geotiff file of nighttime lights for each time period (eg, for each year for annual data). If the script is run at a later date, only data that has not already been downloaded will be downloaded.
03_aggregate.R: Aggregates nighttime lights to administrative levels 0, 1 and 2. Calculates average nighttime lights within each administrative unit. The script produces a separate file for each time period. For example, for daily data, a single dataset is saved for aggregated nighttime lights for January 1, 2023, at the ADM2 level. The next script appends files across time periods (eg, days) into a single dataset. Separate files are saved in order to facilitate aggregating new data, as aggregating data can take some time. The script skips aggregating data that has already been processed.
04_append.R: Appends aggregated data for each time period. Creates a separate datasets for annual, monthly, and daily nighttime lights data.
Nighttime Lights Analytics#
The below code analyzes the nighttime lights data, producing figures and tables.
05_map_ntl_annual.R: Produce annual maps of nighttime lights
05_maps_ntl_changes.R: Produce maps of changes in nighttime lights from before and after the earthquake.
05_ntl_trends_daily.R: Produce daily trends in daily nighttime lights for each administrative unit. Administrative units are group by earthquake intensity.
05_ntl_trends_monthly.R: Produce daily trends in daily nighttime lights for each administrative unit. Administrative units are group by earthquake intensity.
05_avg_ntl_by_period.R: Create a dataset of average nighttime lights for each administrative unit for different time periods.
Data#
The data for the analysis can be accessed from:
Black Marble Nighttime Lights: There are two options to access the data:
The code here downloads raw data from the NASA archive and processes the data for Turkiye—mosaicing raster tiles together to cover Turkiye. Running the code requires a NASA bearer token; the documentation here describes how to obtain a token.
Pre-processed data can be downloaded from here, using the Night Time Lights BlackMarble Data
Findings#
Map of Nighttime Lights#
The below figure shows nighttime lights from the latest year available. As expected, Turkiye’s largest cities are the most brightly lit – such as Instanbul in the north west.
This script produces the below figure, where the relevant code is also documented below. Before running the below code, the code from here needs to be run to load packages and define file paths.
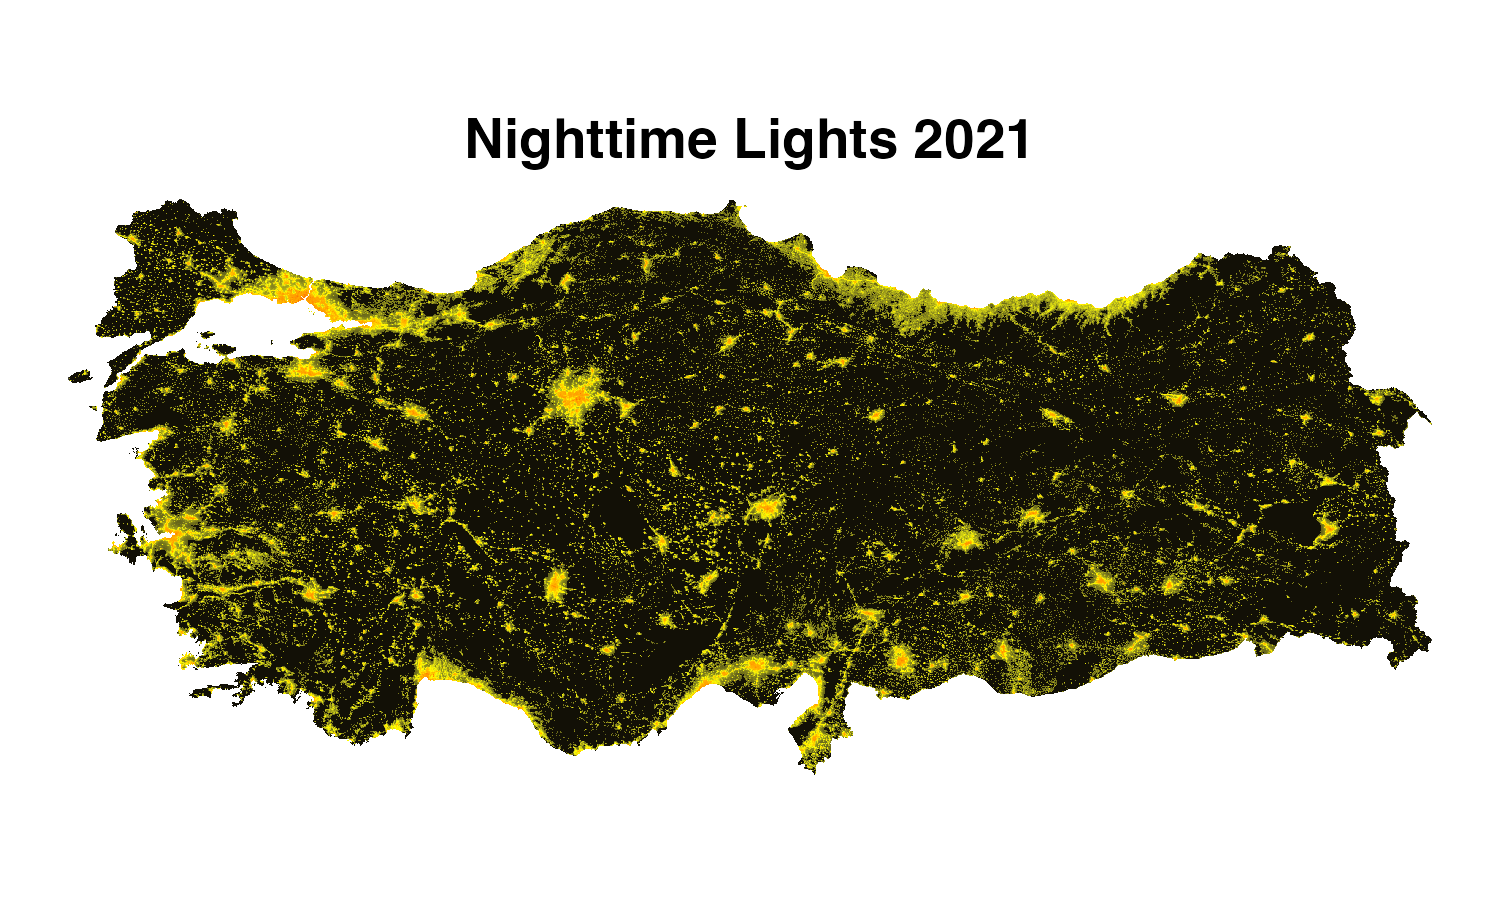
Fig. 5 Nighttime lights in 2021#
Changes in Nighttime Lights#
The below figures show the change in nighttime lights from the two weeks before the earthquake (February 6, 2023) to two weeks after the earthquake. The figures show that many locations saw an increase in nighttime lights immediately after the earthquake. Increases in nighttime lights could result from lights generated from rescue efforts.
This script produces the below two figures, where the relevant code is also documented below. The code relies on daily nighttime lights data that has been aggregated to the ADM2 level. Before running the below code, the code from here needs to be run to load packages and define file paths.
Percent Change#
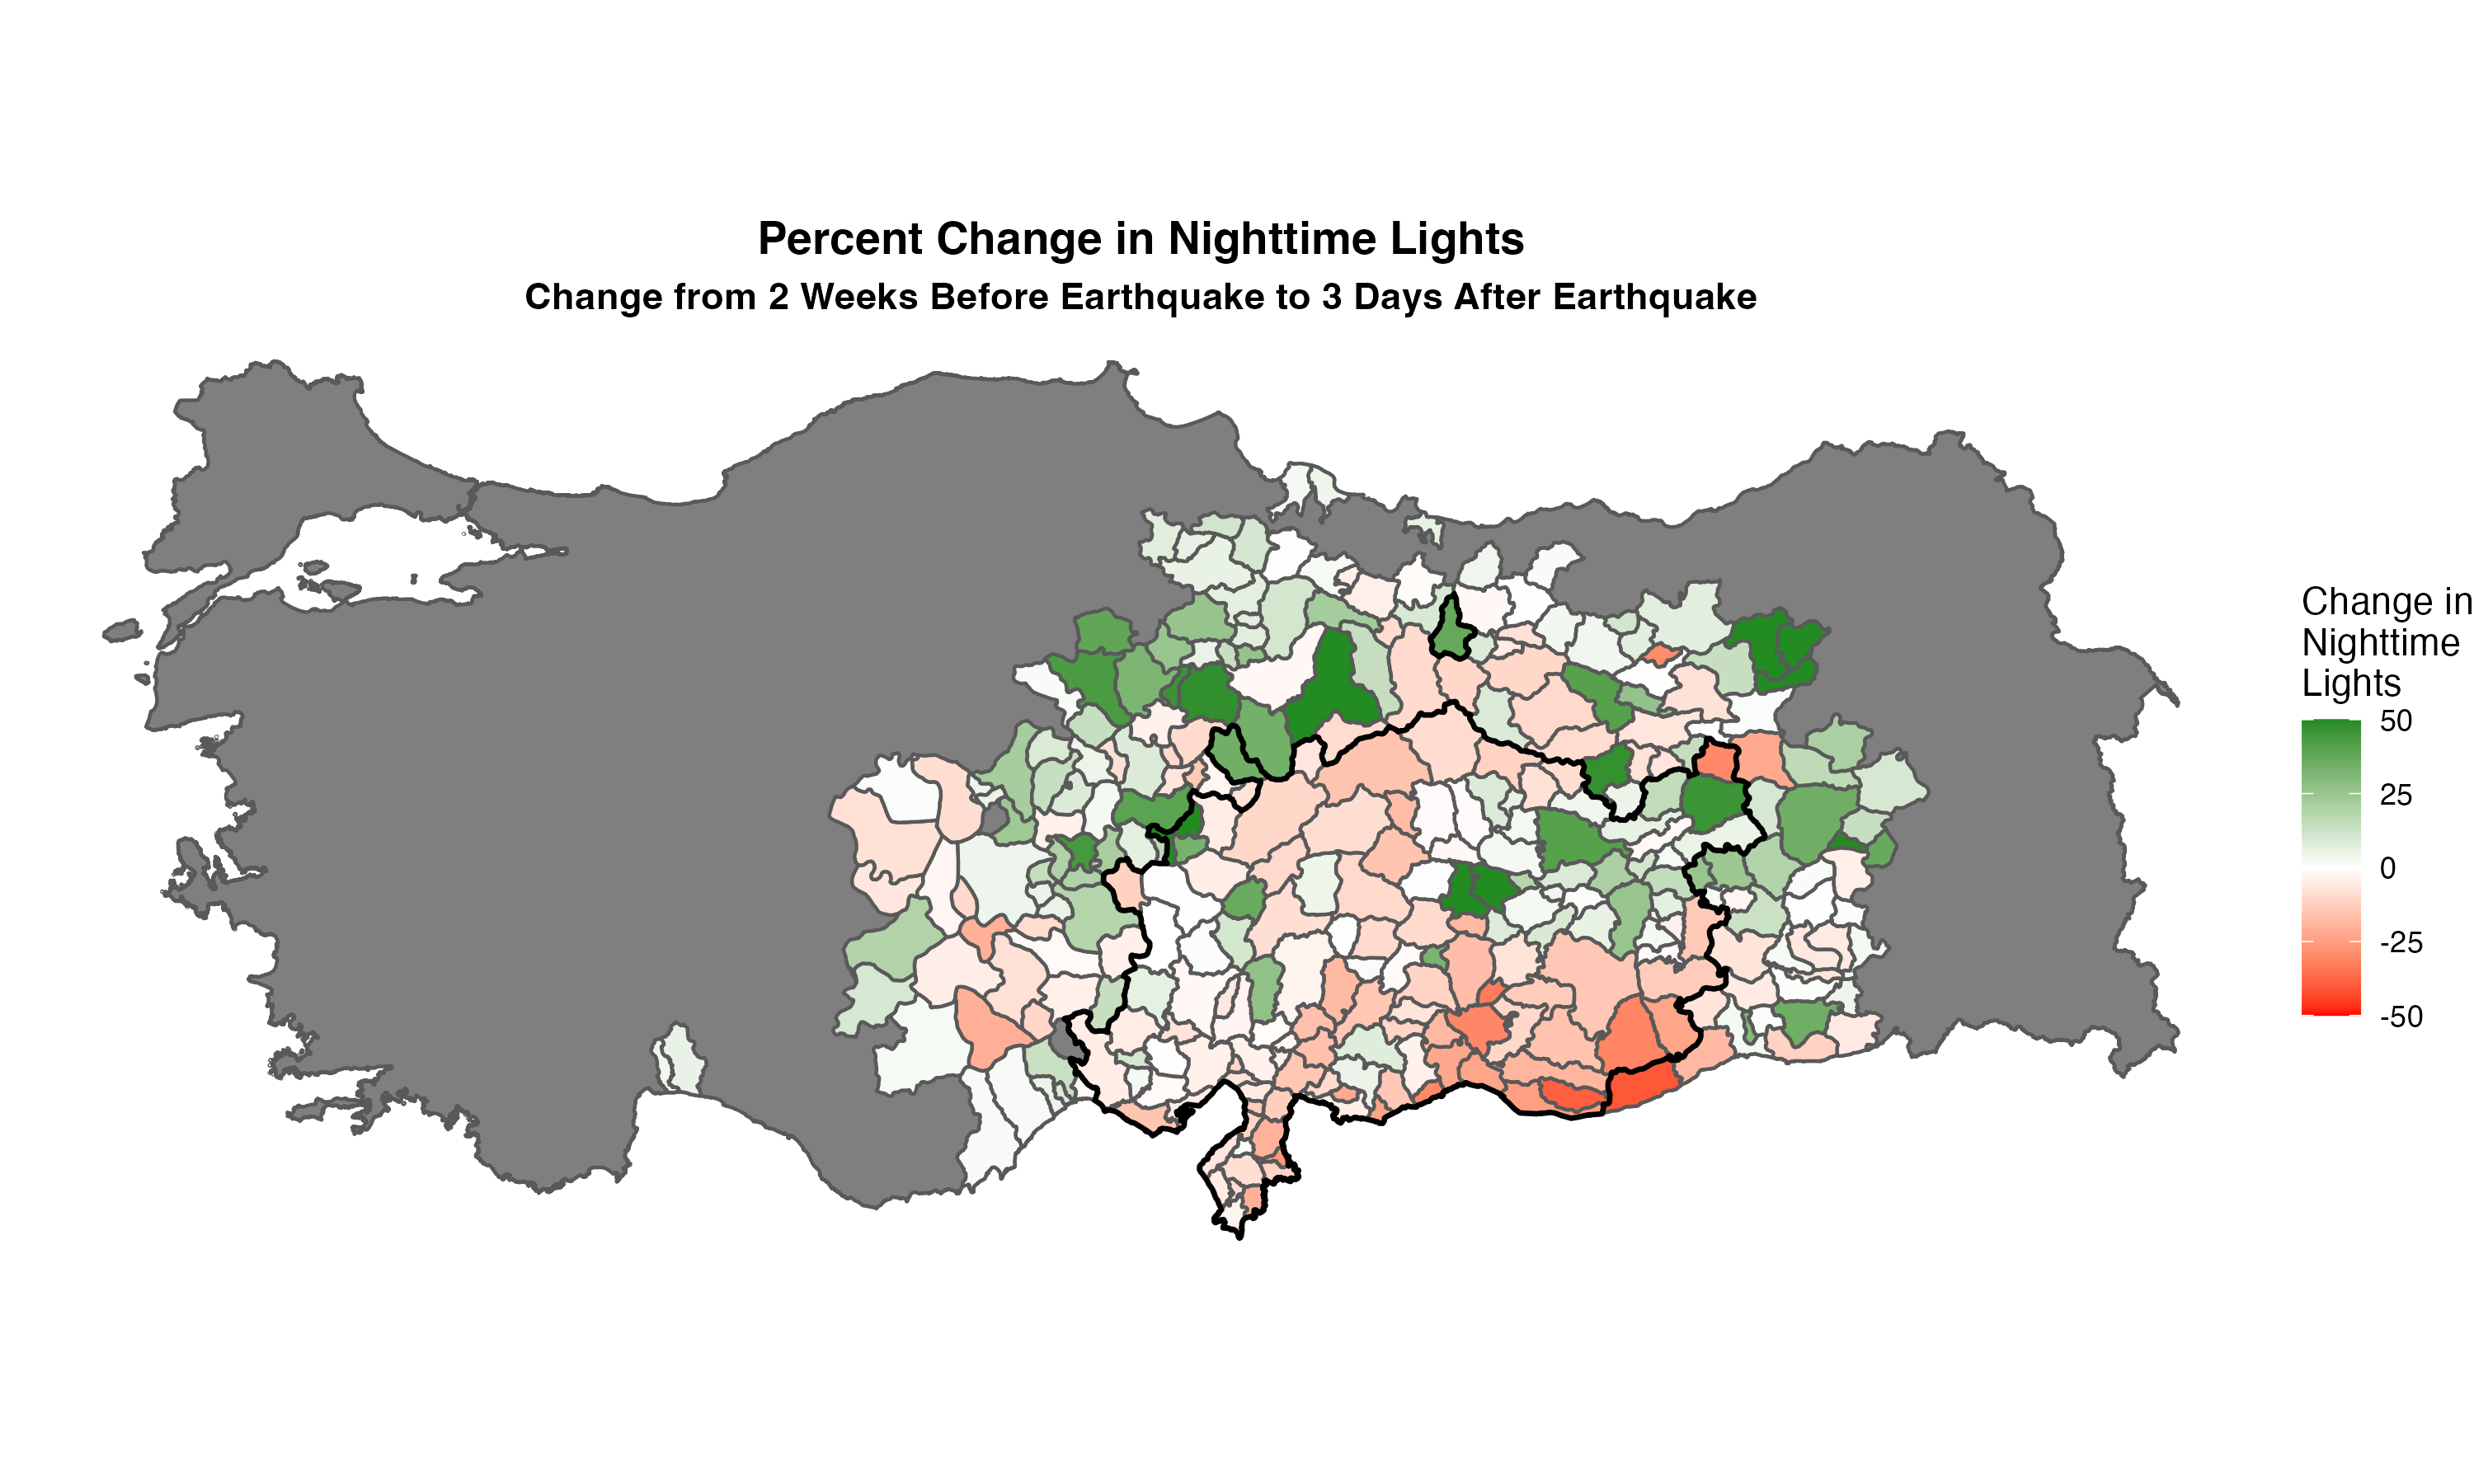
Fig. 6 Change in nighttime lights from two weeks before the earthquake (February 6, 2023) to three days after the earthquake. The figure shows administrative units where the earthquake had a 5 or more magnitude; the black line outlines administrative units where there was a magnitude of 6 or more.#
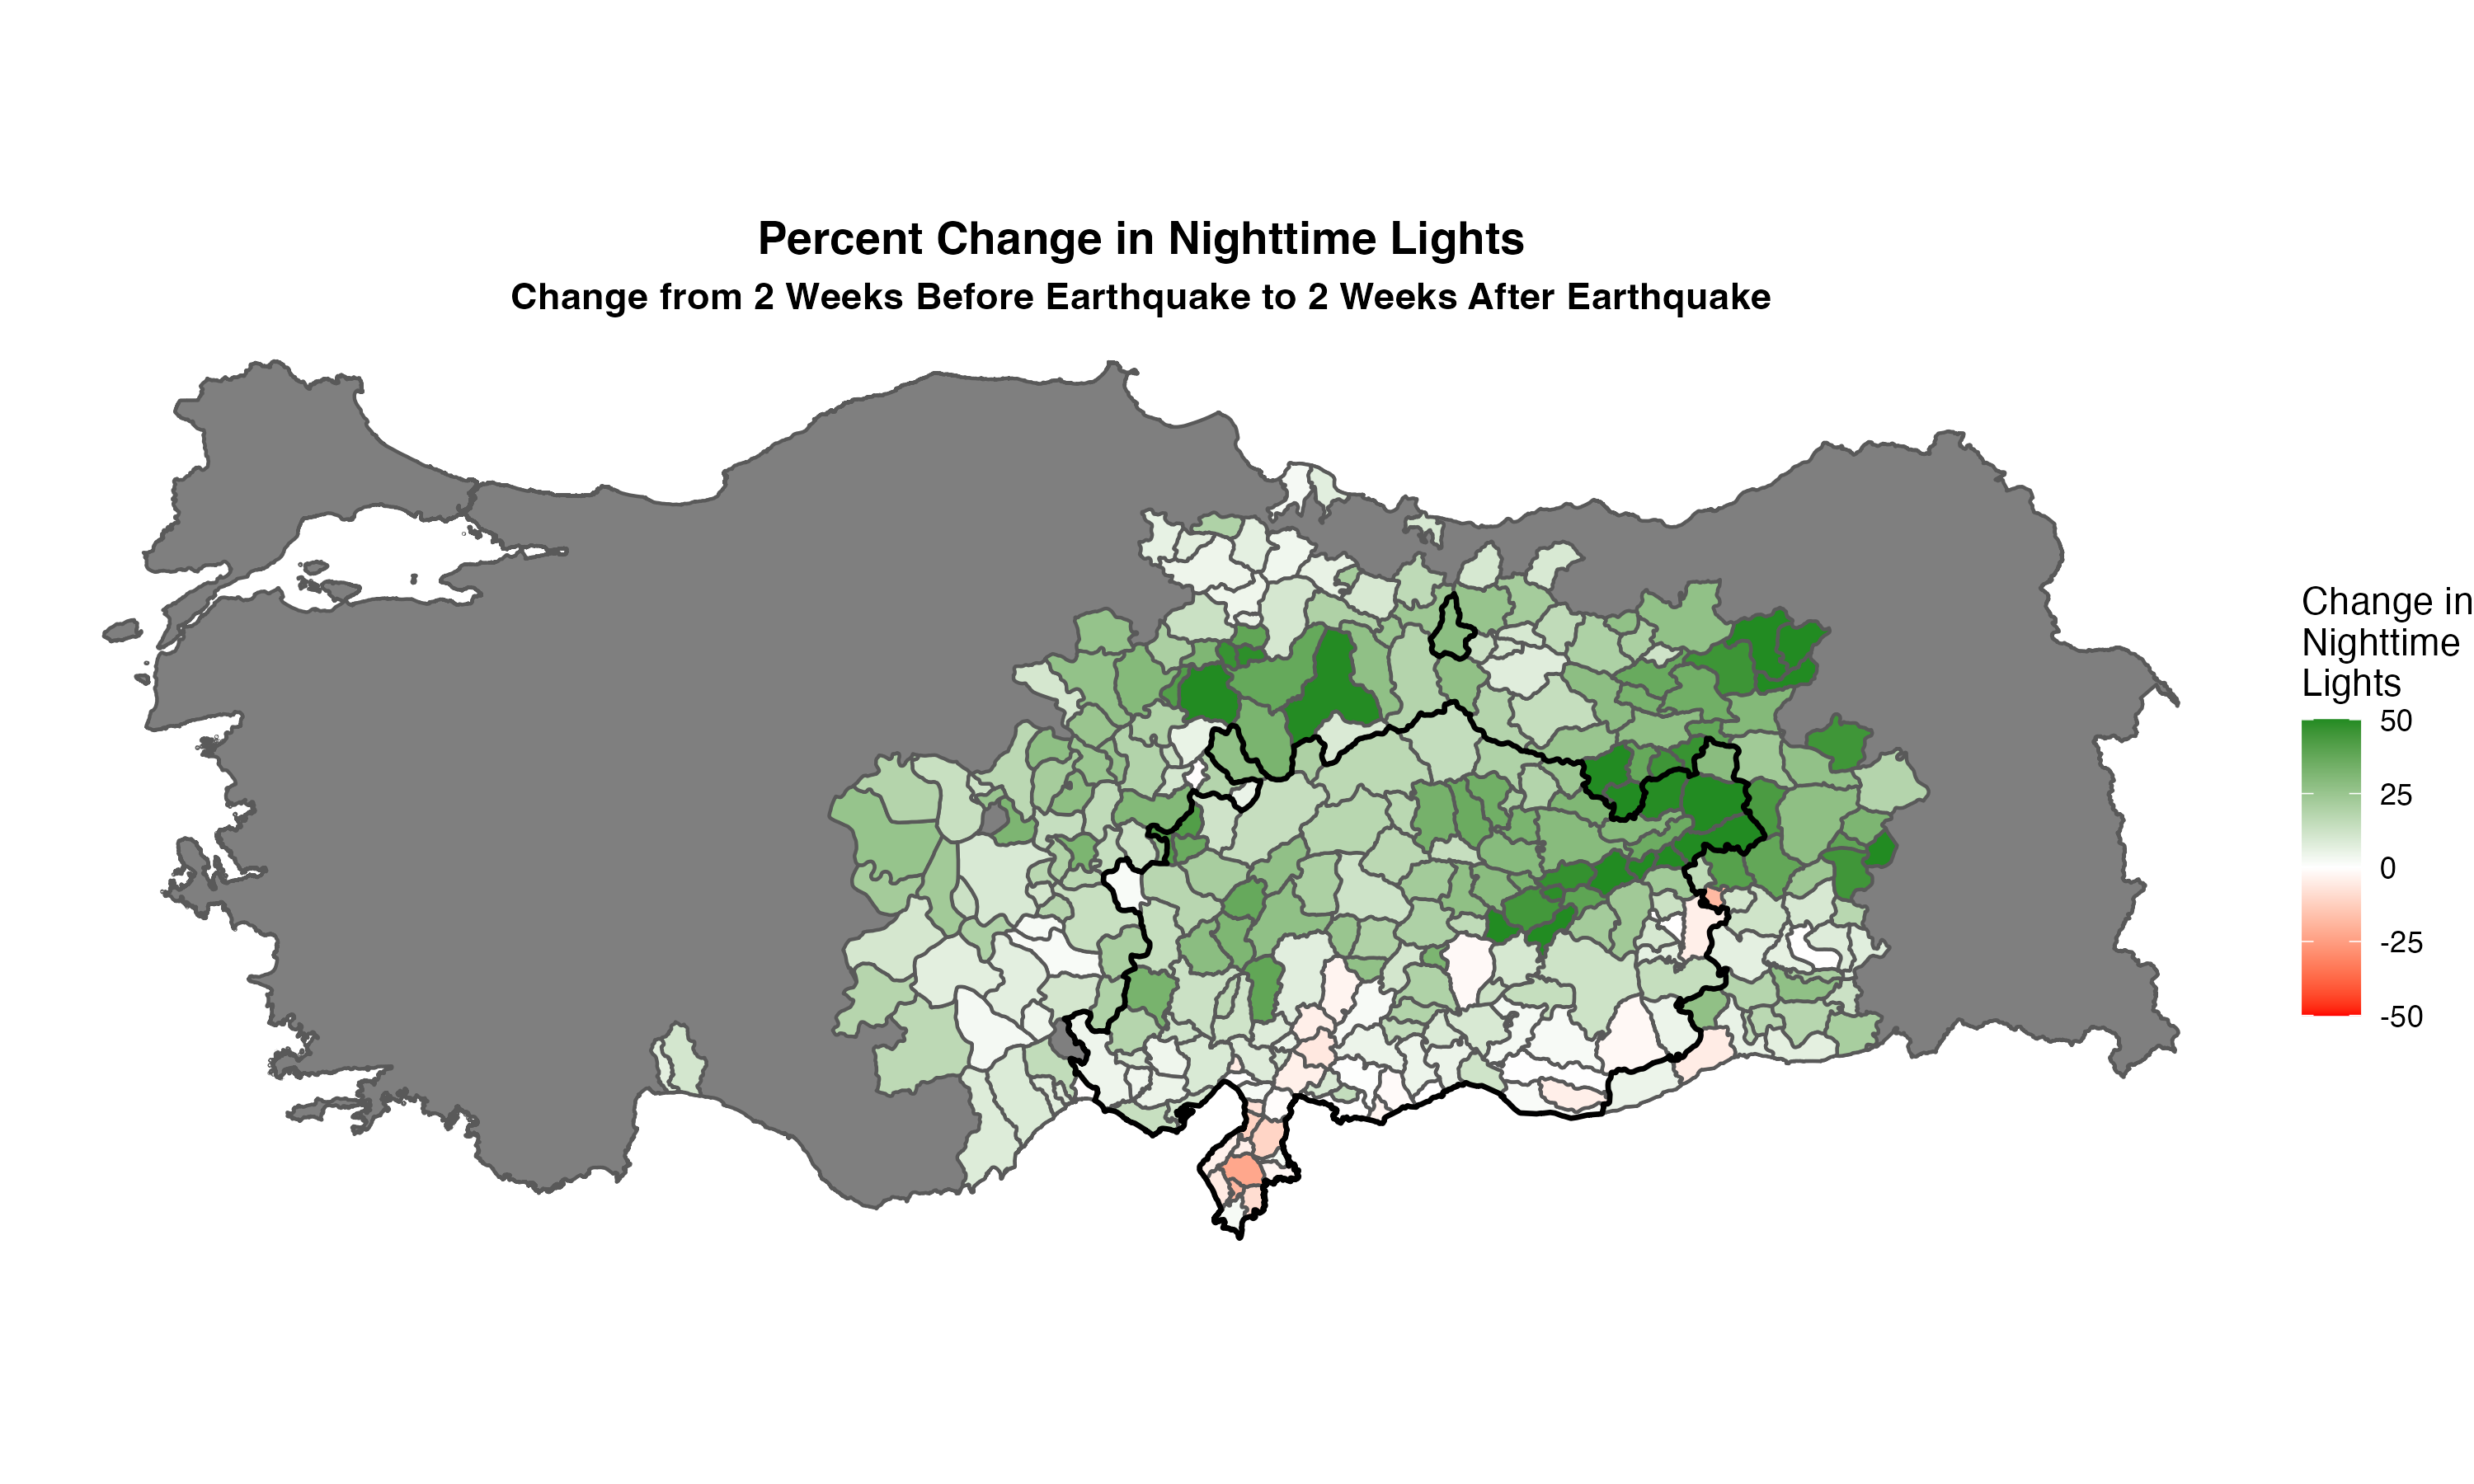
Fig. 7 Change in nighttime lights from two weeks before the earthquake (February 6, 2023) to two weeks after the earthquake. The figure shows administrative units where the earthquake had a 5 or more magnitude; the black line outlines administrative units where there was a magnitude of 6 or more.#
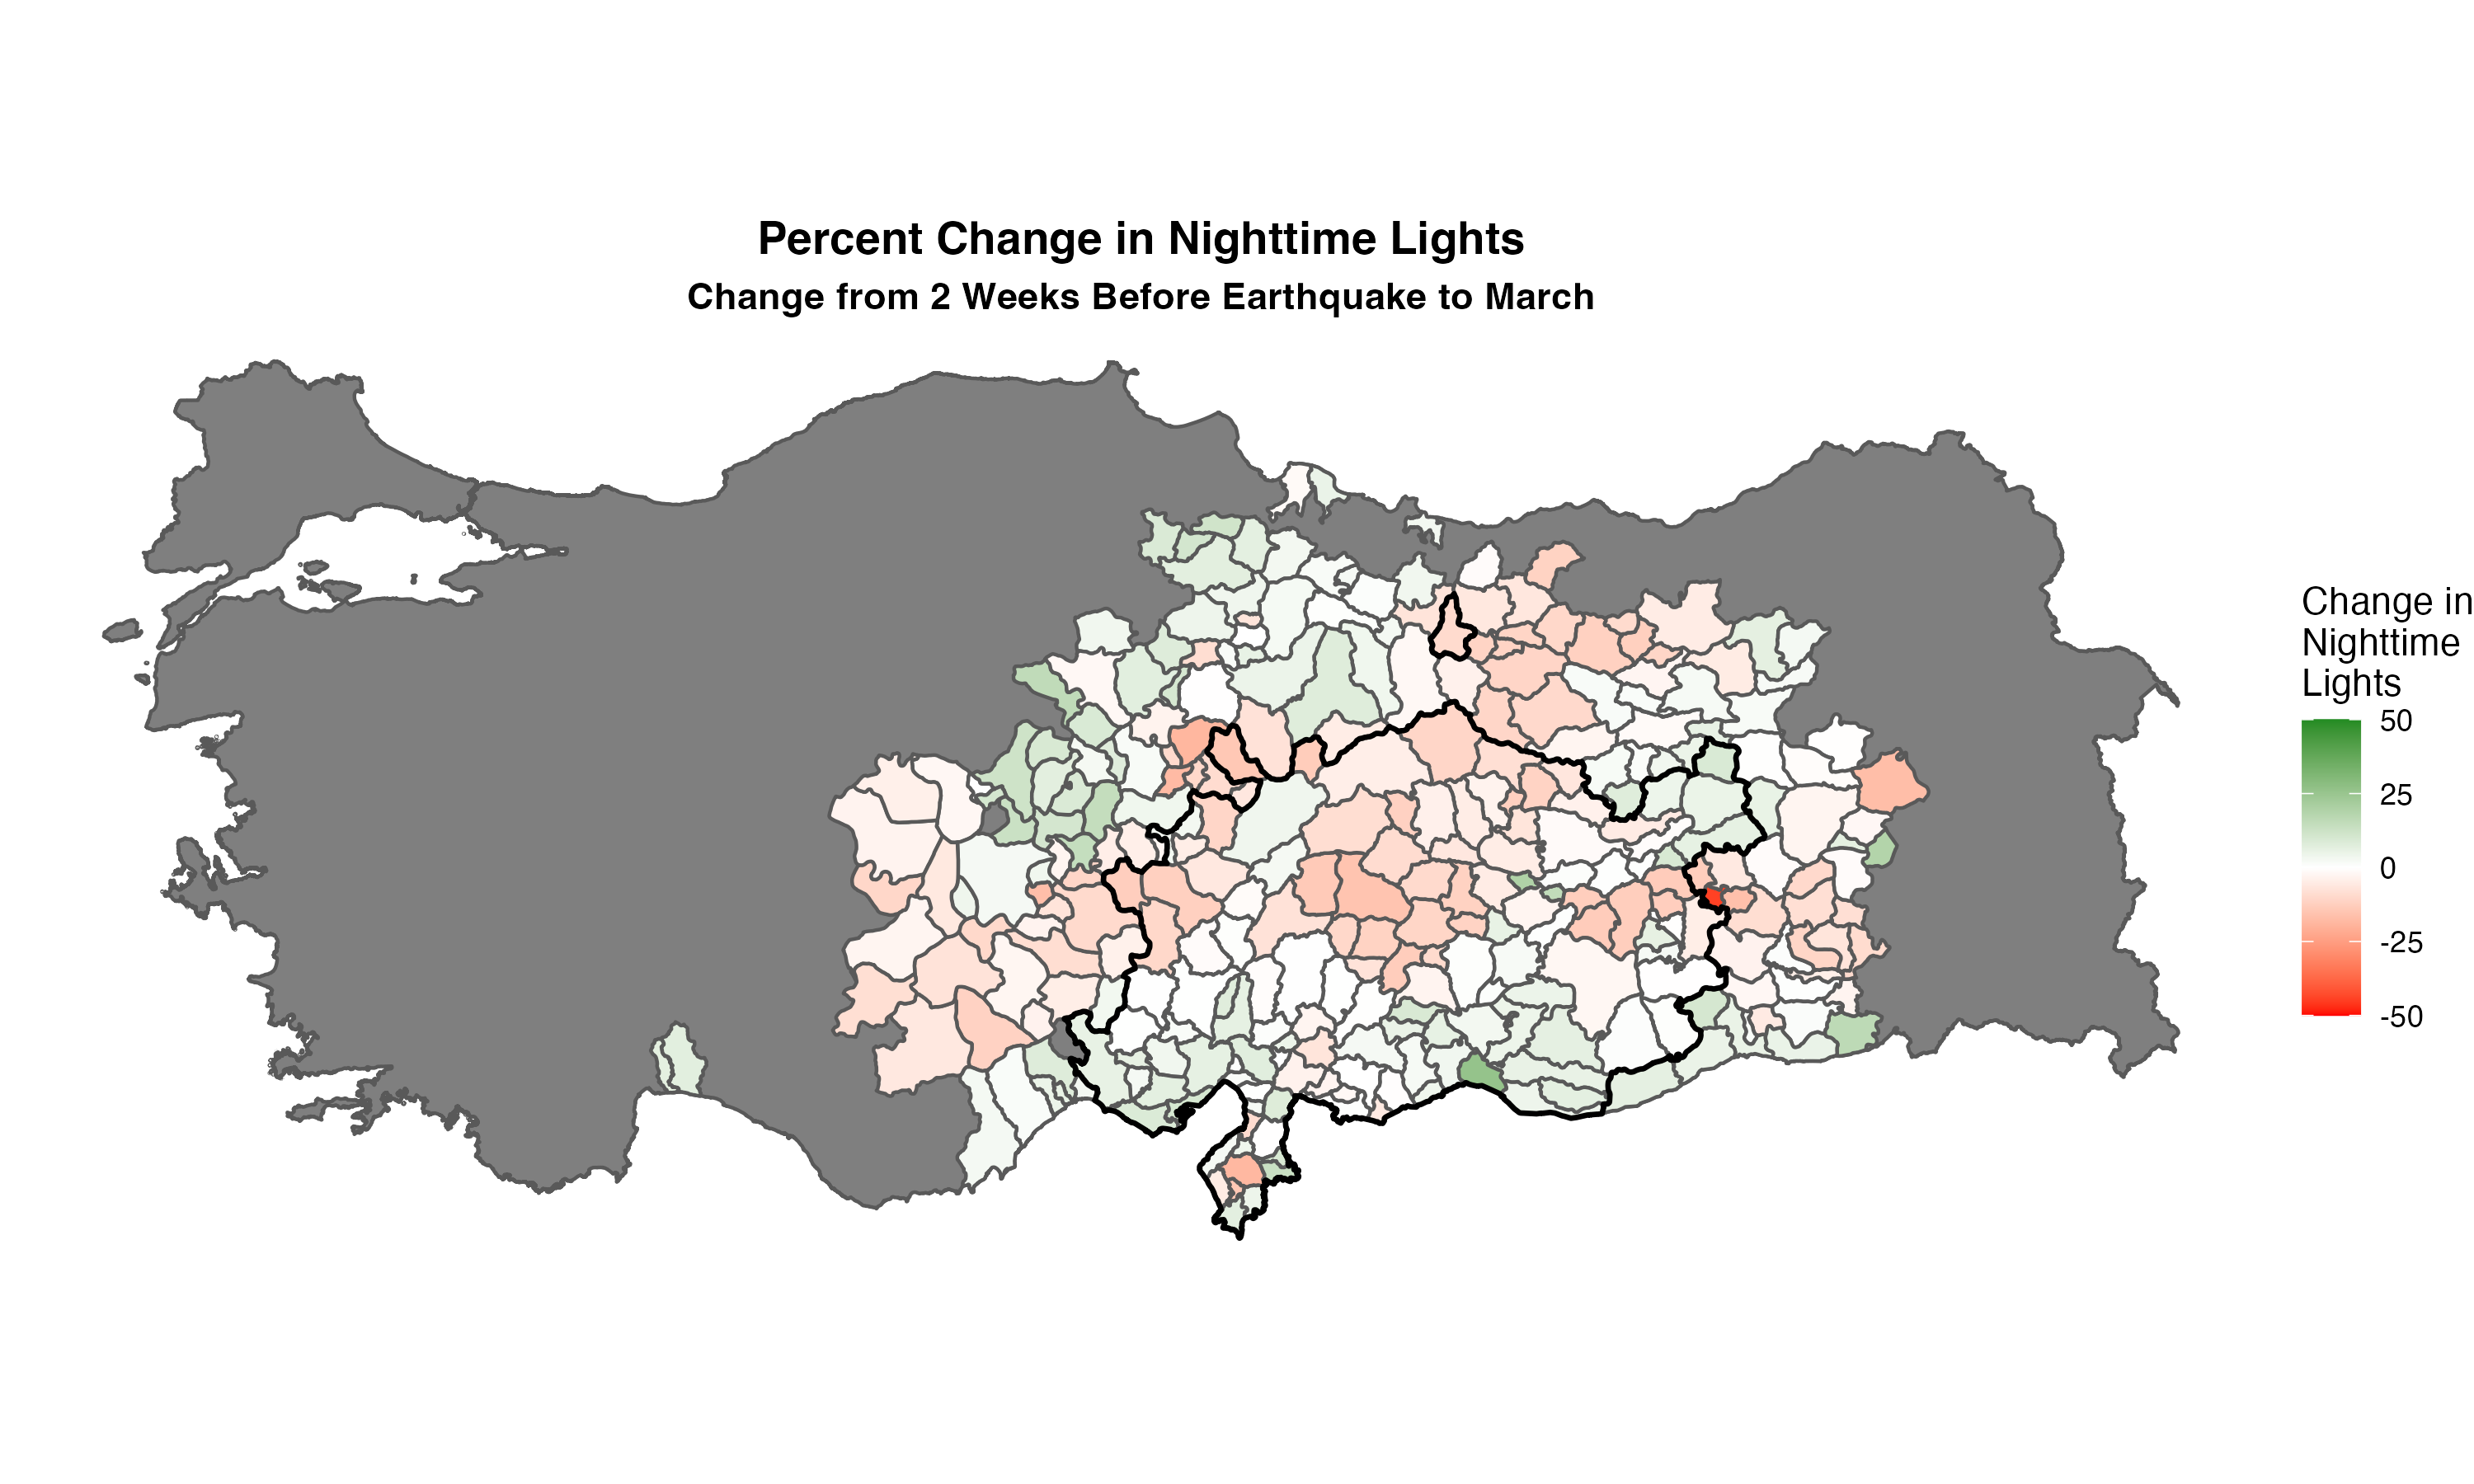
Fig. 8 Change in nighttime lights from two weeks before the earthquake (February 6, 2023) to March. The figure shows administrative units where the earthquake had a 5 or more magnitude; the black line outlines administrative units where there was a magnitude of 6 or more.#
+/-10% Change#
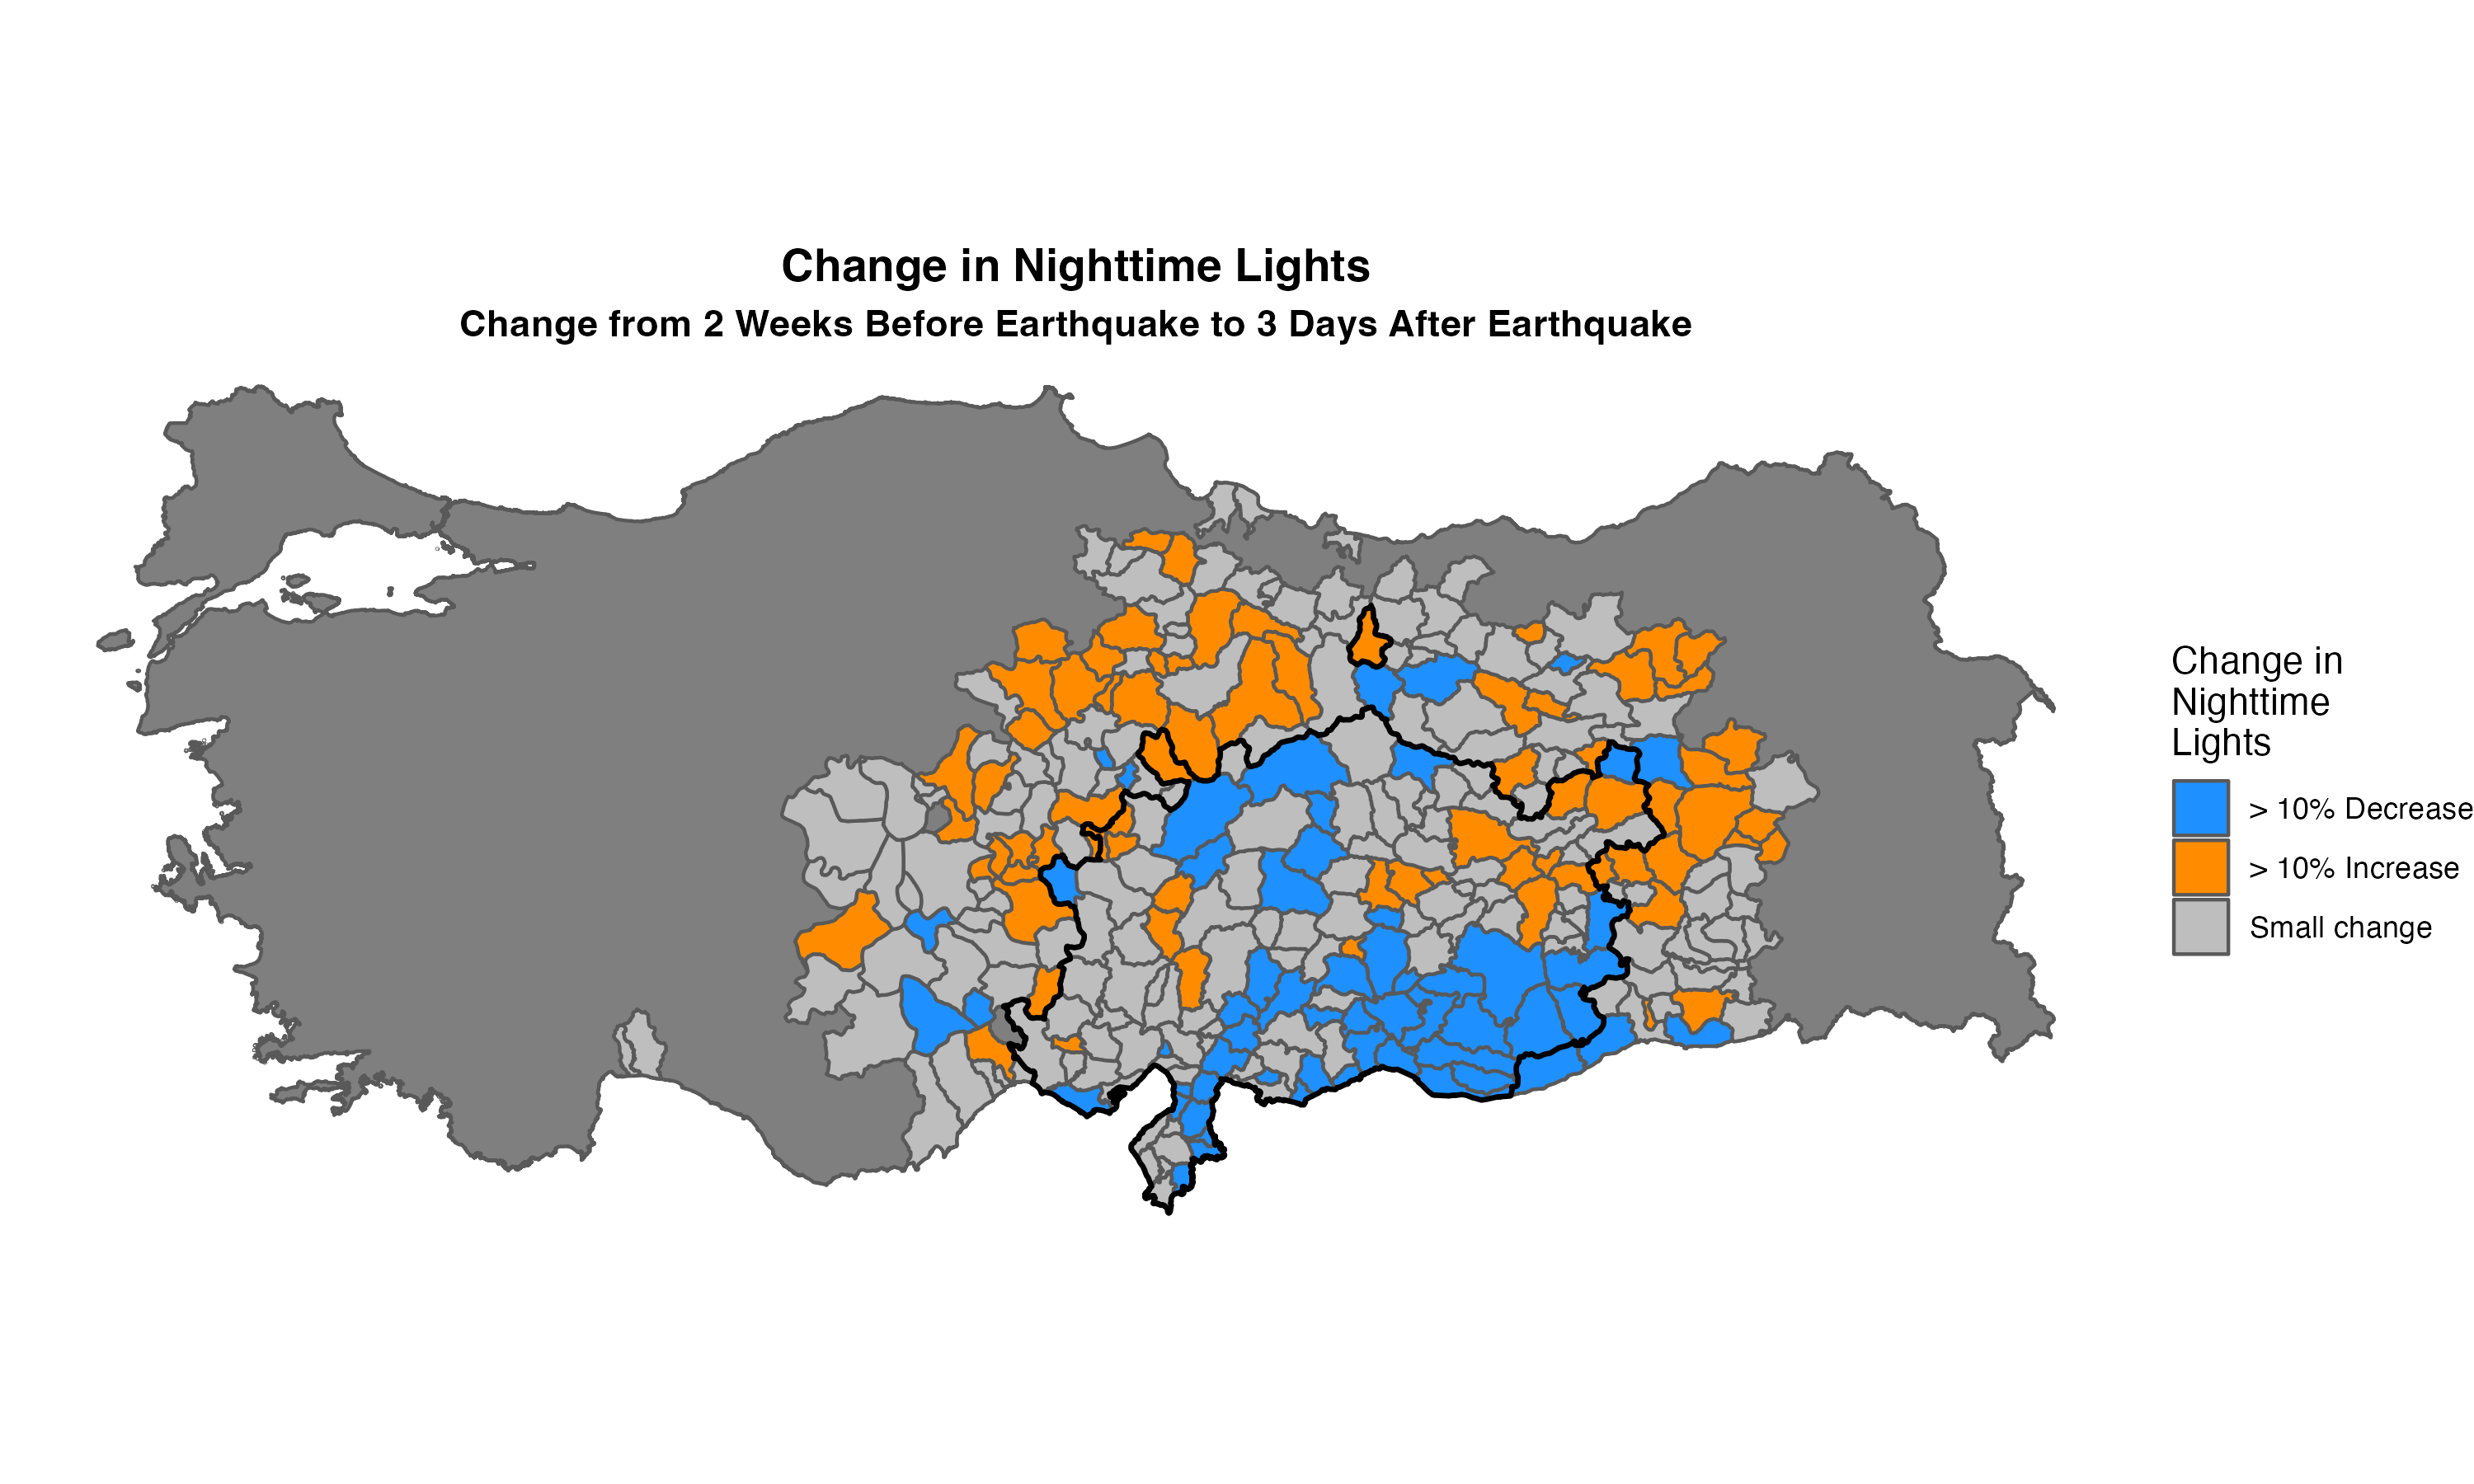
Fig. 9 Change in nighttime lights from two weeks before the earthquake (February 6, 2023) to three days after the earthquake. The figure shows administrative units where the earthquake had a 5 or more magnitude; the black line outlines administrative units where there was a magnitude of 6 or more.#
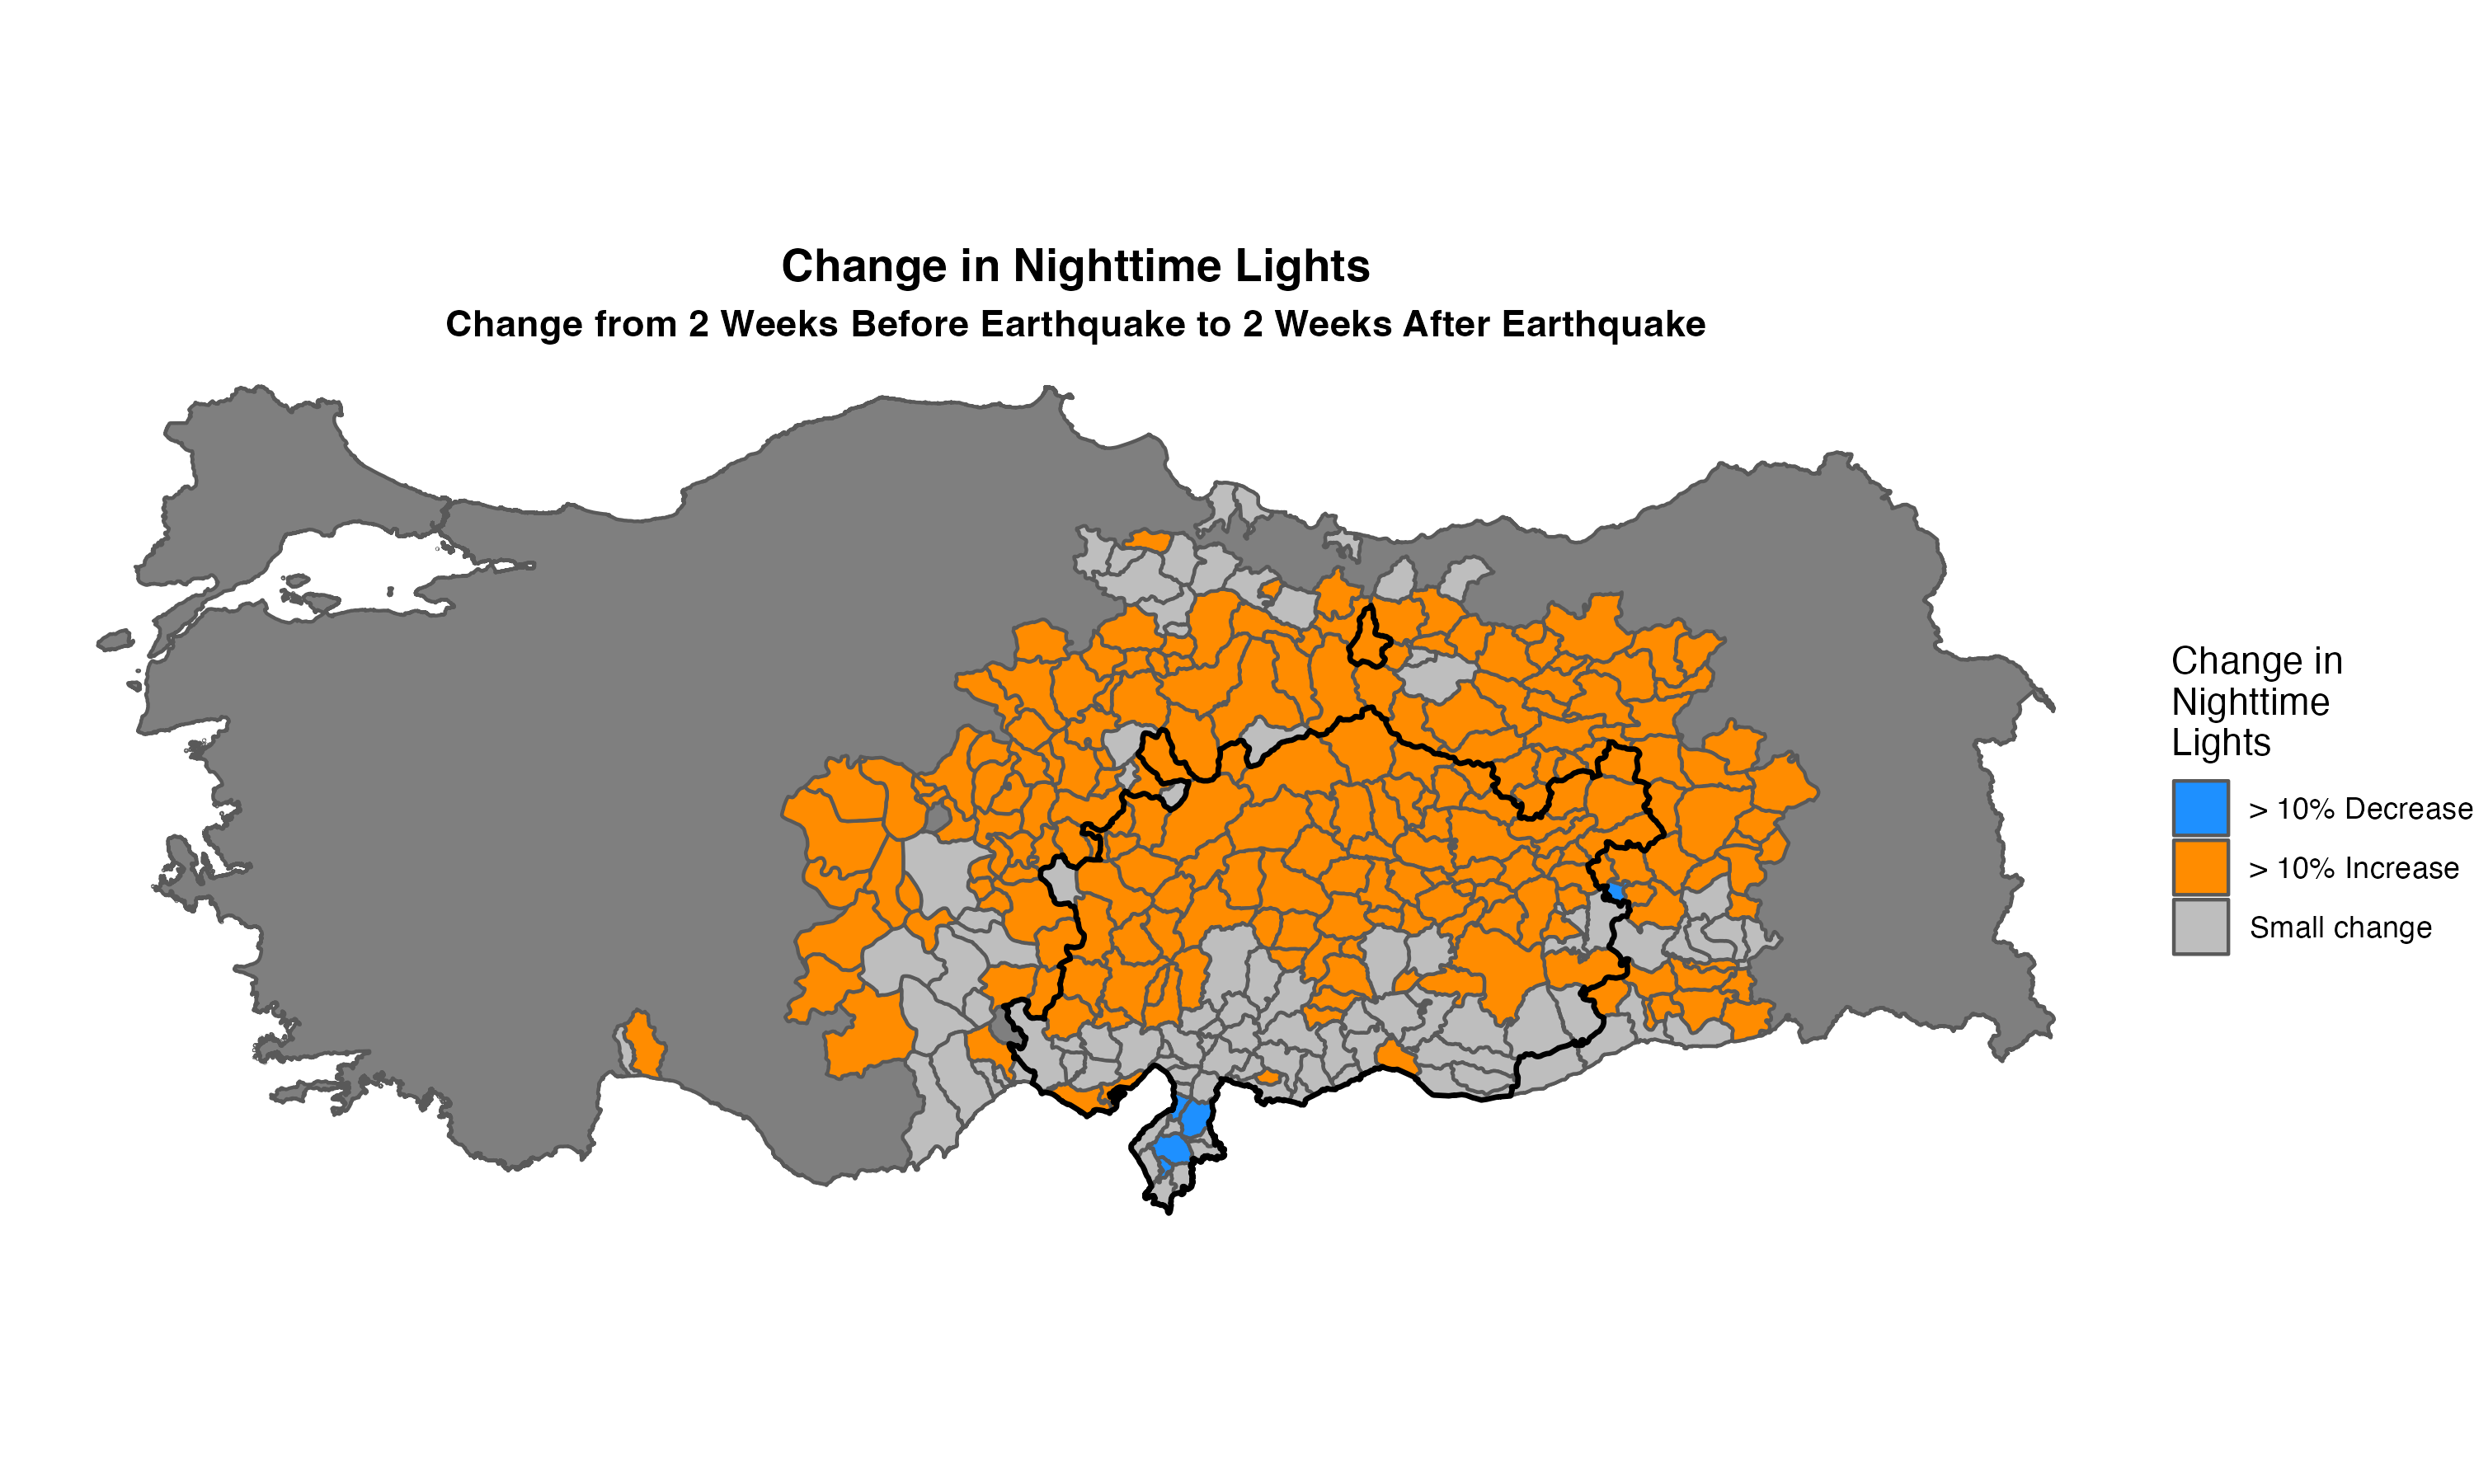
Fig. 10 Change in nighttime lights from two weeks before the earthquake (February 6, 2023) to two weeks after the earthquake. The figure shows administrative units where the earthquake had a 5 or more magnitude; the black line outlines administrative units where there was a magnitude of 6 or more.#
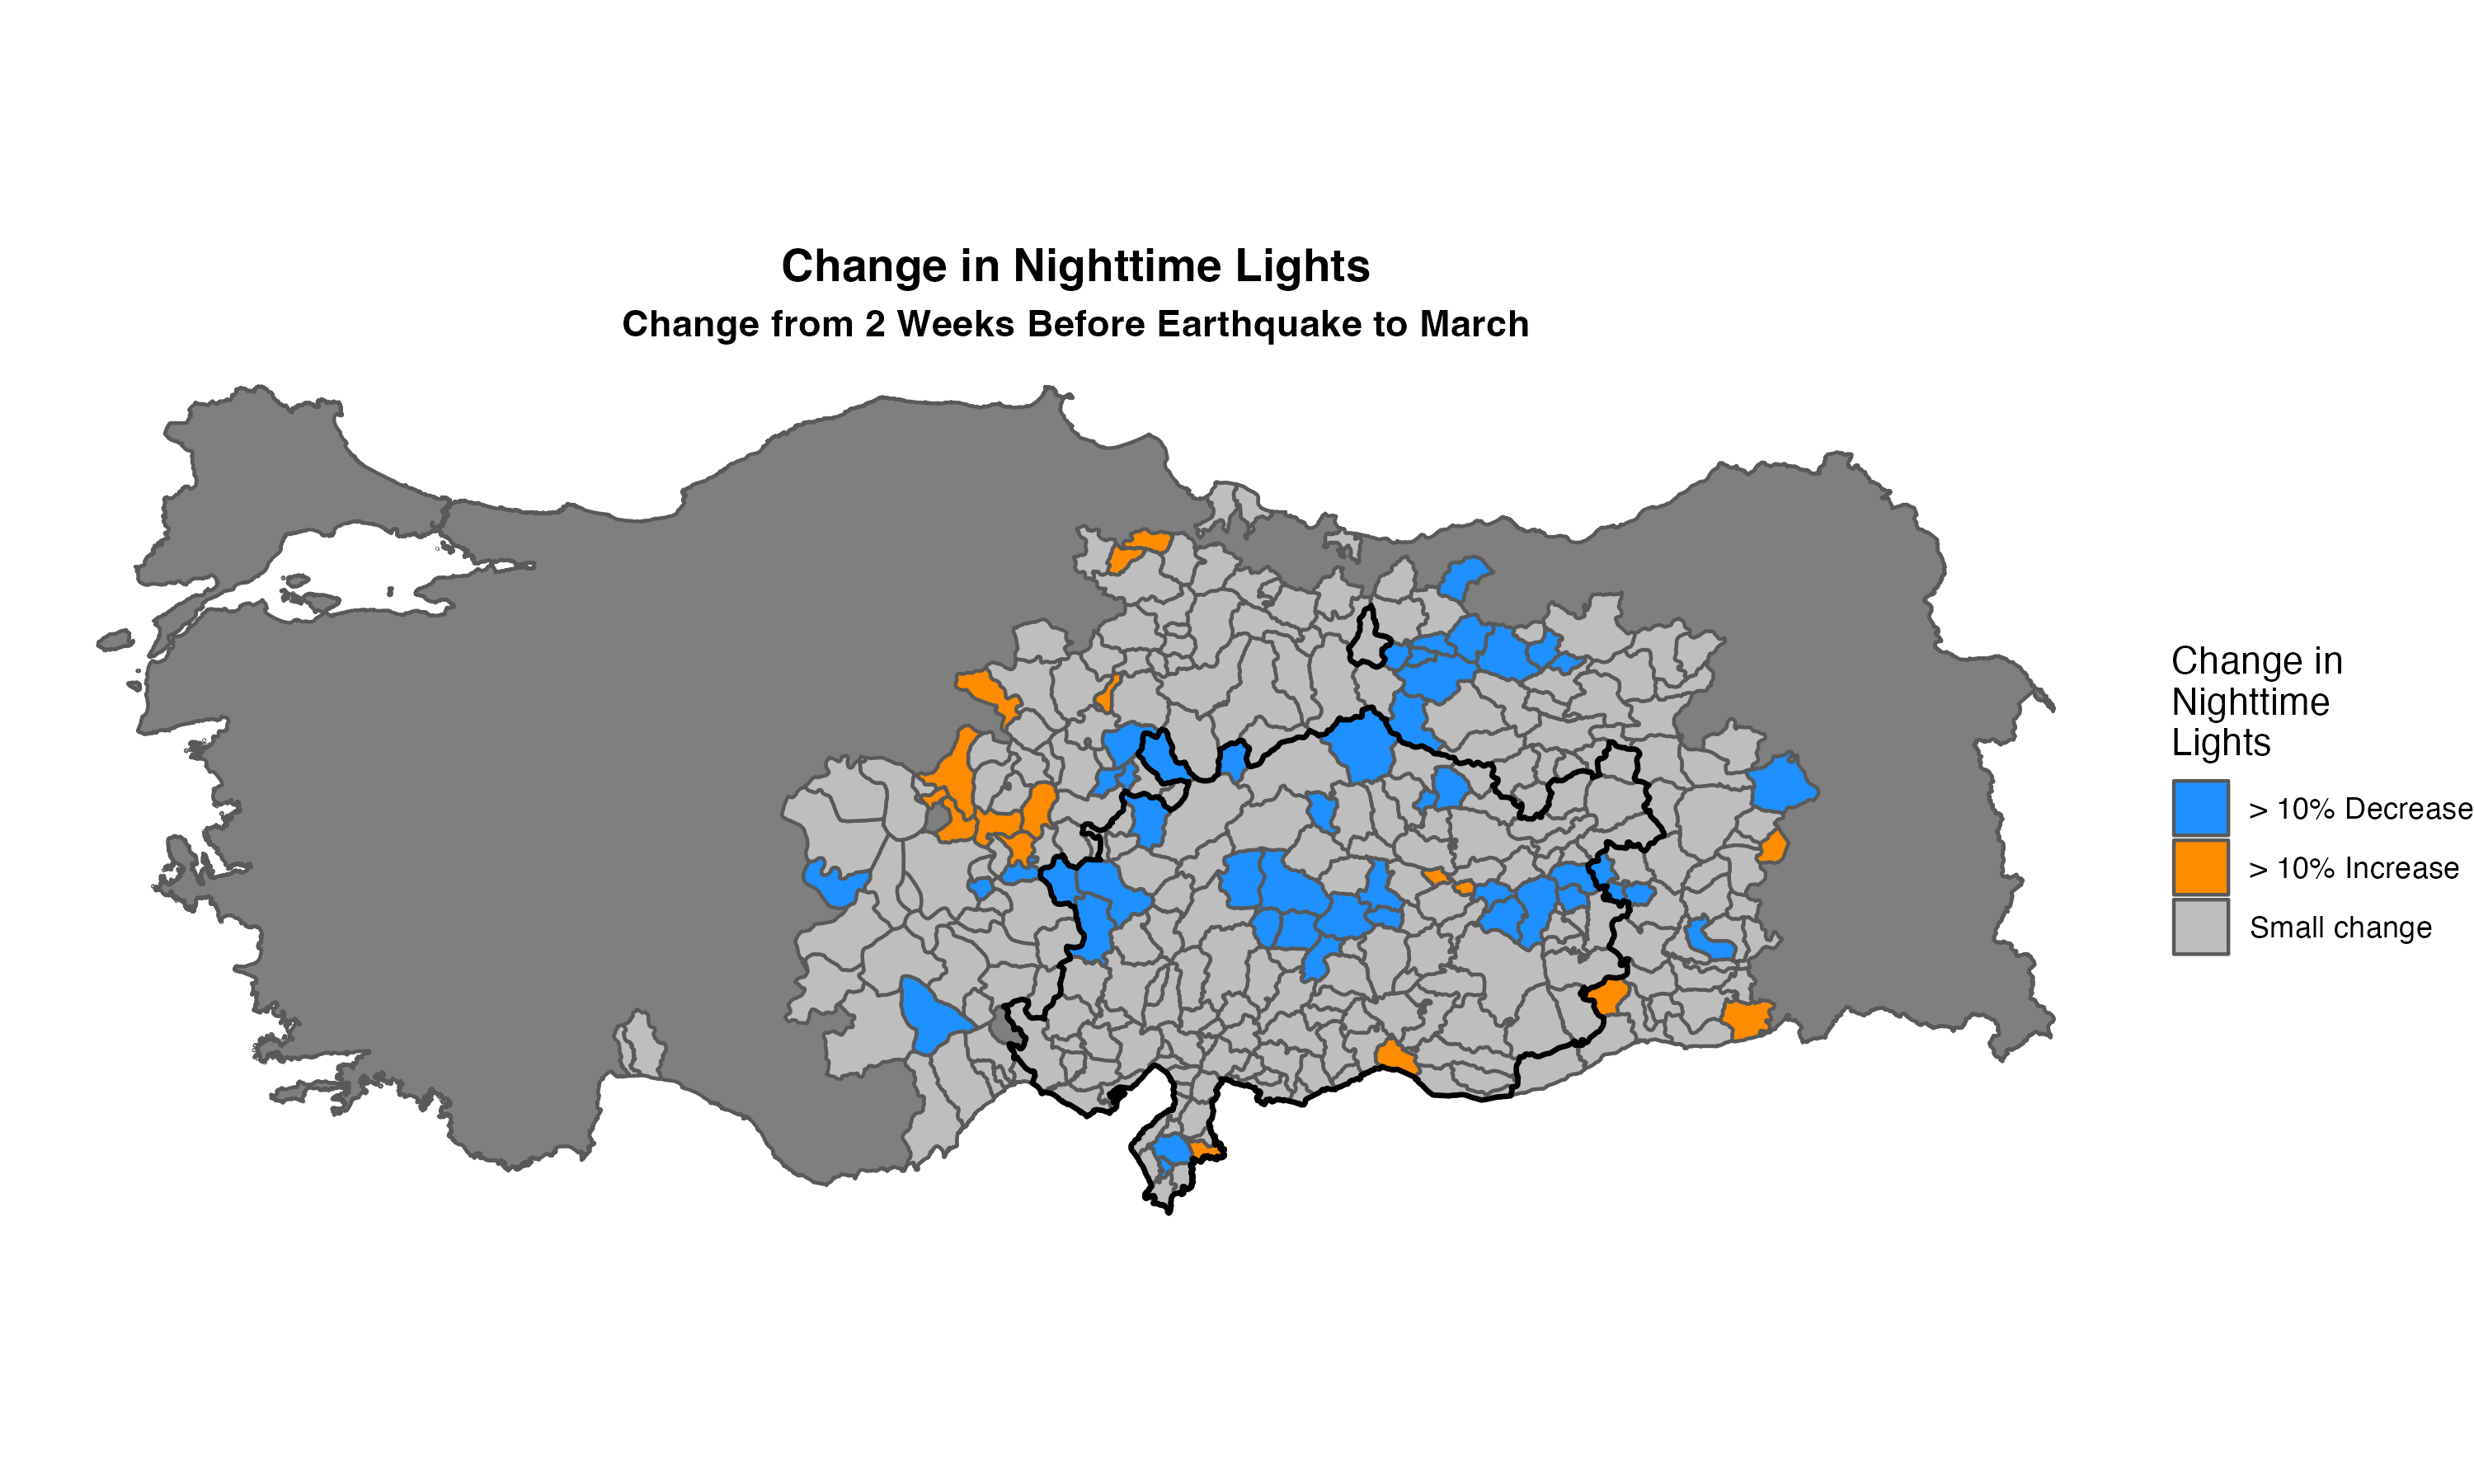
Fig. 11 Change in nighttime lights from two weeks before the earthquake (February 6, 2023) to March. The figure shows administrative units where the earthquake had a 5 or more magnitude; the black line outlines administrative units where there was a magnitude of 6 or more.#
Trends in Nighttime Lights#
The below figures shows daily trends in nighttime lights, averaged within administrative units. The first figures further average nighttime lights by the earthquake intensity experienced by administrative units. The following figures show nighttime lights for individual administrative units. Some locations, such as Antakya (which had the largest nighttime lights), saw a sharp reduction in nighttime lights. Others see large increases in nighttime lights, which likely reflects lights from rescue efforts.
This script produces the below figure, where the relevant code is also documented below. The code relies on daily nighttime lights data that has been aggregated to the ADM2 level; this dataset is produced using. Before running the below code, the code from here needs to be run to load packages and define file paths.
Nighttime lights trends: by earthquake intensity (magnitude), averaged across administrative units#
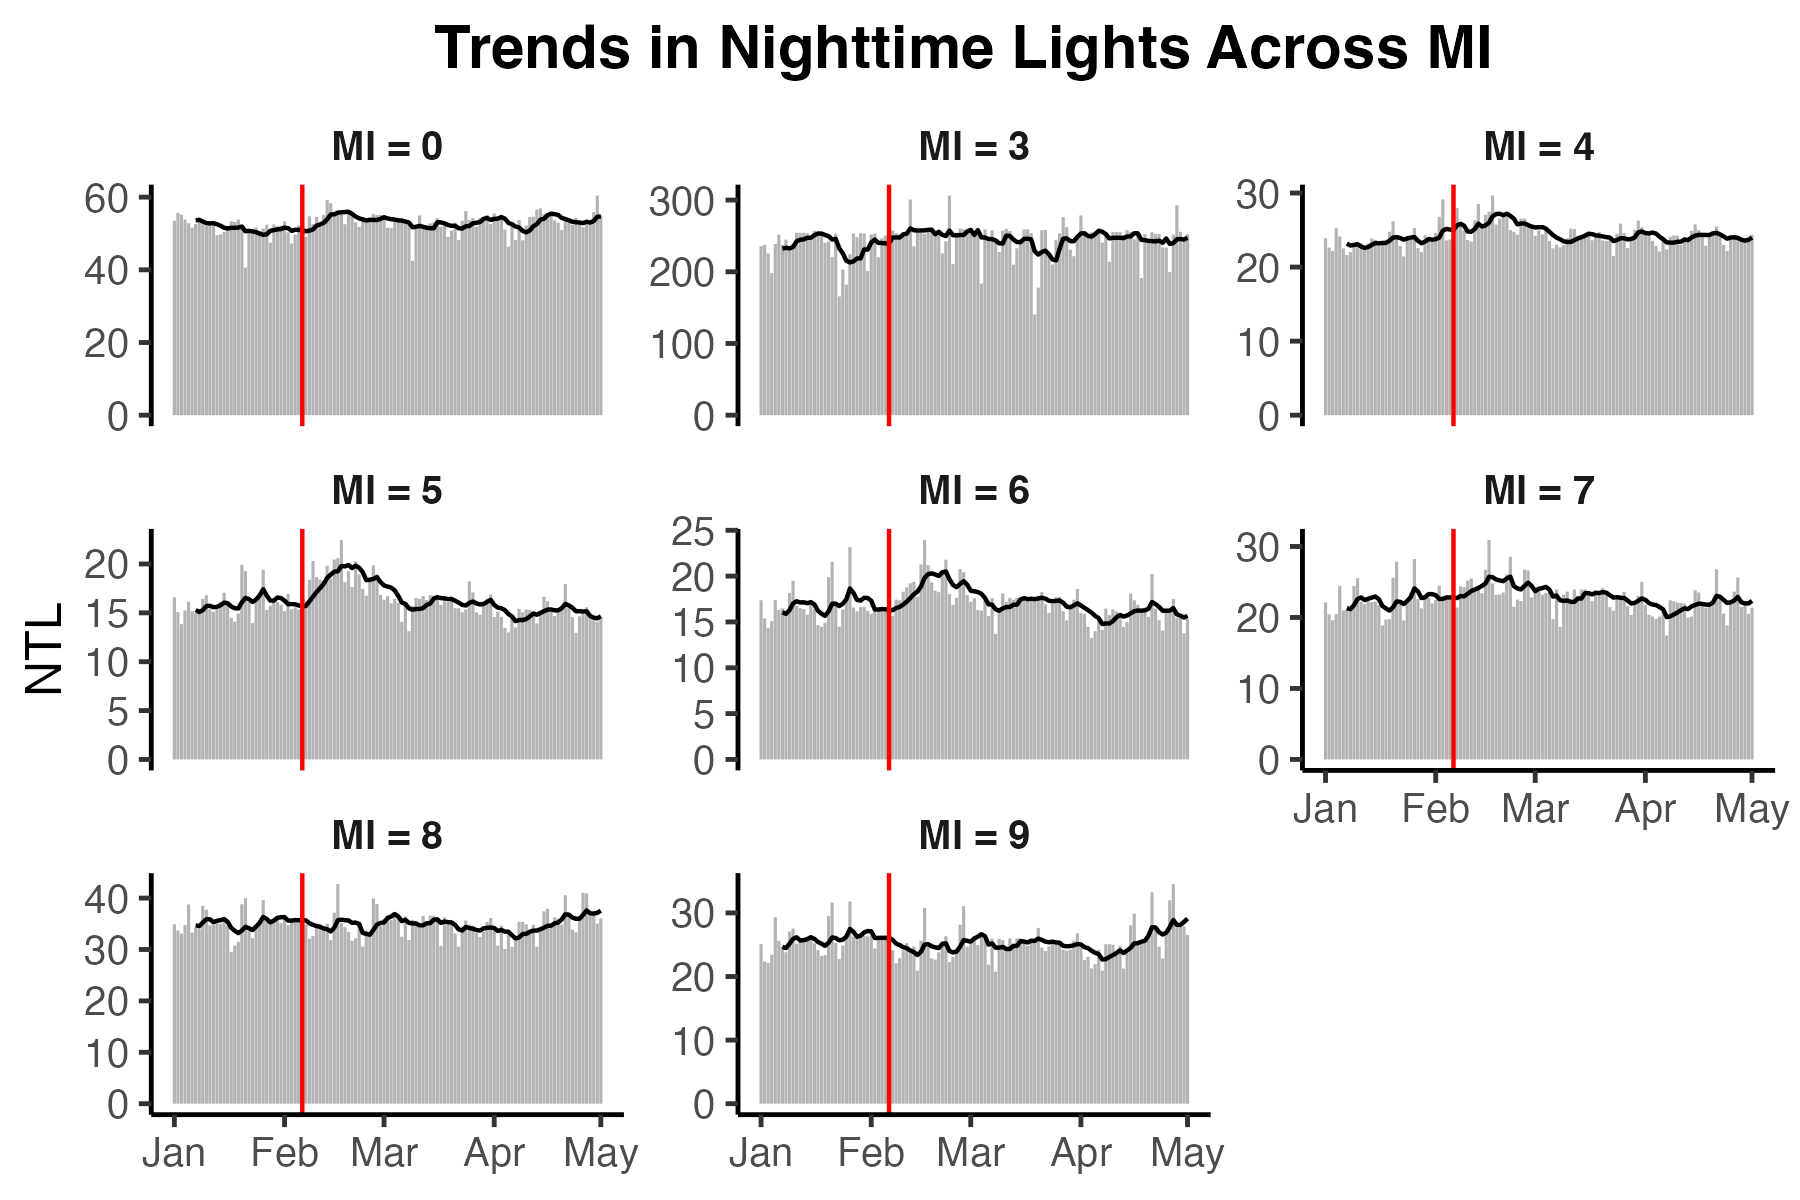
Fig. 12 Trends in nighttime lights. Average across administrative units, by earthquake intensity (magnitude)#
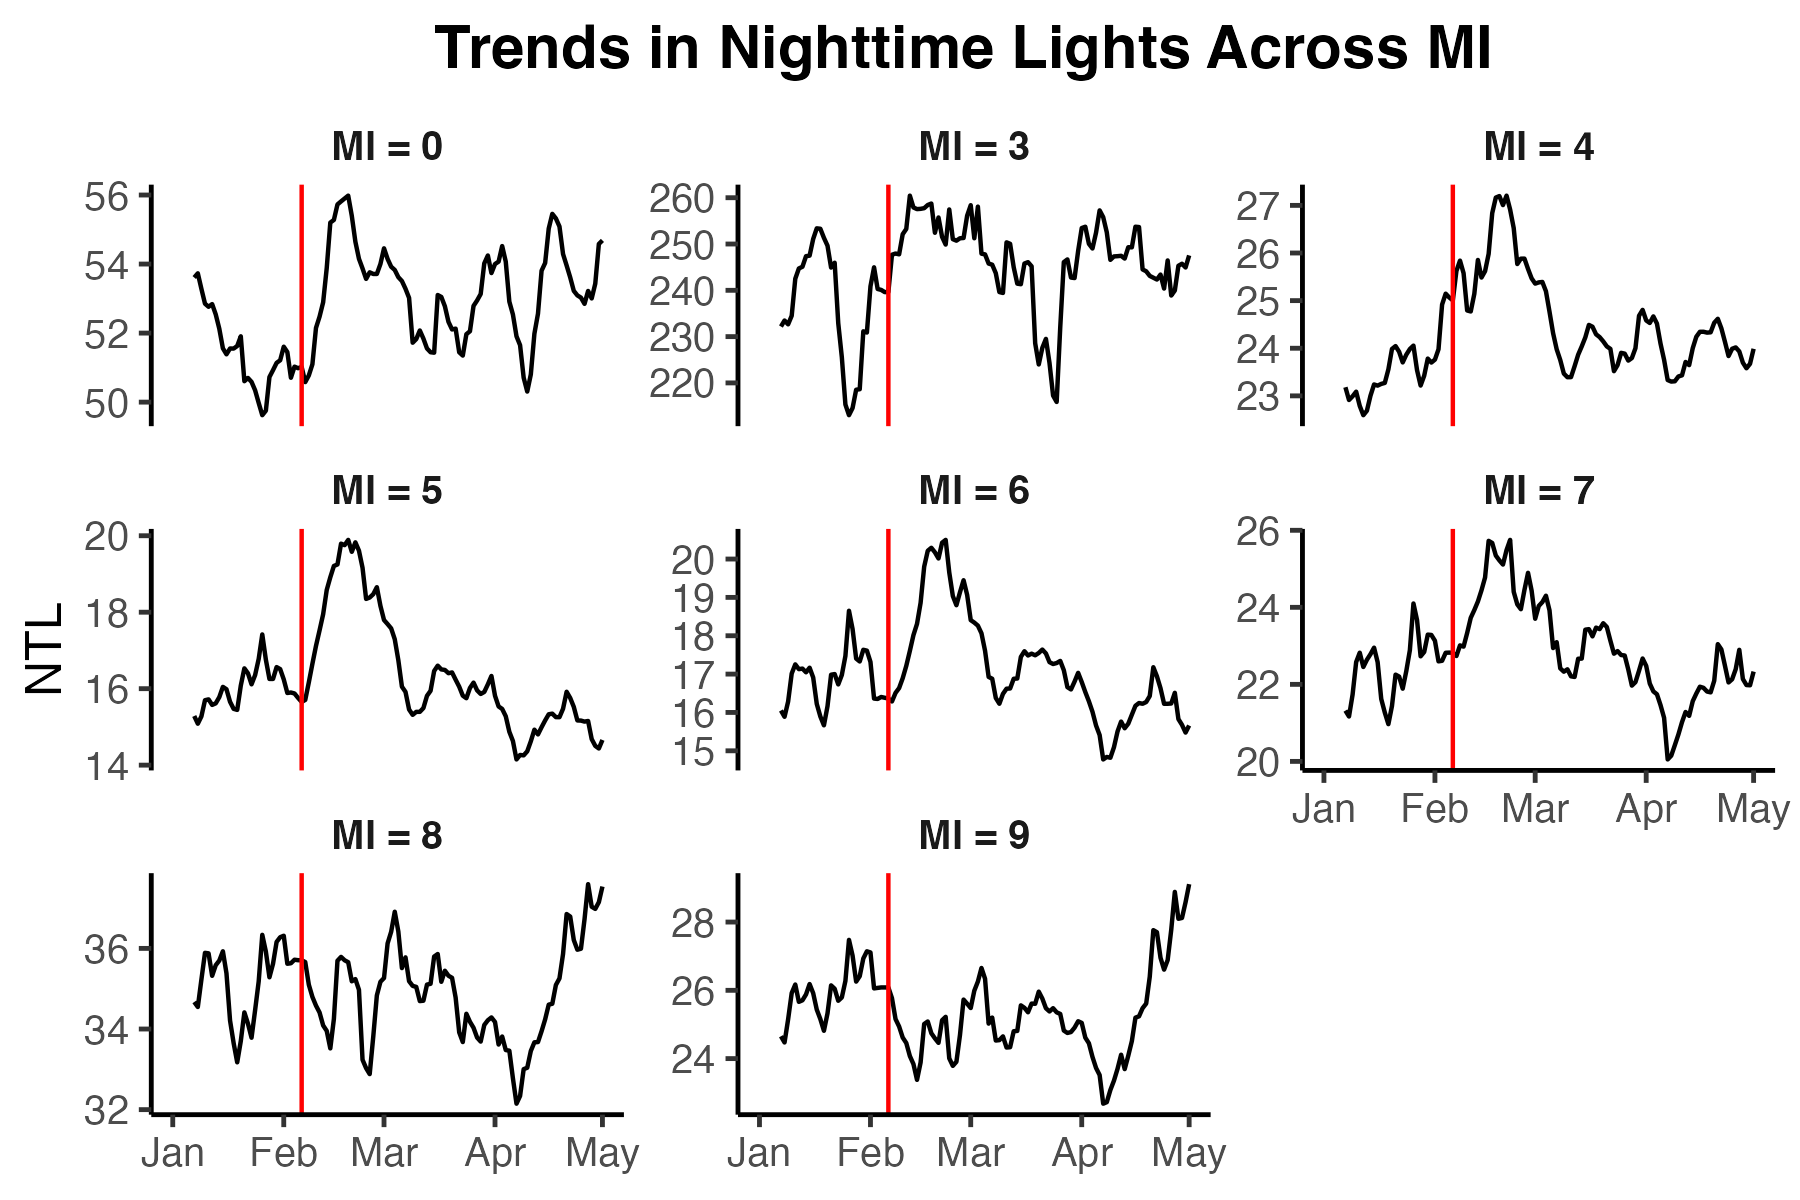
Fig. 13 Trends in nighttime lights. Average across administrative units, by earthquake intensity (magnitude)#
Nighttime lights trends: by earthquake intensity (magnitude)#
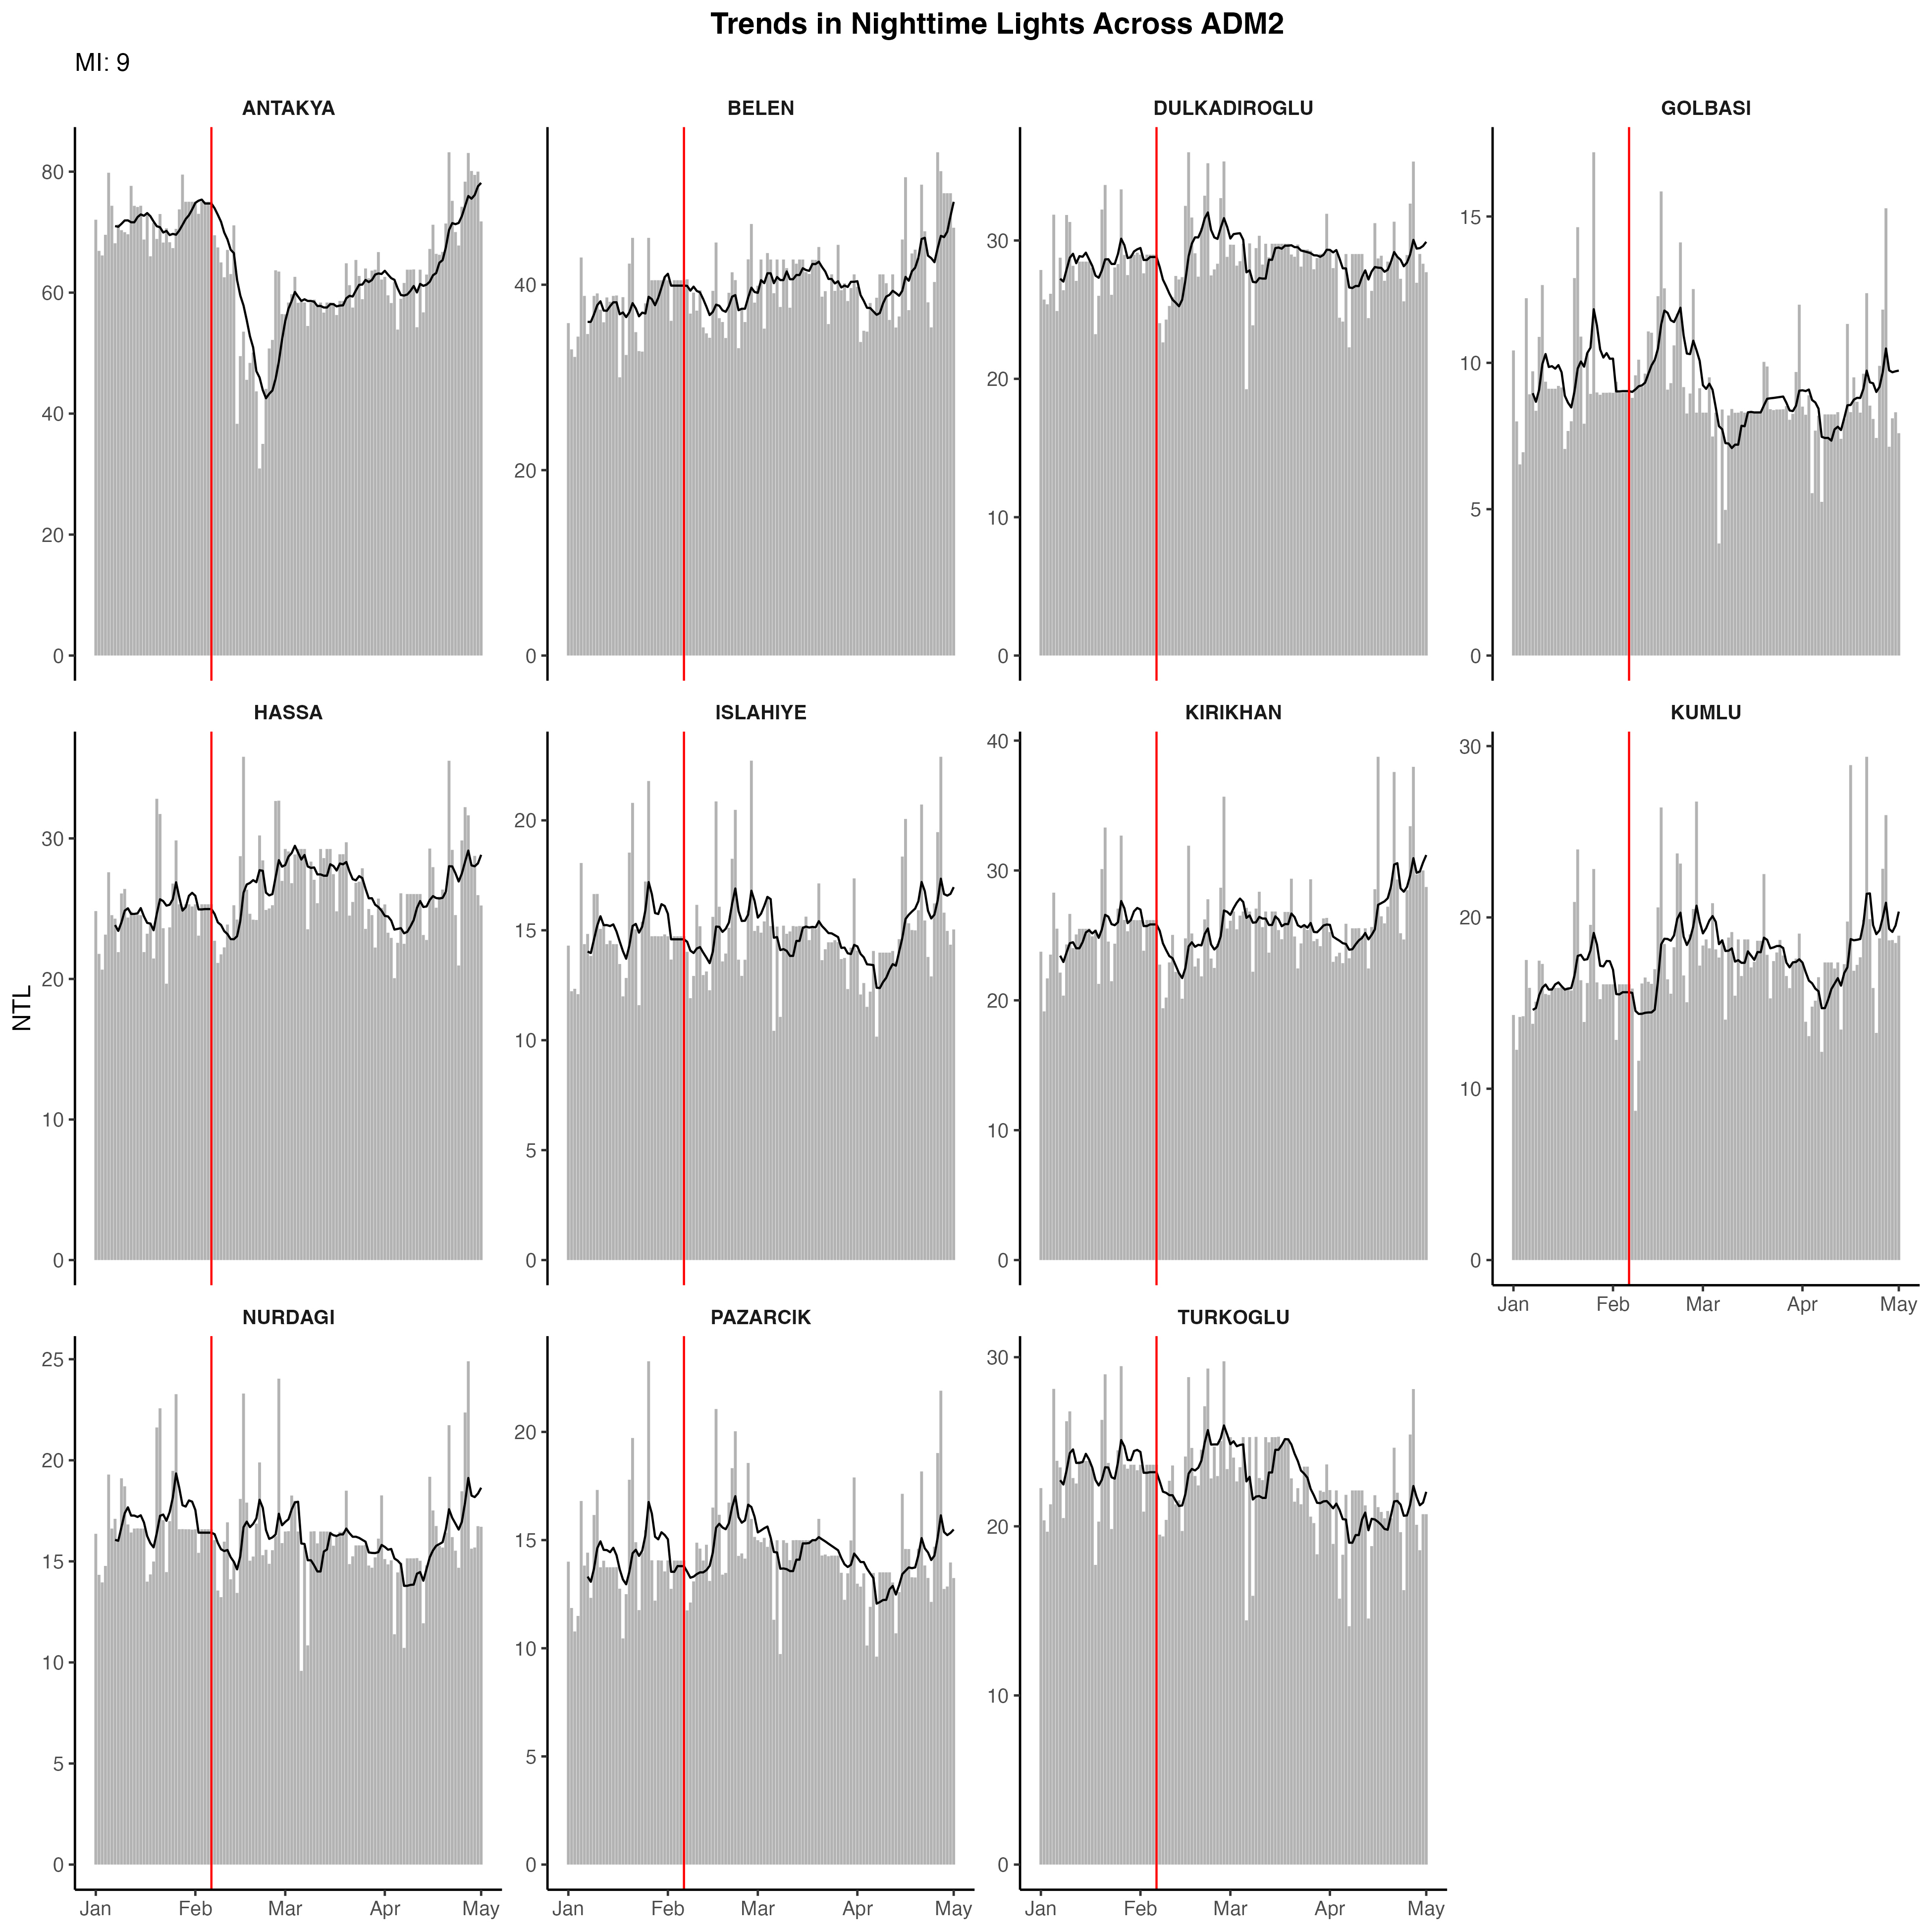
Fig. 14 Trends in nighttime lights for administrative units where there was the largest earthquake intensity (a magnitude of 9 or higher)#
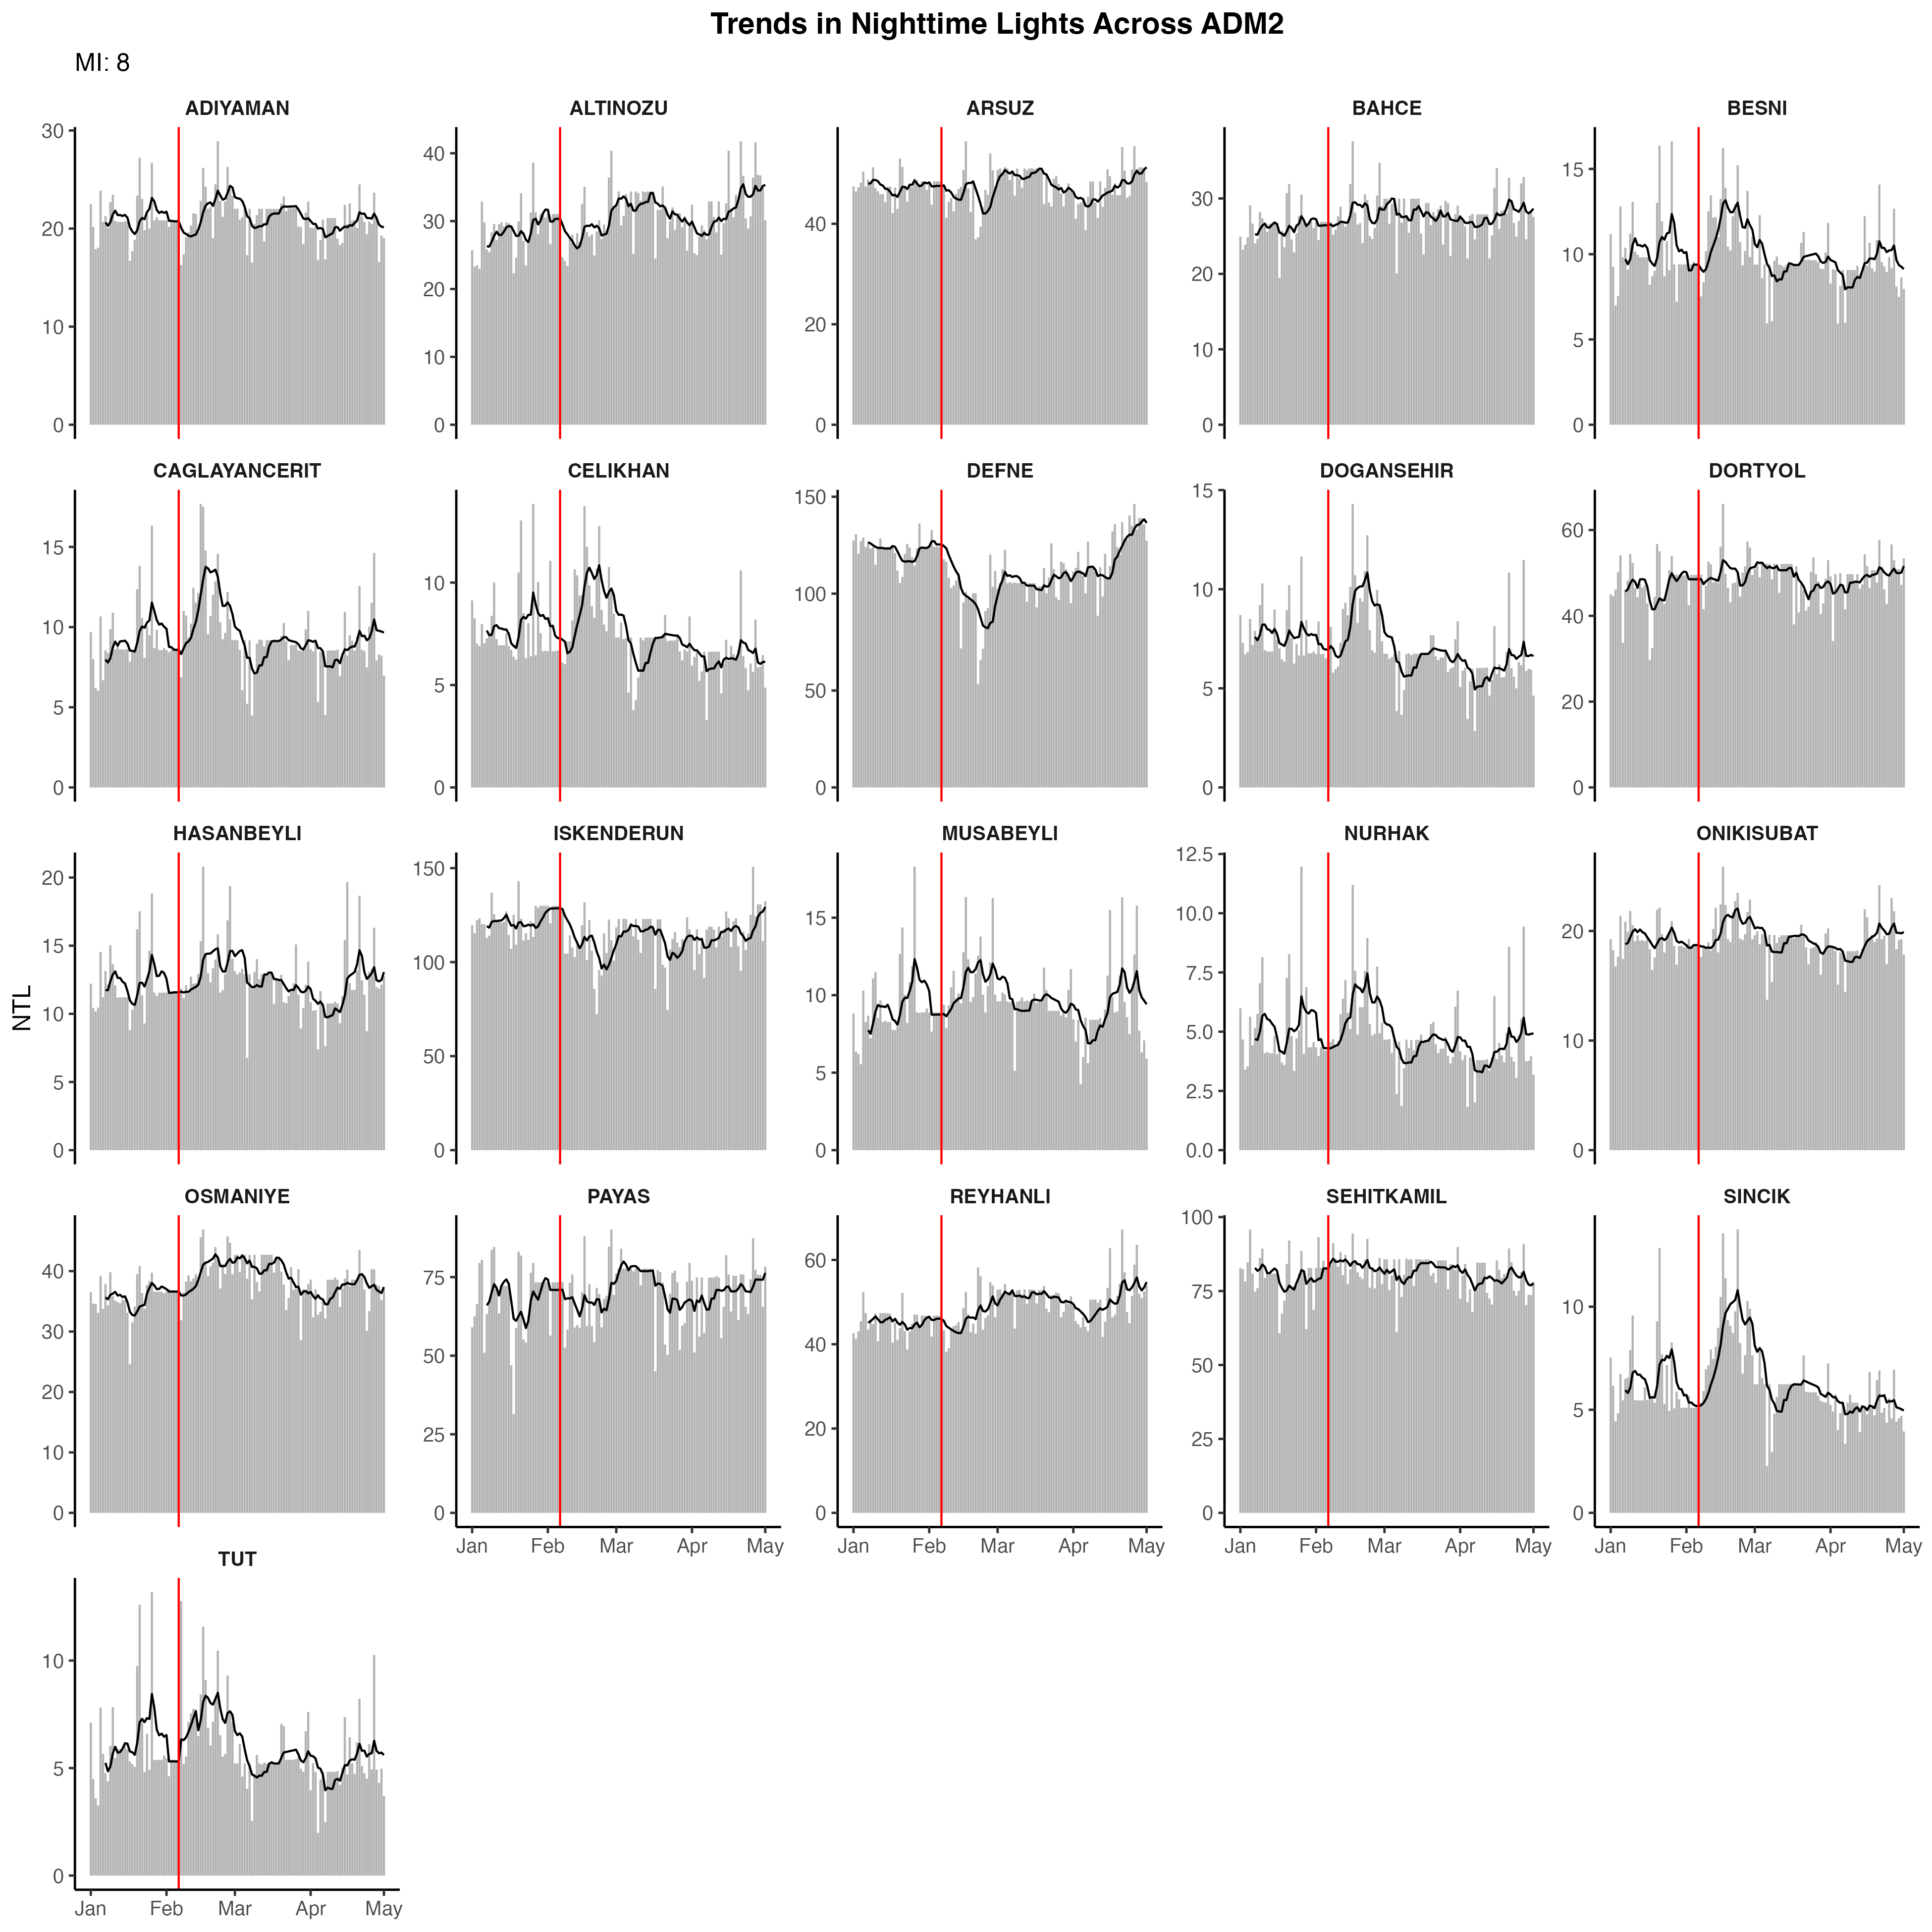
Fig. 15 Trends in nighttime lights for administrative units where there was the an earthquake magnitude of 8#
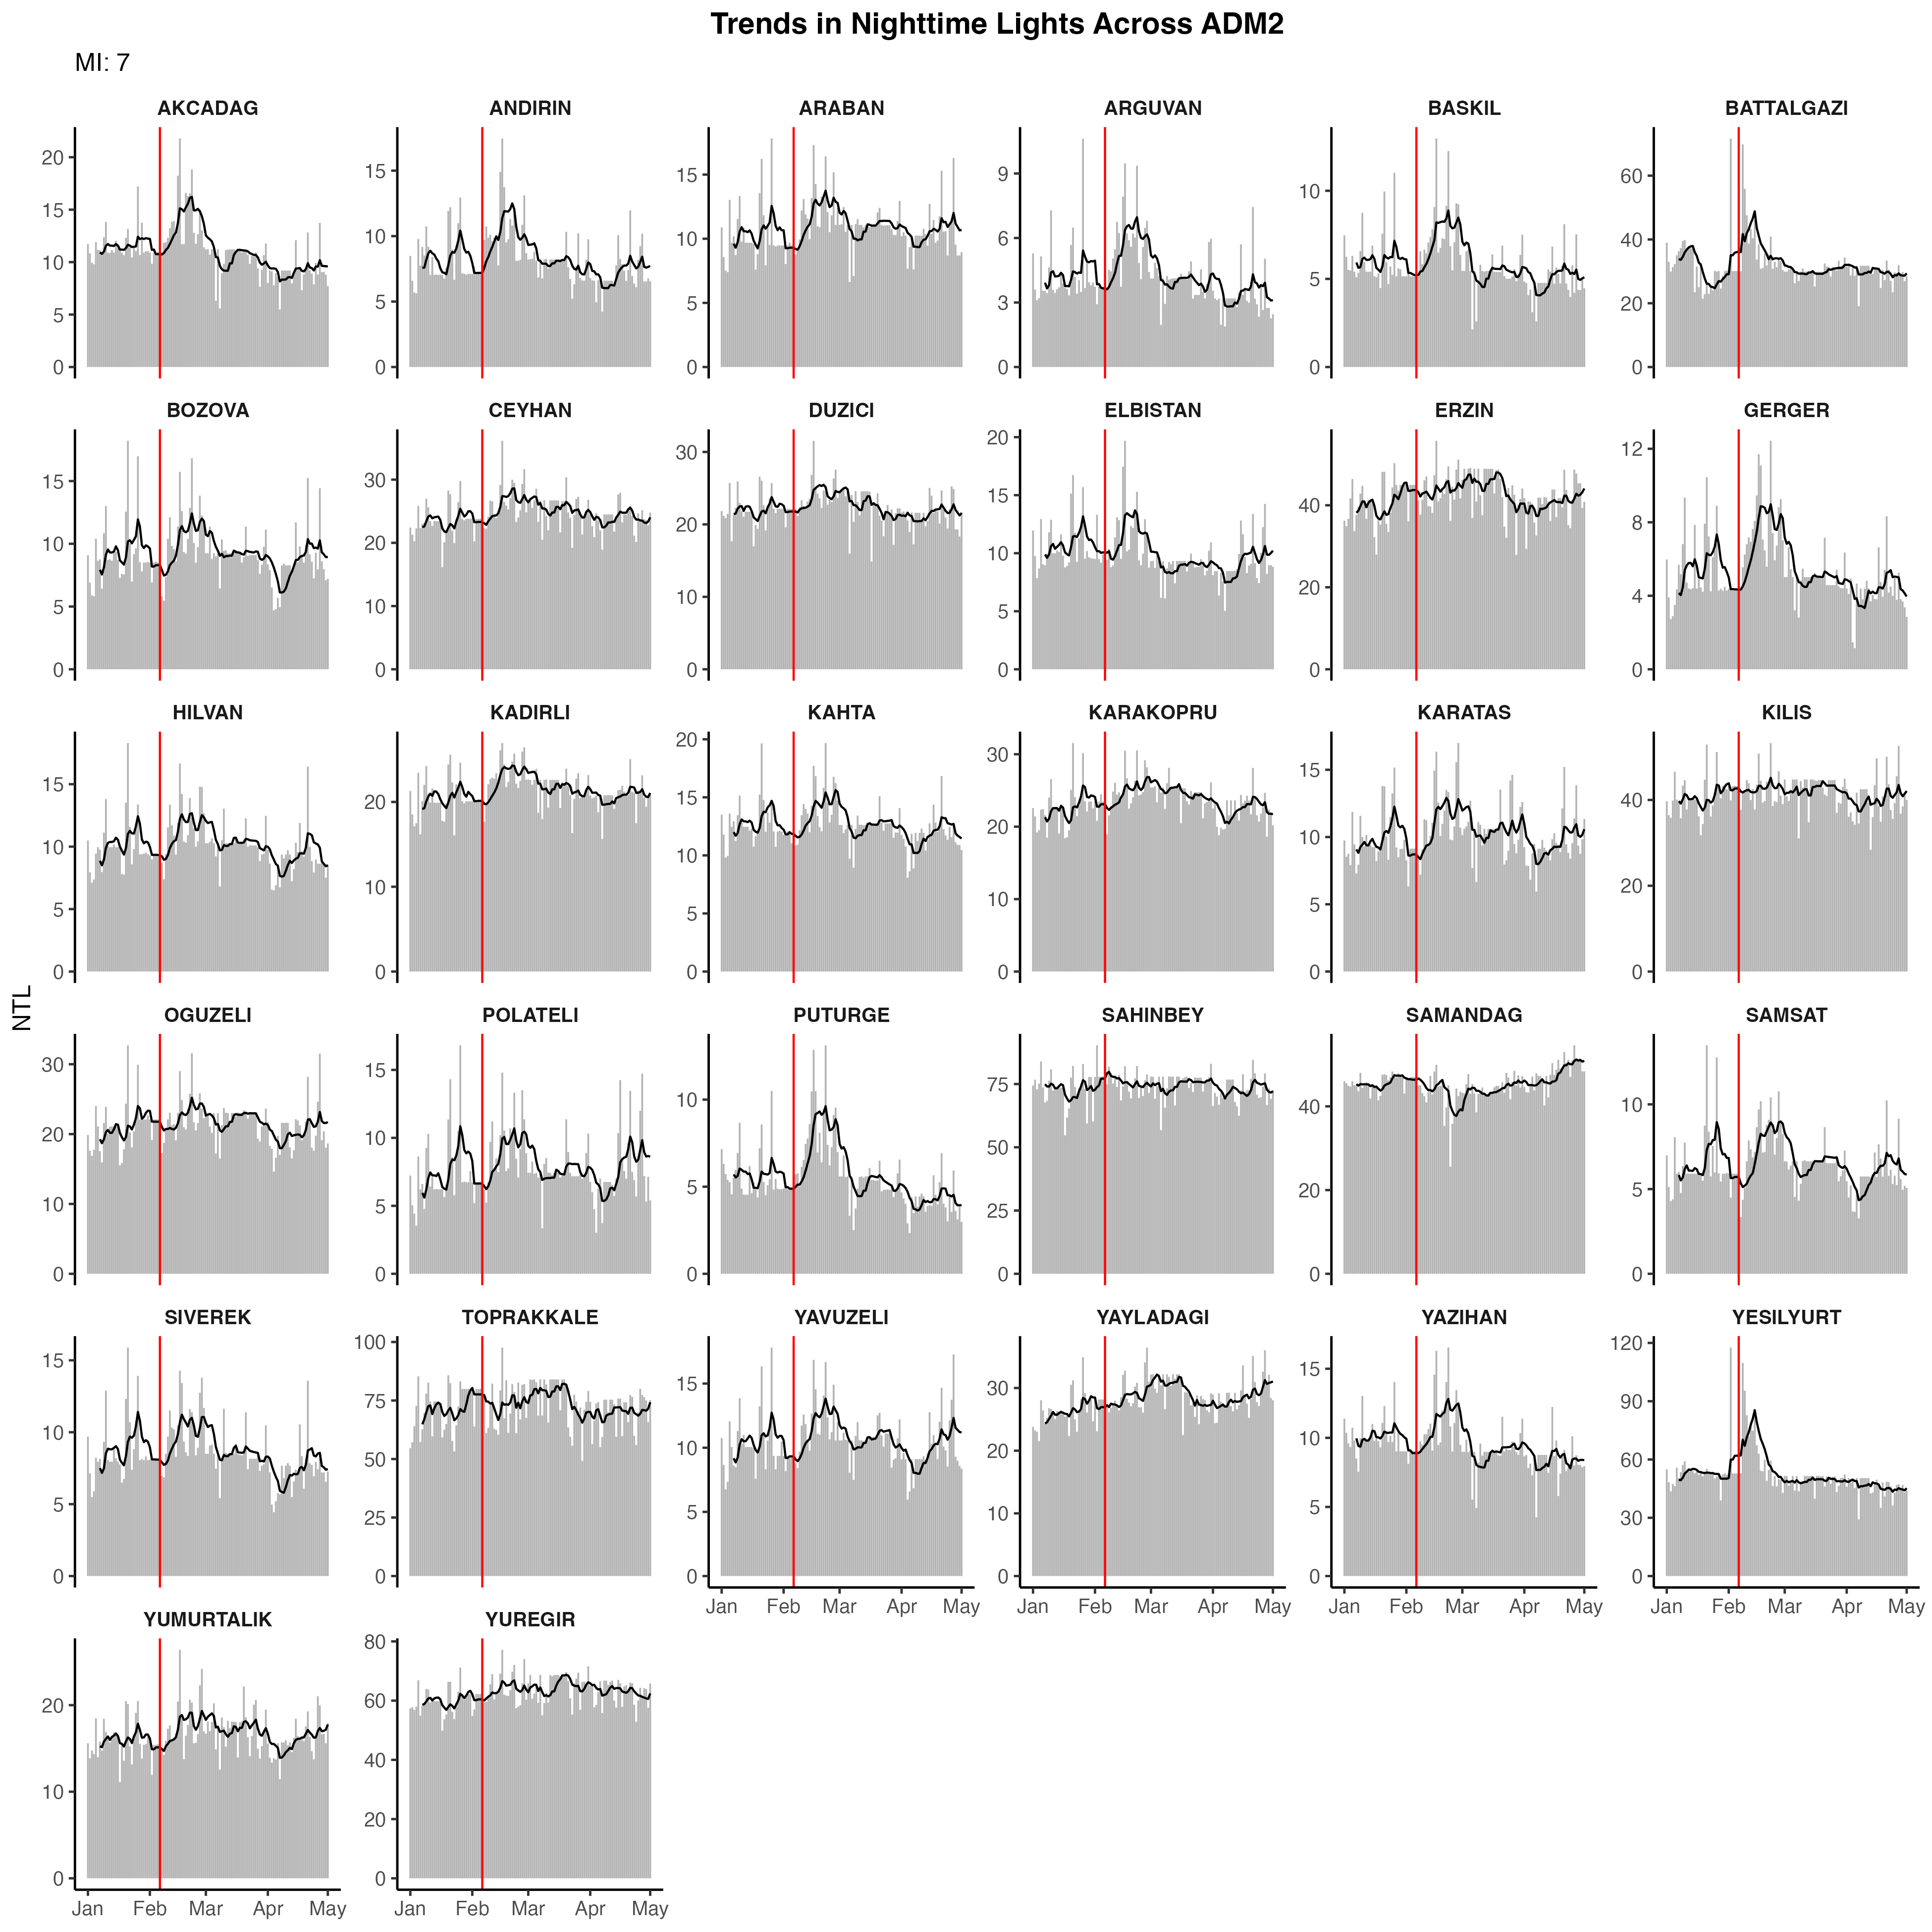
Fig. 16 Trends in nighttime lights for administrative units where there was the an earthquake magnitude of 7#
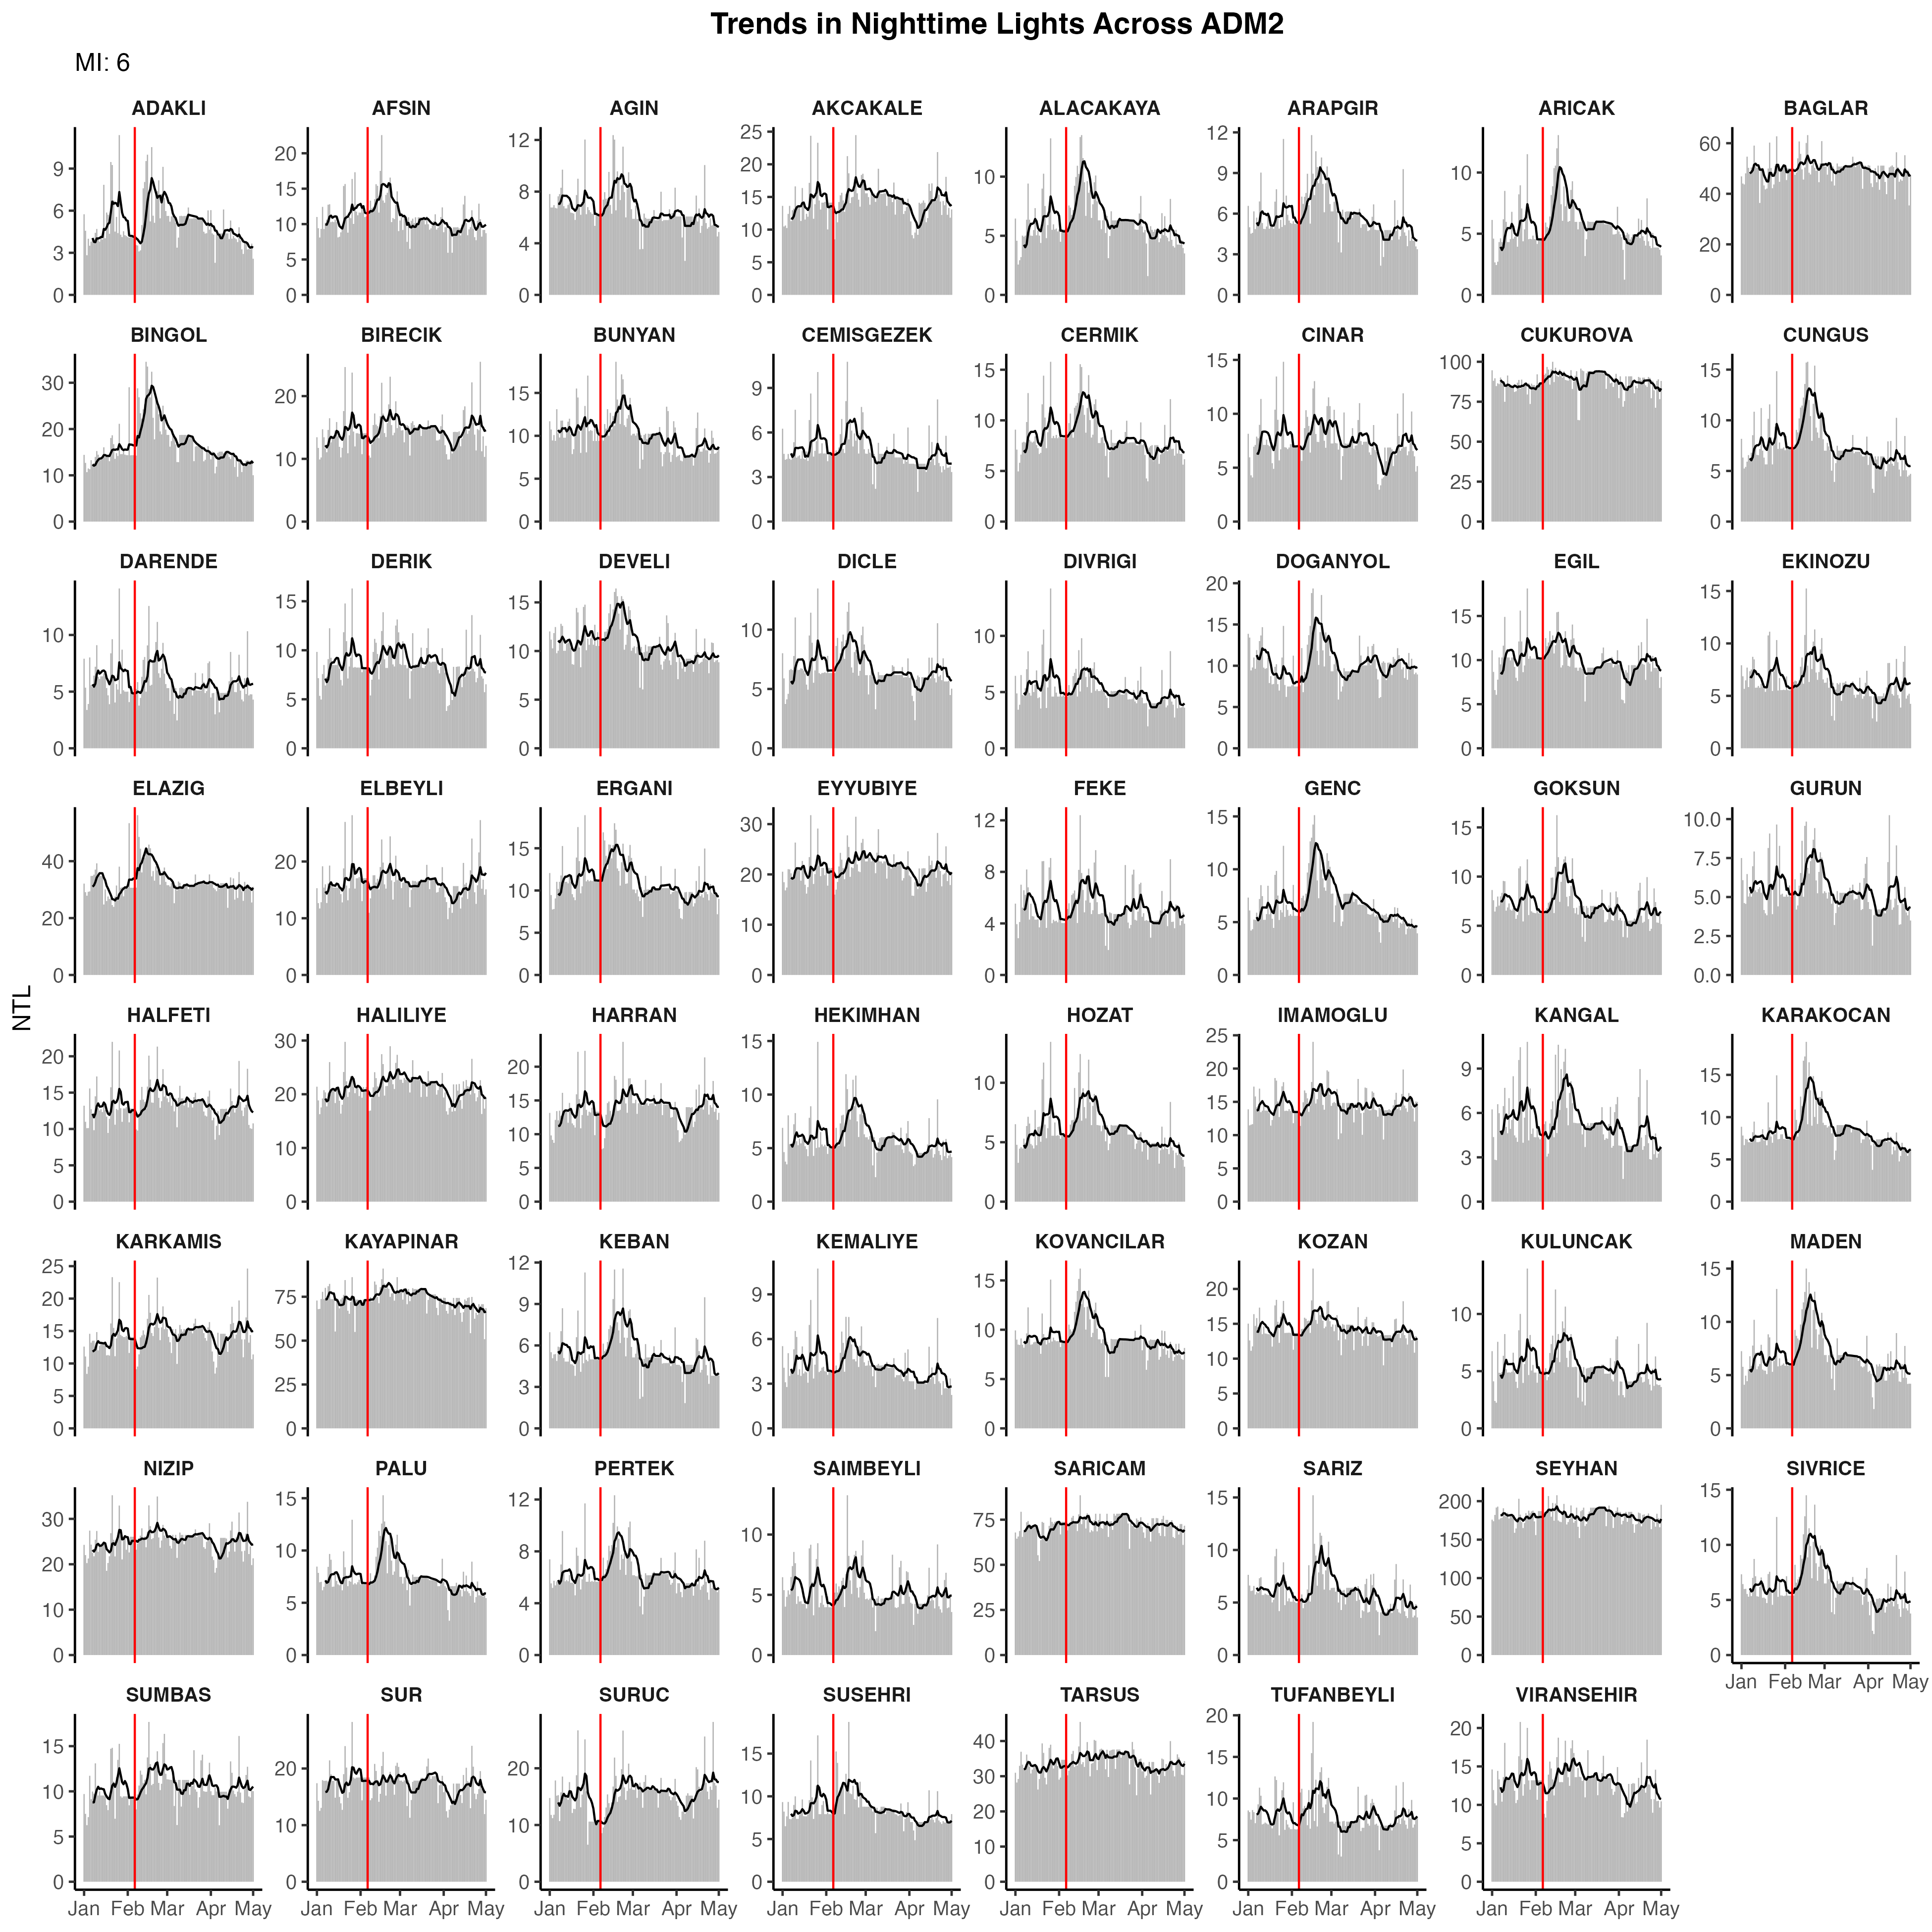
Fig. 17 Trends in nighttime lights for administrative units where there was the an earthquake magnitude of 6#
Limitations#
Nighttime lights are a common data source for measuring local economic activity. However, it is a proxy that is strongly—although imperfectly—correlated with measures of interest, such as population, local GDP, and wealth. Consequently, care must be taken in interpreting reasons for changes in lights.
Caution should also be taken when making conclusions of earthquake impacts based on nighttime lights. Changes in nighttime lights could be driven by multiple factors—such as rescue efforts generating lights, to damages and people leaving high-hit areas causing a reduction in nighttime lights.
Next Steps#
Next steps can focus on continuing to monitor trends in nighttime lights over time. In particular, it will be useful to examine changes in nighttime lights in the weeks and months after the earthquake—when rescue efforts and the lights they generated are done. Consequently, any persistent changes in nighttime lights observed in the weeks and months after the earthquake would be indicative of damages or people moving away. Analysis of data from other sources could shed insight to whether any reductions in nighttime lights are due to damanges or people moving awawy.