Analysing business activity trends in Turkiye#
Business Activity Trends are a crisis-triggered dataset released by Meta. The dataset is relesed at a GADM admin 2 level. GADM shpefiles are slightly different from the official shapefiles used in this project from HdX, UNOCHA. Two Business Activity Trends datasets are used in this analysis - COVID-19 triggered dataset and Turkiye Earthquake triggered dataset.
This notebook shows the implementation of
Visualizing a baseline of Business Activity one year prior to the earthquake (February 2022)
Visualizing changes in trends in Business Actviity after the earthquake by admin region and business vertical
Observing Business Activity Trends#
The Business Activity from two datasets is obtained to compare this year’s chnge in activity to last year - COVID-19 triggered dataset (2022) and erthquake triggered datset (2023).
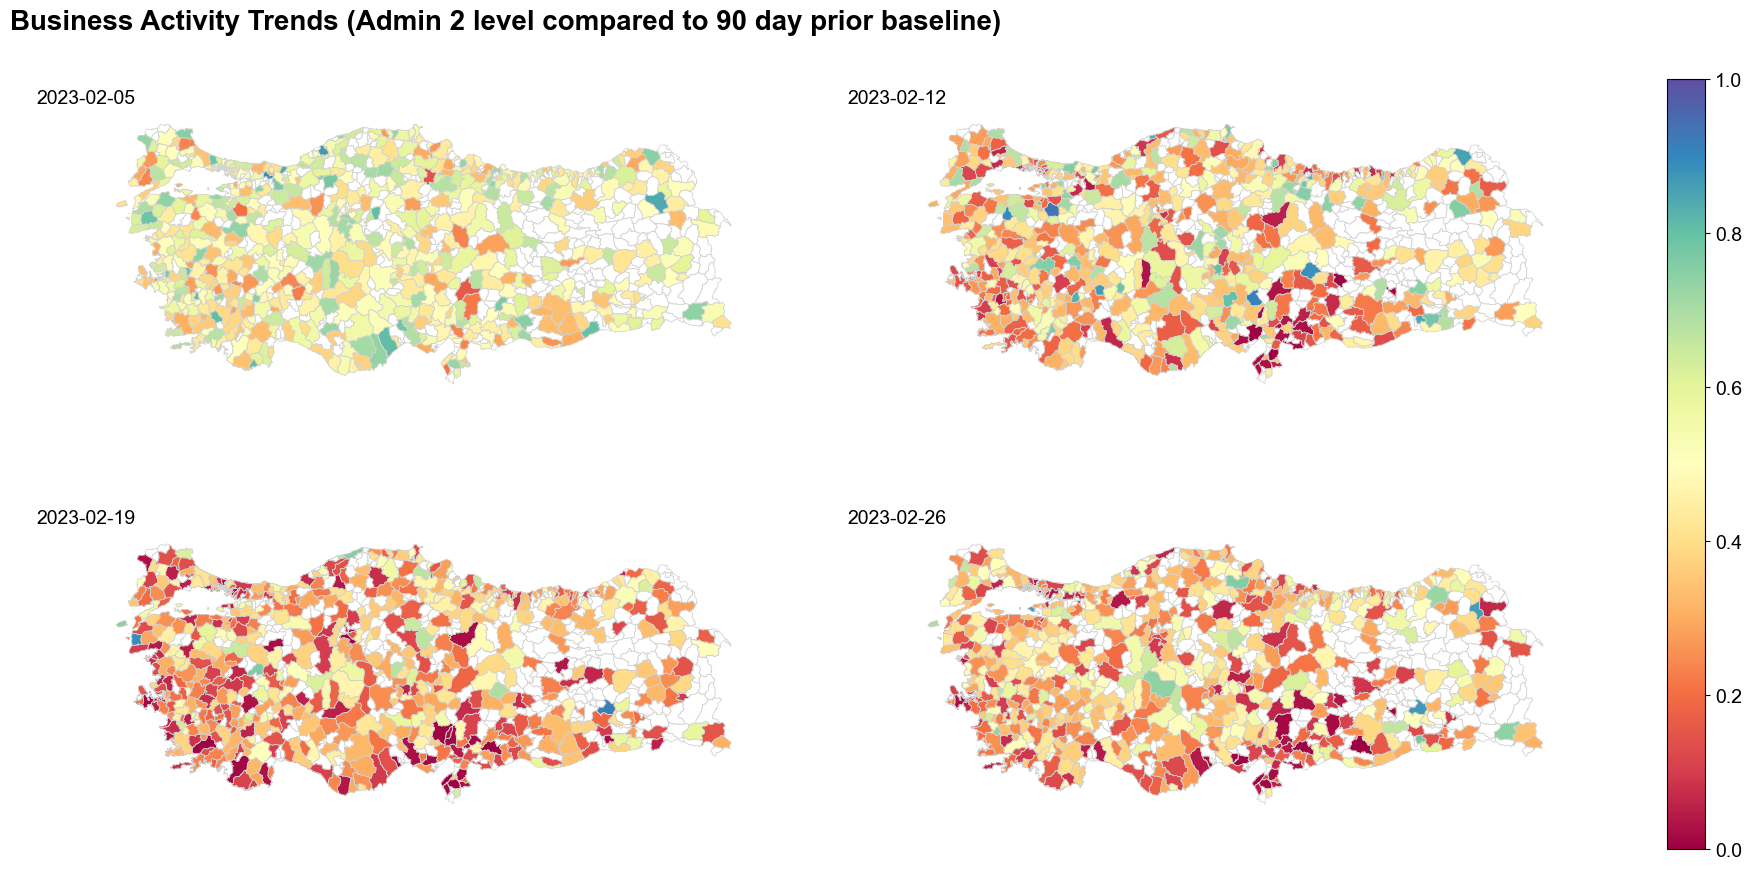
Earthquake triggered business activity dataset#
The Earthquake triggered Business Activity Trends dataset contains daily data from 5th Februaary, 2023 likely till May 2023. This is done at the GADM 2 level. The activity quantile metric is used to measure changes in Business Activity.
Activity quantile (activity_quantile): The level of activity as a quantile relative to the baseline period. This is equivalent to the 7-day average of what the University of Bristol researchers call the aggregated probability integral transform metric (see this article in Nature Communications). It’s calculated by first computing the approximate quantiles (the midquantiles in the article) of each Page’s daily activity relative to their baseline activity. The quantiles are summed and the sum is then shifted, rescaled and variance-adjusted to follow a standard normal distribution. The adjusted sum is then probability transformed through a standard normal cumulative distribution function to get a value between 0 and 1. We then average this value over the last 7 days to smooth out daily fluctuations. We give this metric a quantile interpretation since it compares the daily activity to the distribution of daily activity within the baseline period, where a value around 0.5 is considered normal activity. This is a one-vote-per-Page metric that gives equal weight to all businesses and is not heavily influenced by businesses that post a lot. It is adviced to use this metric, especially if robustness to outliers and numerical stability are important concerns.
COVID-19 triggered business activity dataset#
The COVID-19 triggered Business Activity Trends dataset contains daily data from March 1, 2020 to Nov 29, 2022 at the national level. Activity quantile is used to measure the business activity trends in this dataset as well.
Difference between COVID-19 Business Activity Trends dataset and the Earthquake triggered Business Activity trends dataset#
The difference between then All Business Vertical in the COVID-19 Business Activity Trends dataset and the Earthquake triggered Business Activity trends dataset is that the latter does not include Public Good. The rest of the business activities remain the same across the two datasets (detaled descriptions in the previous page). Another difference is that the baseline value earthquake triggered dataset is a 90 day prior value. For the COVID-19 Business Activity Trends it is 1st March, 2019.
Business Activity Trends has 575 districts and the boundaries map from UNOCHA contains 948 districts. 373 districts do not have data
['MERKEZ']
The above districts remain unmapped. Note: Merkez district unmapped is due to a bug in the GADM data. To account for this, we used the lat long coordinates and joined with the shapefiles being used in this project from UNOCHA
Change in Business Activity by business verticals in affected areas#
Although national average may be useful to compare with baseline data available at the same level from 2022, for the sake of understanding earthquake impact, it might be useful to see the impact of the earthquake on business verticals in the affected regions. For this we get the data for the areas of interest within Turkey,and see how business activity changed in those regions.
We show the data here in two formats -
Daily changes in Business Activity
Weekly changes in Business Activity where the data is aggregated at a week level
There are 75 admin-2 regions which are of interest