Visualizing Standardized Precipitation Index#
Assumptions
Remove all areas where spi is blank
import seaborn as sns
import matplotlib.pyplot as plt

fig, ax = plt.subplots(figsize=(25,6))


p.plot(kind='area', stacked=True, alpha = 0.7, color = hex_color_codes, ax=ax)
ax.set_xlabel('Time', fontsize=14)
ax.set_ylabel('Percentage Area by Class', fontsize = 14)
ax.legend(title='Classes')

fig.suptitle('SPI 6 Month Percentage Area by Month and Class', fontsize=16)

plt.legend(loc='upper center', bbox_to_anchor=(0.5, -0.1), fancybox=False, shadow=False, ncol=9, fontsize=14)
<matplotlib.legend.Legend at 0x189c119a860>
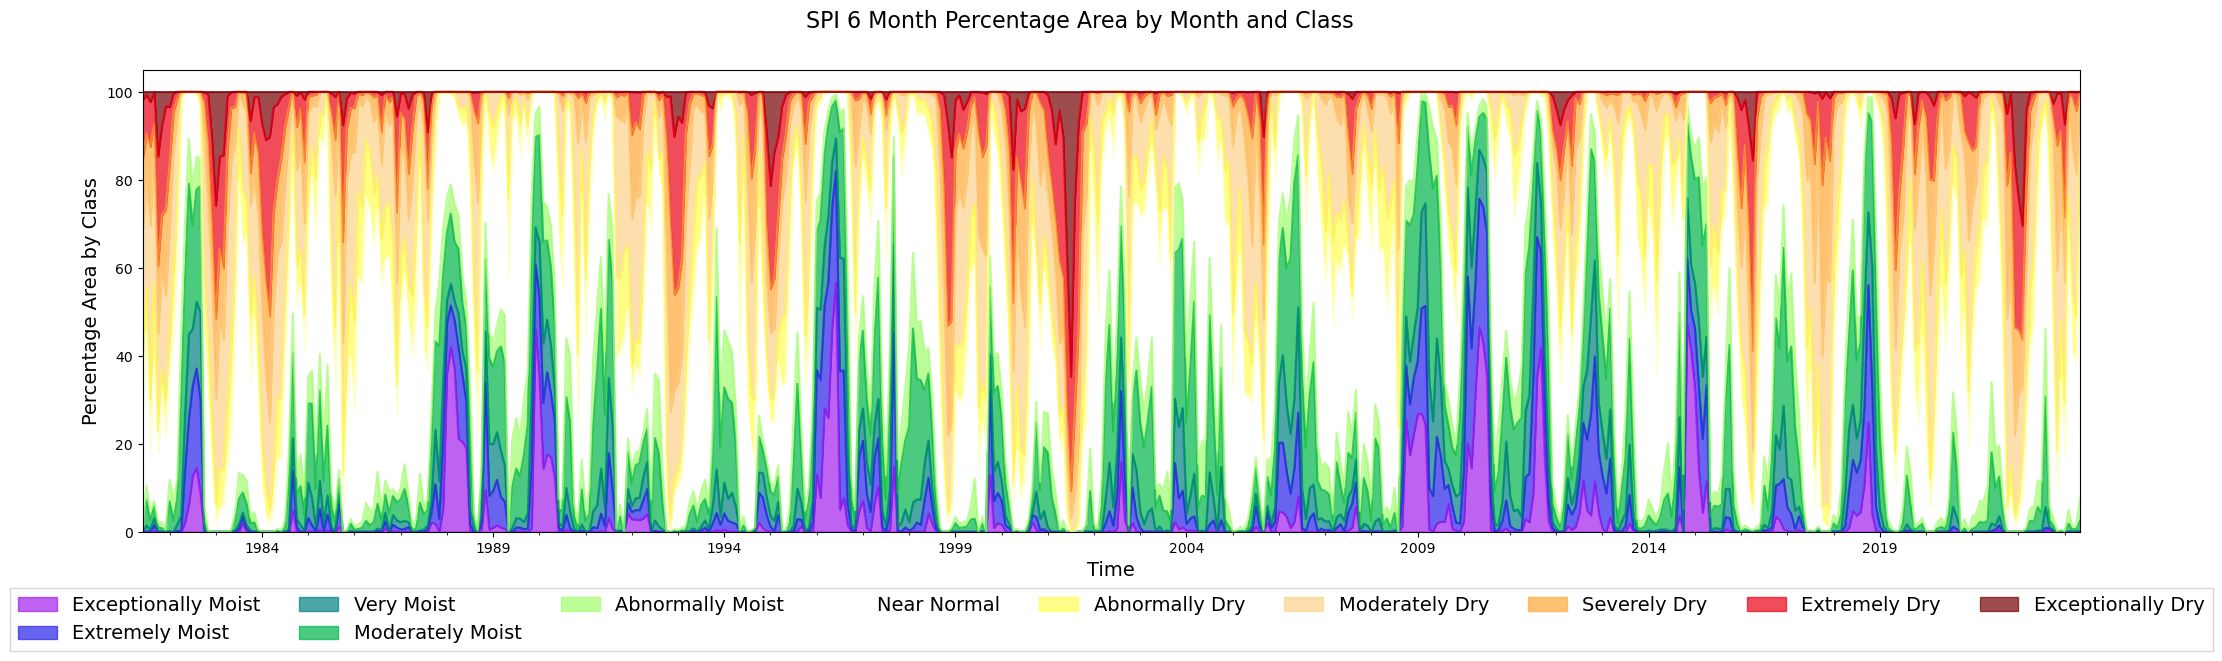
Observations#
The empty spaces are because of null values of SPI
2022, 2016, 2011-2002 were years of drought within Morocco
from matplotlib import rcParams

p = gdf_adm1[['adm1_name', 'time', 'percentage_area', 'class']]

rcParams['font.family'] = 'Georgia'
rcParams['font.sans-serif'] = ['Georgia']

fig, ax = plt.subplots(len(gdf_adm1['adm1_name'].unique()), 1, figsize=(25,70))

for i, adm in enumerate(gdf_adm1['adm1_name'].unique()):
    p1 = p[p['adm1_name']==adm]
    p1 = p1.reset_index().set_index('time')[['class', 'percentage_area']].pivot_table(columns ='class', values='percentage_area', index = 'time')
    p1 = p1 [[
     'Exceptionally Moist', 'Extremely Moist','Very Moist', 'Moderately Moist',
    'Abnormally Moist', 'Near Normal', 'Abnormally Dry', 'Moderately Dry',
    'Severely Dry', 'Extremely Dry', 'Exceptionally Dry']]

    p1.plot(kind='area', stacked=True, alpha = 0.7, color = hex_color_codes, ax=ax[i], legend = False)
    ax[i].set_xlabel('Time', fontsize=14)
    ax[i].set_ylabel('Percentage Area by Class', fontsize=14)
    #ax[i].legend(title='Categories')
    ax[i].set_title(adm, fontsize=16)

plt.legend(loc='upper center', bbox_to_anchor=(0.5, 12), fancybox=False, shadow=False, ncol=9, fontsize=14)
<matplotlib.legend.Legend at 0x189c47f1d50>
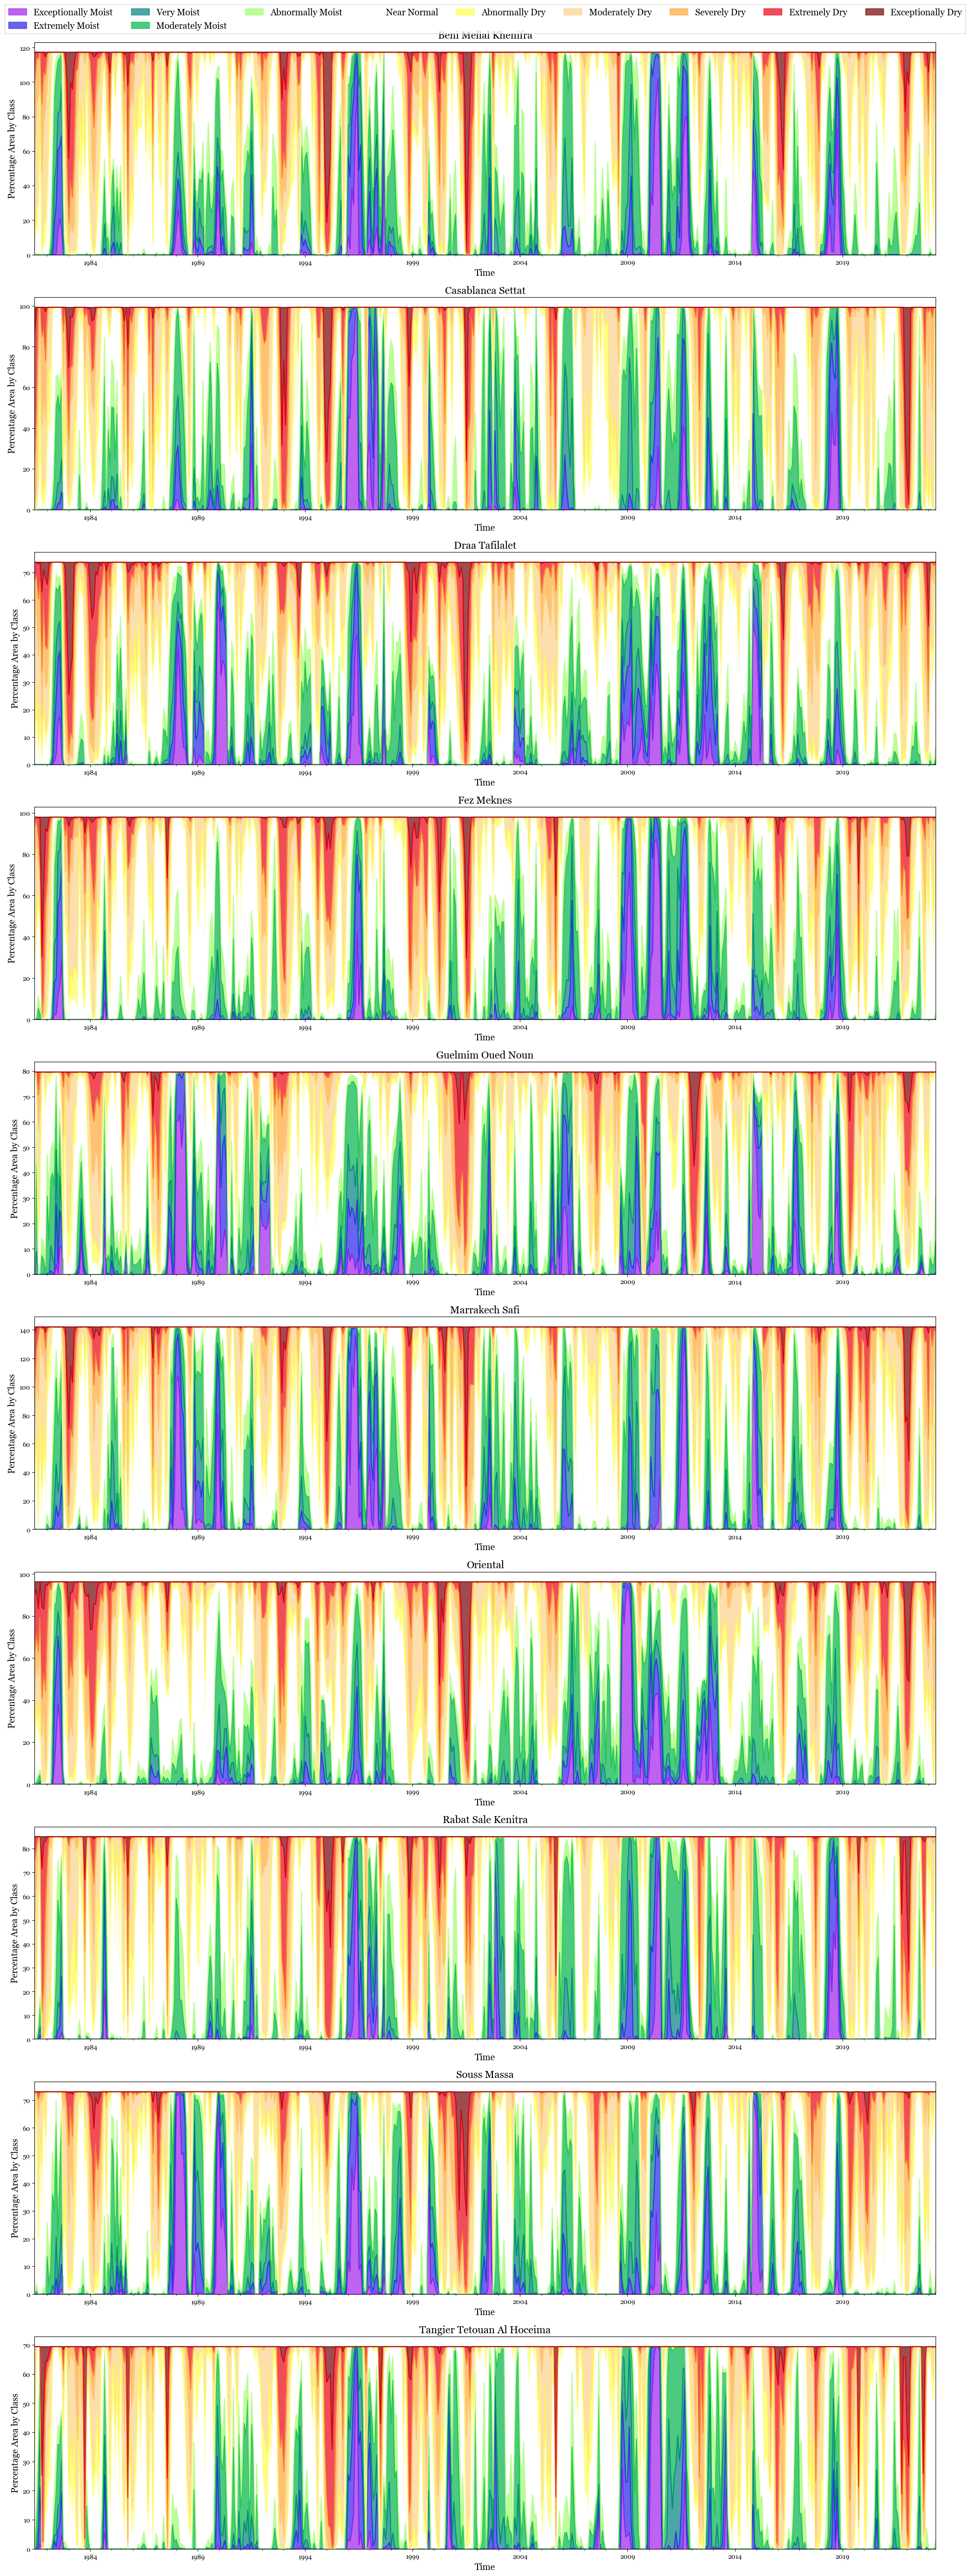
Admin 1 regions in Dry Classes#
Dry Classes constitue of ‘Abnormally Dry’, ‘Extremely Dry’, ‘Severely Dry’, ‘Exceptionally Dry’
Show code cell source
p = gdf_adm1.groupby(['adm1_name', 'class_type', 'time']).sum().reset_index()
p['percentage_area'] = 100*p['class_area']/p['adm_area']
p = p.groupby(['adm1_name', 'class_type', pd.Grouper(key='time', freq='Y')]).max().reset_index()
p = morocco_adm1[['adm1_name', 'geometry']].merge(p)
p = geopandas.GeoDataFrame(p, geometry='geometry')

fig, ax = plt.subplots(4,3, figsize=(10,10), sharex=True, sharey=True)

plots = []
for i, year in enumerate([1981, 2009, 2016, 2022]):
    p1 = p[p['time'].dt.year==year]
    ax[i][0].text(-0.2, 0.5, year, va='center', ha='center', fontsize=12,  transform=ax[i][0].transAxes,)
    for idx, class_type in enumerate(['Dry Classes', 'Moist Classes', 'Normal']):
        p2 = p1[p1['class_type']==class_type]
        plot = p2.plot(column='percentage_area',ax=ax[i][idx], cmap = cmap[idx], vmin=0, vmax=50)
        ax[i][idx].axis('off')
        plots.append(plot)
        ax[0][idx].set_title(class_type)
        #ax[idx][0].set_title(year)


cax = fig.add_axes([0.92, 0.1, 0.02, 0.8])  # Adjust the position as needed
sm = plt.cm.ScalarMappable(cmap='Reds', norm=plt.Normalize(vmin=0, vmax=50))
sm.set_array([])  # Fake empty array for the colorbar
cbar = plt.colorbar(sm, cax=cax, orientation='vertical')
cbar.set_label('Percentage Area')

plt.subplots_adjust(wspace=0.00005, hspace=0.005)

fig.suptitle('Maximum Percentage Area in SPI 6 month Drought Classes in a year by Adm1 Regions')
Text(0.5, 0.98, 'Maximum Percentage Area in SPI 6 month Drought Classes in a year by Adm1 Regions')
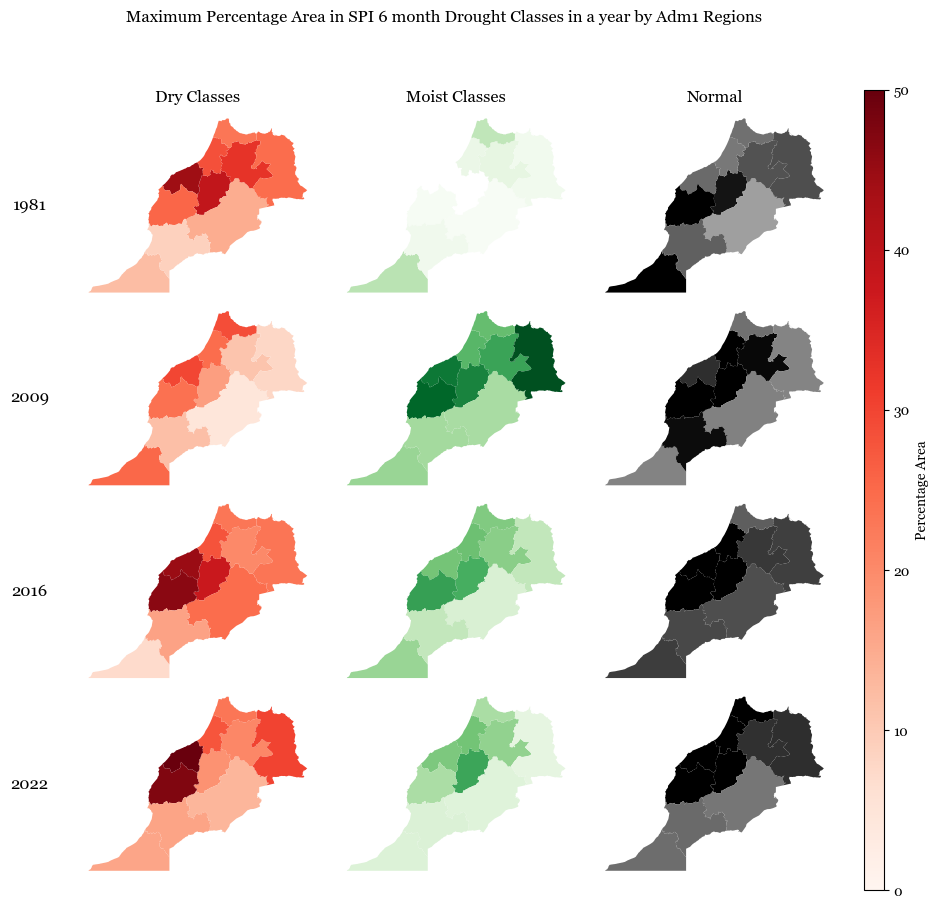
Observations#
The figure shows the maximum percentage area in each year that can be classified as dry, moist or normal based on the SPI classes i.e., it talks about the worst months of drought or rainfall.
2009 was one of the years which was reltively moist
2016 and 2022 were years with high dry conditions after 1981, as also validated by news outlets