Analysing business activity trends in Morocco#
Business Activity Trends are a crisis-triggered dataset released by Meta. The dataset is relesed at a GADM admin 2 level. GADM shapefiles are slightly different from the official shapefiles used in this project from HdX, UNOCHA. One Business Activity Trends datasets is used in this analysis - Morocco Earthquake triggered dataset.
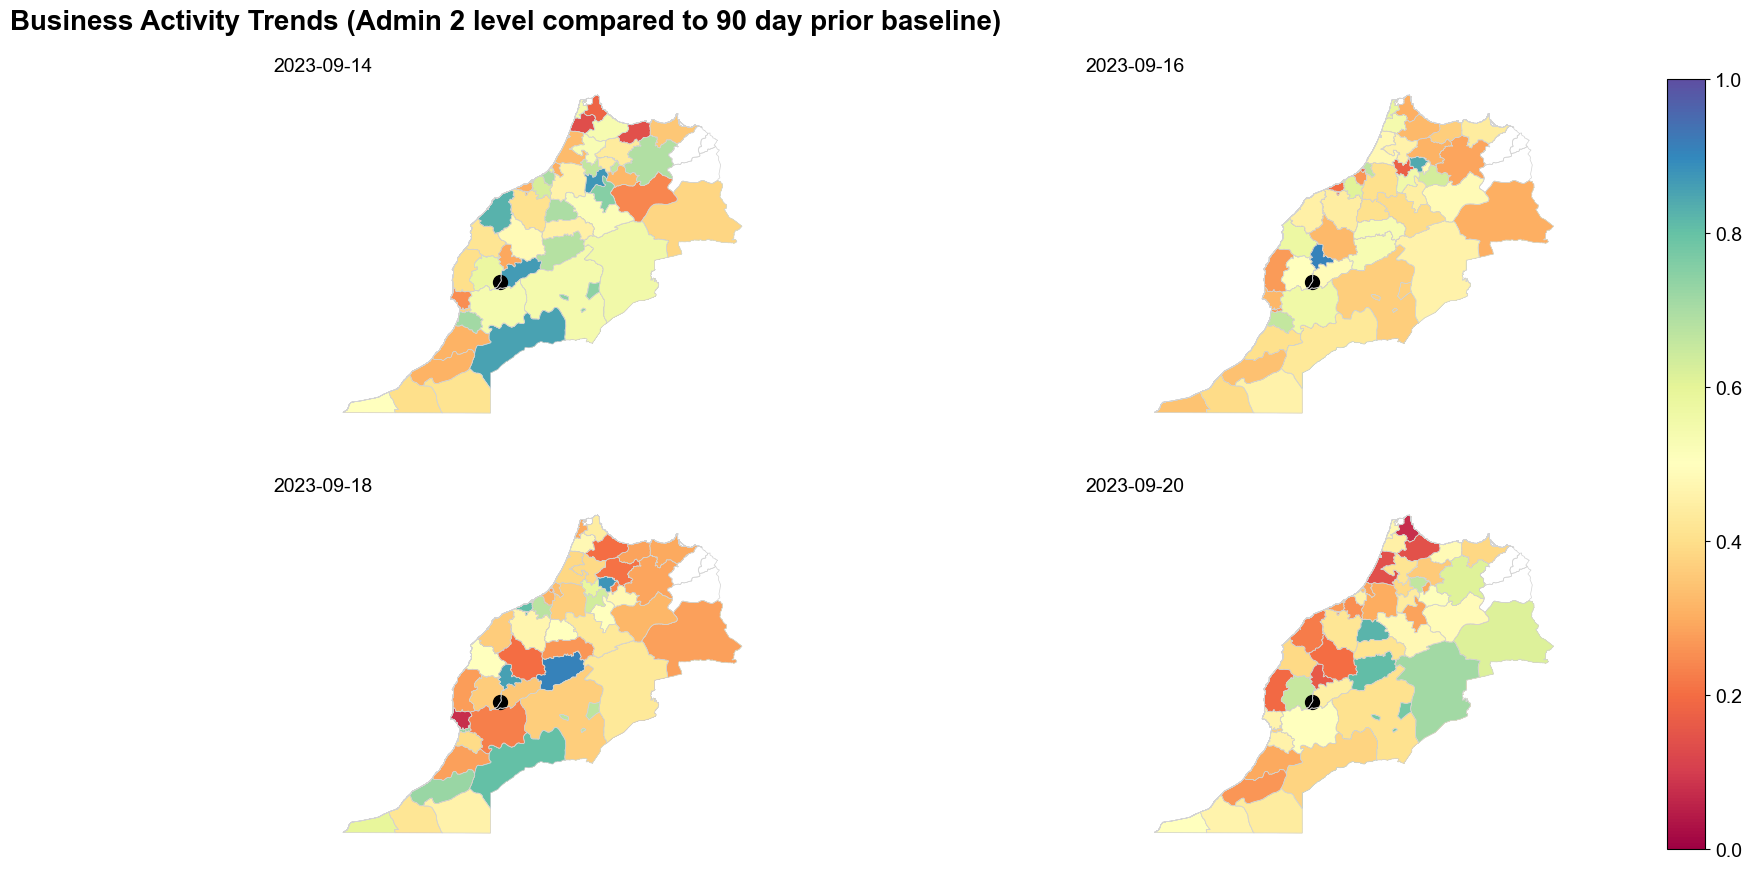
This notebook shows the implementation of
Visualizing changes in trends in Business Actviity after the earthquake by admin region and business vertical
Earthquake triggered business activity dataset#
The Earthquake triggered Business Activity Trends dataset contains daily data from 12th September, 2023. This is done at the GADM 2 level. The activity quantile metric is used to measure changes in Business Activity.
Activity quantile (activity_quantile): The level of activity as a quantile relative to the baseline period. This is equivalent to the 7-day average of what the University of Bristol researchers call the aggregated probability integral transform metric (see this article in Nature Communications). It’s calculated by first computing the approximate quantiles (the midquantiles in the article) of each Page’s daily activity relative to their baseline activity. The quantiles are summed and the sum is then shifted, rescaled and variance-adjusted to follow a standard normal distribution. The adjusted sum is then probability transformed through a standard normal cumulative distribution function to get a value between 0 and 1. We then average this value over the last 7 days to smooth out daily fluctuations. We give this metric a quantile interpretation since it compares the daily activity to the distribution of daily activity within the baseline period, where a value around 0.5 is considered normal activity. This is a one-vote-per-Page metric that gives equal weight to all businesses and is not heavily influenced by businesses that post a lot. It is adviced to use this metric, especially if robustness to outliers and numerical stability are important concerns.
Show code cell source
fig, axs = plt.subplots(2,2,figsize = (24,10), sharex=True, sharey=True)
ax = axs.flatten()


dates_of_interest = ['2023-09-14', '2023-09-16', '2023-09-18', '2023-09-20']
images = []

for i in range(0, len(dates_of_interest)):
    morocco_adm2.boundary.plot(ax=ax[i], edgecolor = '#D3D3D3', linewidth=0.5)
    im=gdf[gdf['ds']==dates_of_interest[i]][['activity_quantile', 'geometry']].plot(column = 'activity_quantile', ax=ax[i], legend = False, cmap = 'Spectral', vmin=0, vmax =1)
    images.append(im.collections[0])
    ax[i].set_title(f'{dates_of_interest[i]}', fontsize = 14, )
    ax[i].title.set_position([0,0])

    ax[i].set_xticks([])
    ax[i].set_yticks([])
    ax[i].spines['top'].set_visible(False)
    ax[i].spines['bottom'].set_visible(False)
    ax[i].spines['right'].set_visible(False)
    ax[i].spines['left'].set_visible(False)

    ax[i].scatter(-8.3815,31.07, c='black', marker='o', s=100)

cbar = fig.colorbar(images[1], ax=axs)
suptitle= fig.suptitle('Business Activity Trends (Admin 2 level compared to 90 day prior baseline)', fontsize = 20, fontweight = 'bold')
suptitle.set_y(0.95)
suptitle.set_x(0.3)
#ax[0].cax = cbar.ax[0]

for im in images:
    im.set_clim(vmin=0, vmax=1)
    im.set_cmap('Spectral')
    im.set_norm(cbar.norm)
Show code cell source
output_notebook()
bokeh.core.validation.silence(EMPTY_LAYOUT, True)
bokeh.core.validation.silence(MISSING_RENDERERS, True)

tabs = []

# Taking the mean activity quantile for the entire country to allow for comparison with last year's data
df = businessActivity2023.groupby(['country', 'business_vertical', 'ds']).mean('activity_quantile').reset_index()

tabs.append(Panel(child=get_line_plot(df, f"Business Activity in 2023", "Source: Data for Good Meta", earthquakes=True, subtitle = 'National average post earthquake compared to 90 day prior baseline')
                  ,title = 'National Average'))

tabs = Tabs(tabs=tabs, sizing_mode="scale_both")
show(tabs, warn_on_missing_glyphs=False)
Marrackech - Tensfit - Al Haouz had the most impact#
Within this admin region, it can be seen that the sector most impacted are Home Services, Manufacturing, Local Events, Professional Services, Public Good and Travel.
Show code cell source
output_notebook()
bokeh.core.validation.silence(EMPTY_LAYOUT, True)
bokeh.core.validation.silence(MISSING_RENDERERS, True)


tabs = []

for adm in morocco_adm1['NAME_1'].unique():
    df = businessActivity2023[businessActivity2023['NAME_1']==adm]
    df = df.groupby(['NAME_1', 'business_vertical', 'ds']).mean('activity_quantile').reset_index()

    tabs.append(
        Panel(
        child=get_line_plot(df, f"Business Activity in Affected Areas", "Source: Data for Good Meta", earthquakes=True, subtitle = 'GADM2 level average post earthquake compared to 90 day prior baseline'),
                    title=adm.capitalize(),
                )
                )

tabs = Tabs(tabs=tabs, sizing_mode="scale_both")
show(tabs, warn_on_missing_glyphs=False)
Change in Business Activity by business verticals in Marrakech - Tensfit - Al Haouz#
One of the most impacted areas is the Marrackech - tensfit - al houz region. Examining the admin 2 regions within this region would paint a picture on the sub regions with high impact
Show code cell source
output_notebook()
bokeh.core.validation.silence(EMPTY_LAYOUT, True)
bokeh.core.validation.silence(MISSING_RENDERERS, True)


tabs = []

for adm in morocco_adm2[morocco_adm2['NAME_1']=='Marrakech - Tensift - Al Haouz']['NAME_2'].unique():
    df = businessActivity2023[businessActivity2023['NAME_2']==adm]
    df = df.groupby(['NAME_2', 'business_vertical', 'ds']).mean('activity_quantile').reset_index()

    tabs.append(
        Panel(
        child=get_line_plot(df, f"Business Activity in Affected Areas", "Source: Data for Good Meta", earthquakes=True, subtitle = 'GADM2 level average post earthquake compared to 90 day prior baseline'),
                    title=adm.capitalize(),
                )
                )

tabs = Tabs(tabs=tabs, sizing_mode="scale_both")
show(tabs, warn_on_missing_glyphs=False)
The Kernel crashed while executing code in the the current cell or a previous cell. Please review the code in the cell(s) to identify a possible cause of the failure. Click <a href='https://aka.ms/vscodeJupyterKernelCrash'>here</a> for more info. View Jupyter <a href='command:jupyter.viewOutput'>log</a> for further details.