Night Time Lights in Morocco#
Nighttime lights have become a commonly used resource to estimate changes in local economic activity. This section shows where nighttime lights are concentrated across Morocco and observed changes over time.
Data#
We use nighttime lights data from VIIRS Black Marble data. Raw nighttime lights data requires correction due to cloud cover and stray light, such as lunar light. Black Marble datasets apply algorithms to correct raw nighttime light values and calibrate data so that trends in lights over time can be meaningfully analyzed.
The raw values of nighttime lights are radiance of lights, and the values themselves are not readily interpretable in an economic context. Nighttime light values should be viewed as an index, with larger values reflecting brighter lights—and more economic activity.
For further information, please refer to foundational_datasets.
Methodology#
We extract nighttime lights at different administrative levels. The following code cleans the data:
Download VIIRS Black Marble data Downloads nighttime light BlackMarble data as raster files.
Aggregate Nighttime Lights to Polygons The code creates analysis-ready code files, in OneDrive in
Data/night-time-lights/aggregated-to-polygons. Data are aggregated to different administrative zones.
The following code produces the figures:
Results#
Map of Nighttime Lights#
The below figure shows maps of nighttime lights in different years. Maps of individual years for all years can be found here.
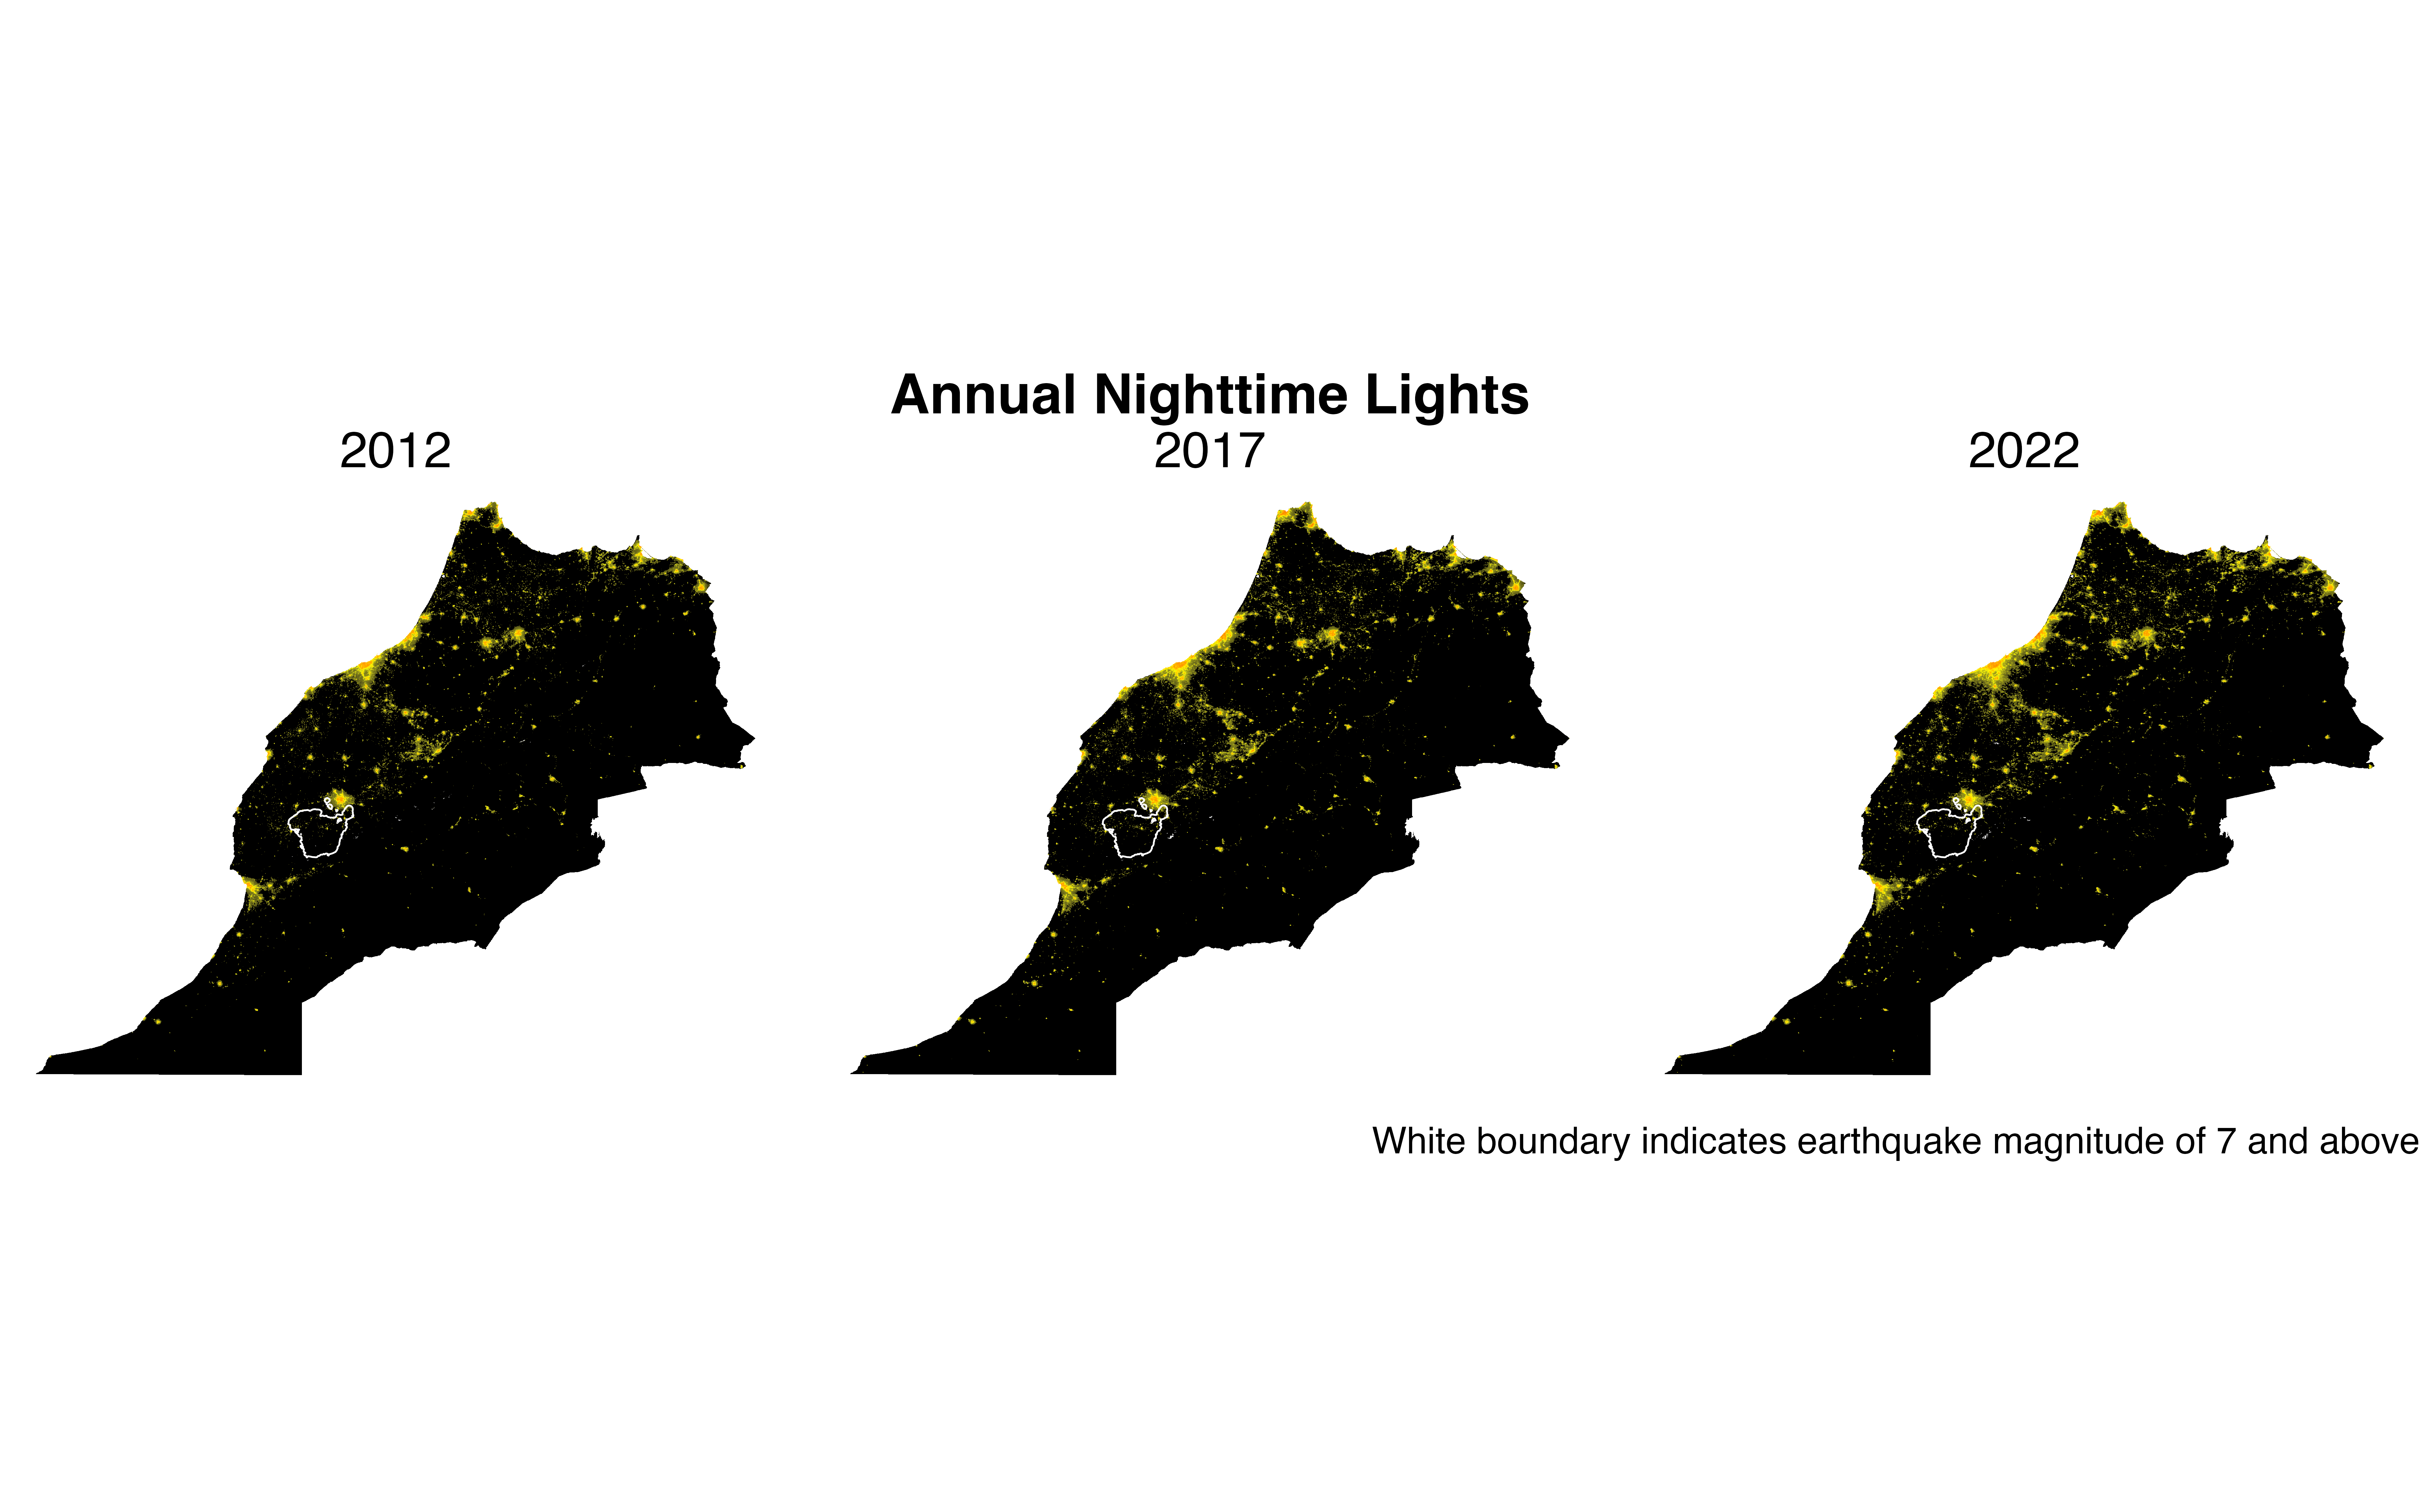
Fig. 1 Map of Nighttime Lights#
Trends in Nighttime Lights: Annual#
The below figures show trends in nighttime lights across the country (top figure) and at the first administrative division level (bottom figure).
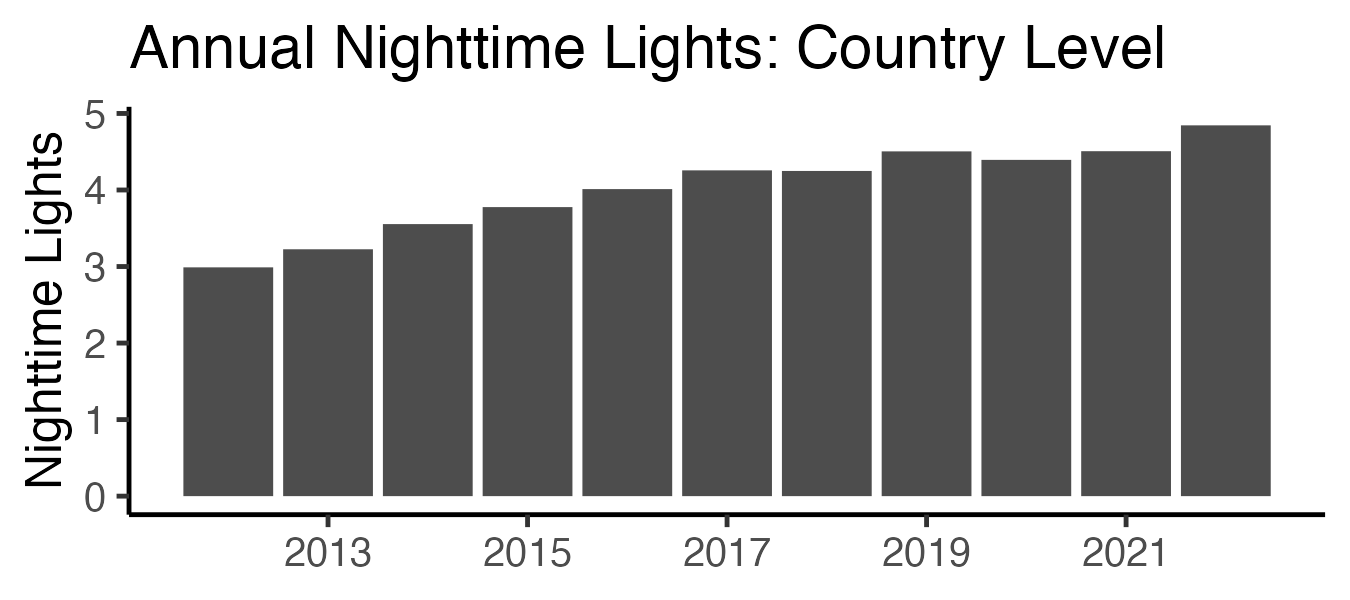
Fig. 2 Annual Trends in Nighttime Lights: Country Level#
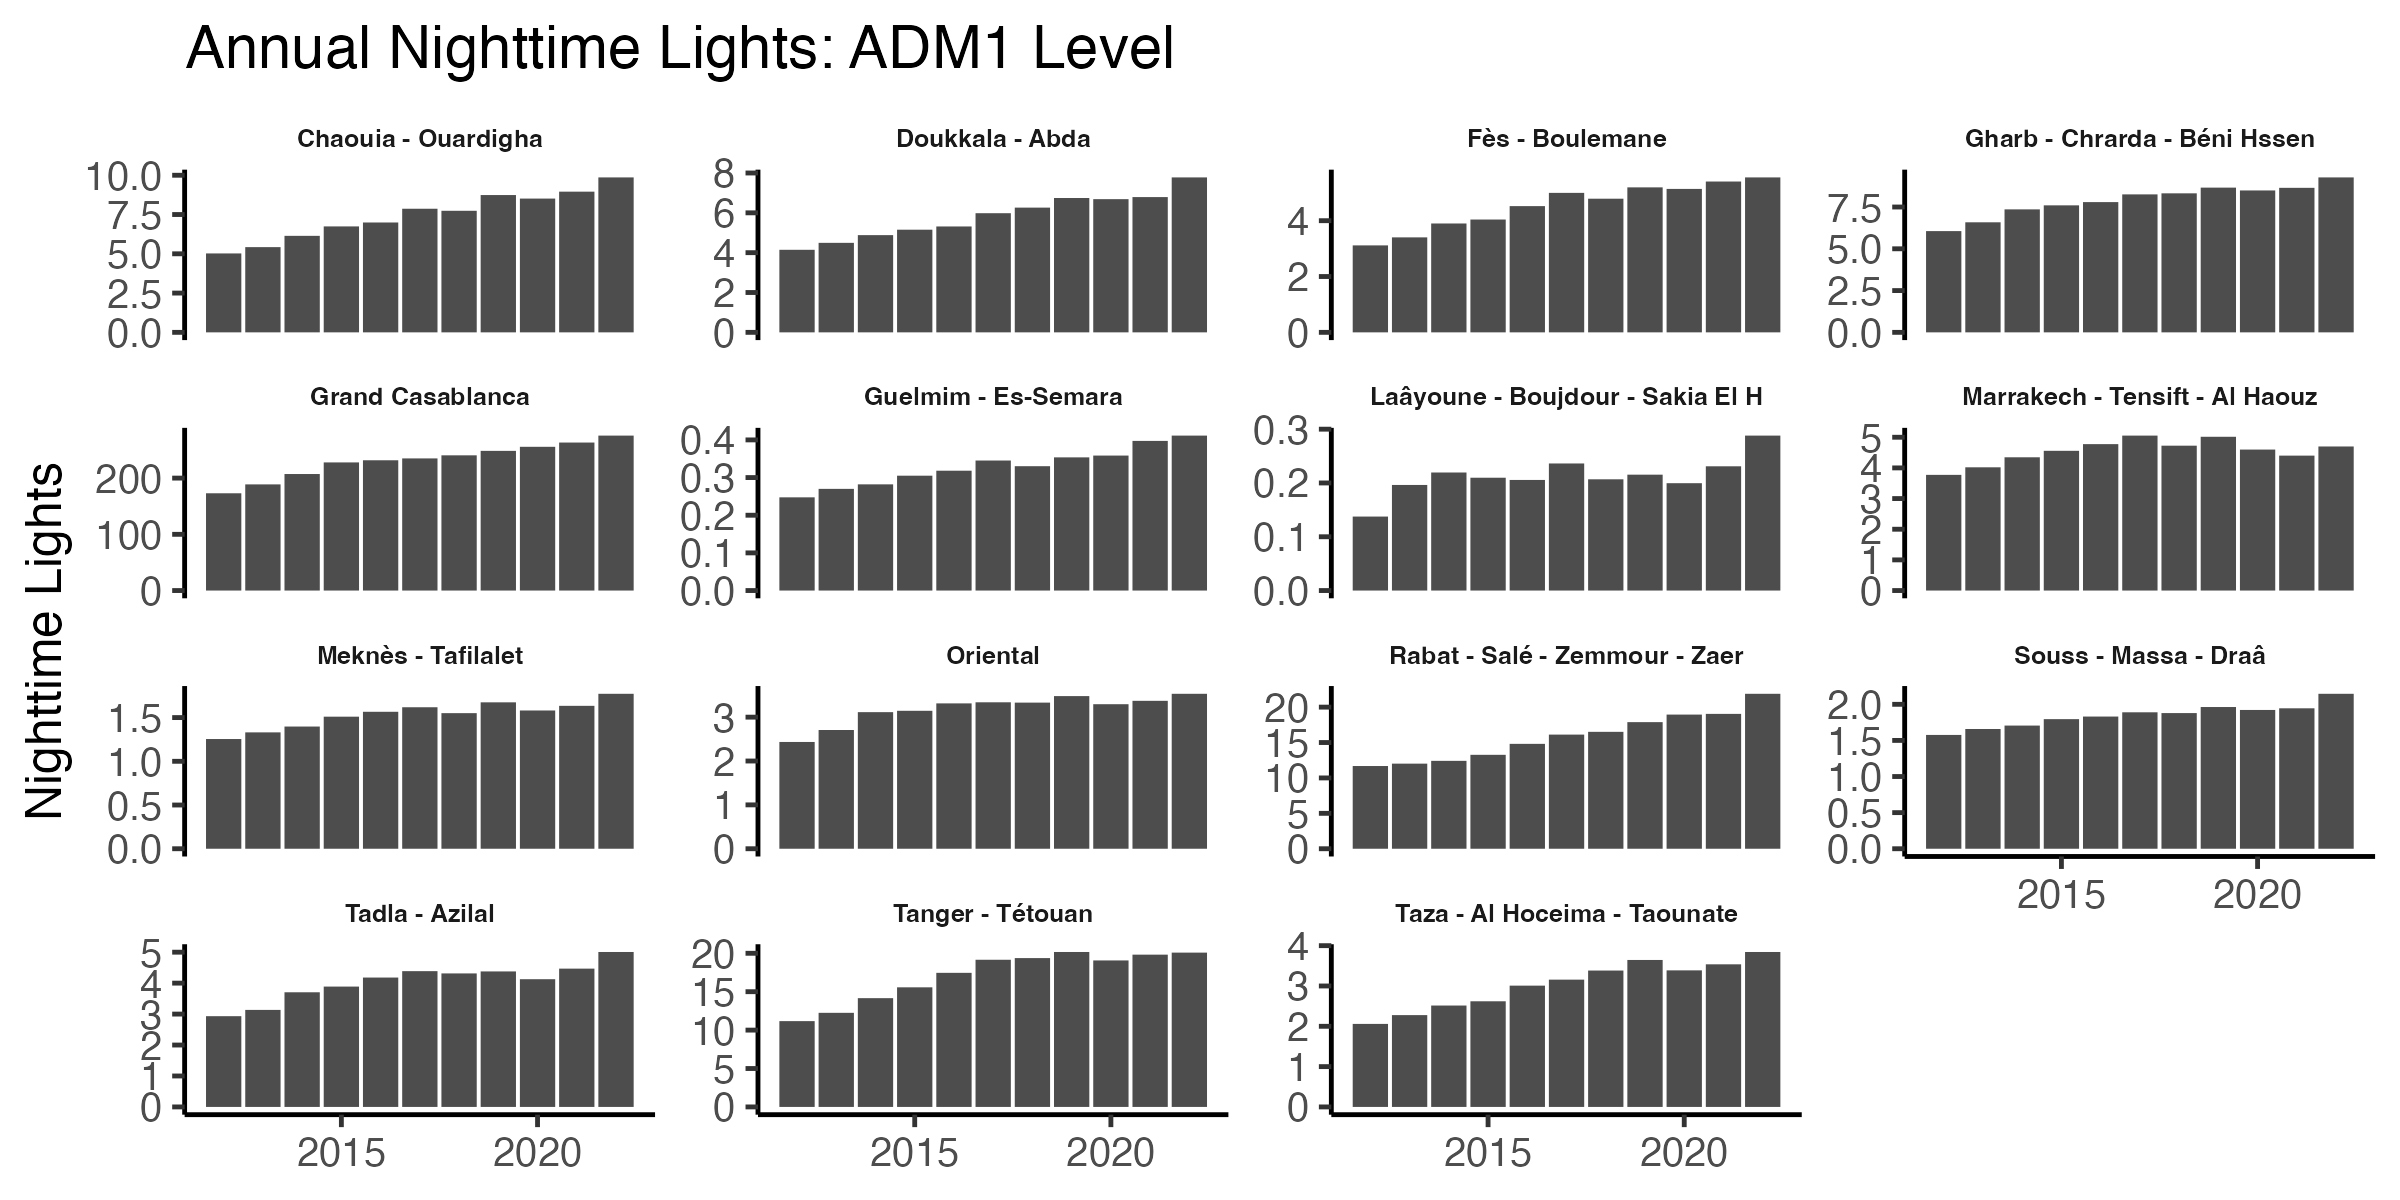
Fig. 3 Annual Trends in Nighttime Lights: ADM 1 Level#
Trends in Nighttime Lights: Daily#
The below figures show trends in nighttime lights across the country, and at the first administrative division level, and within regions by earthquake intensity.
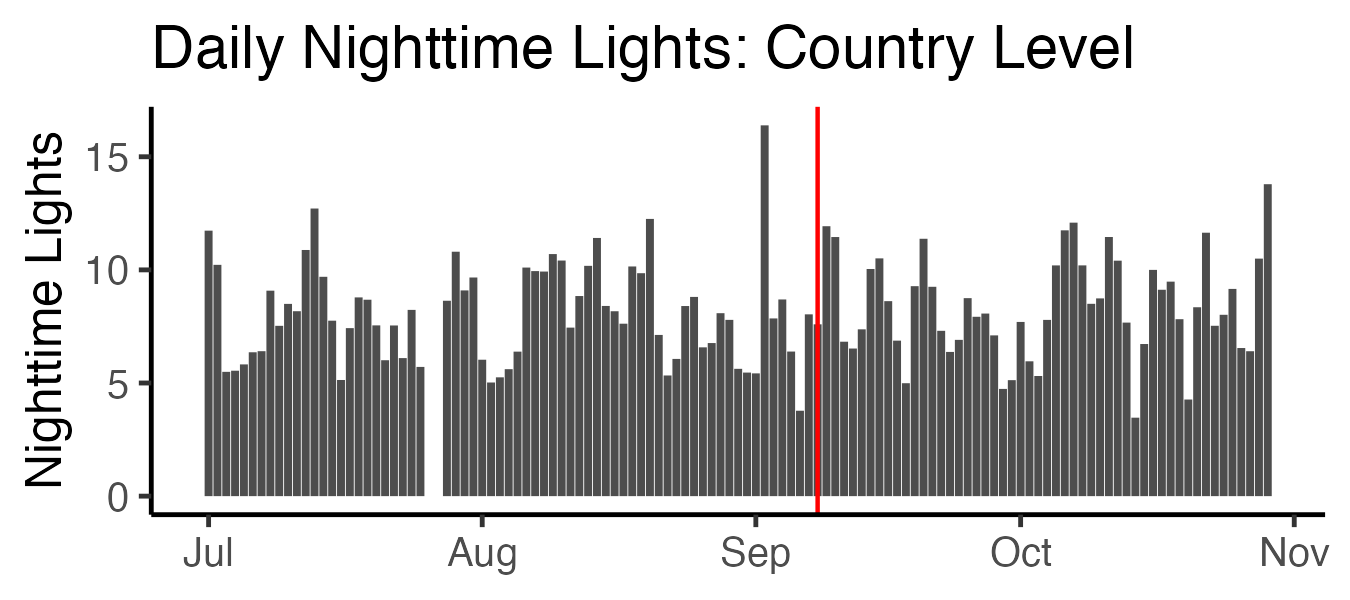
Fig. 4 Daily Trends in Nighttime Lights: Country Level#
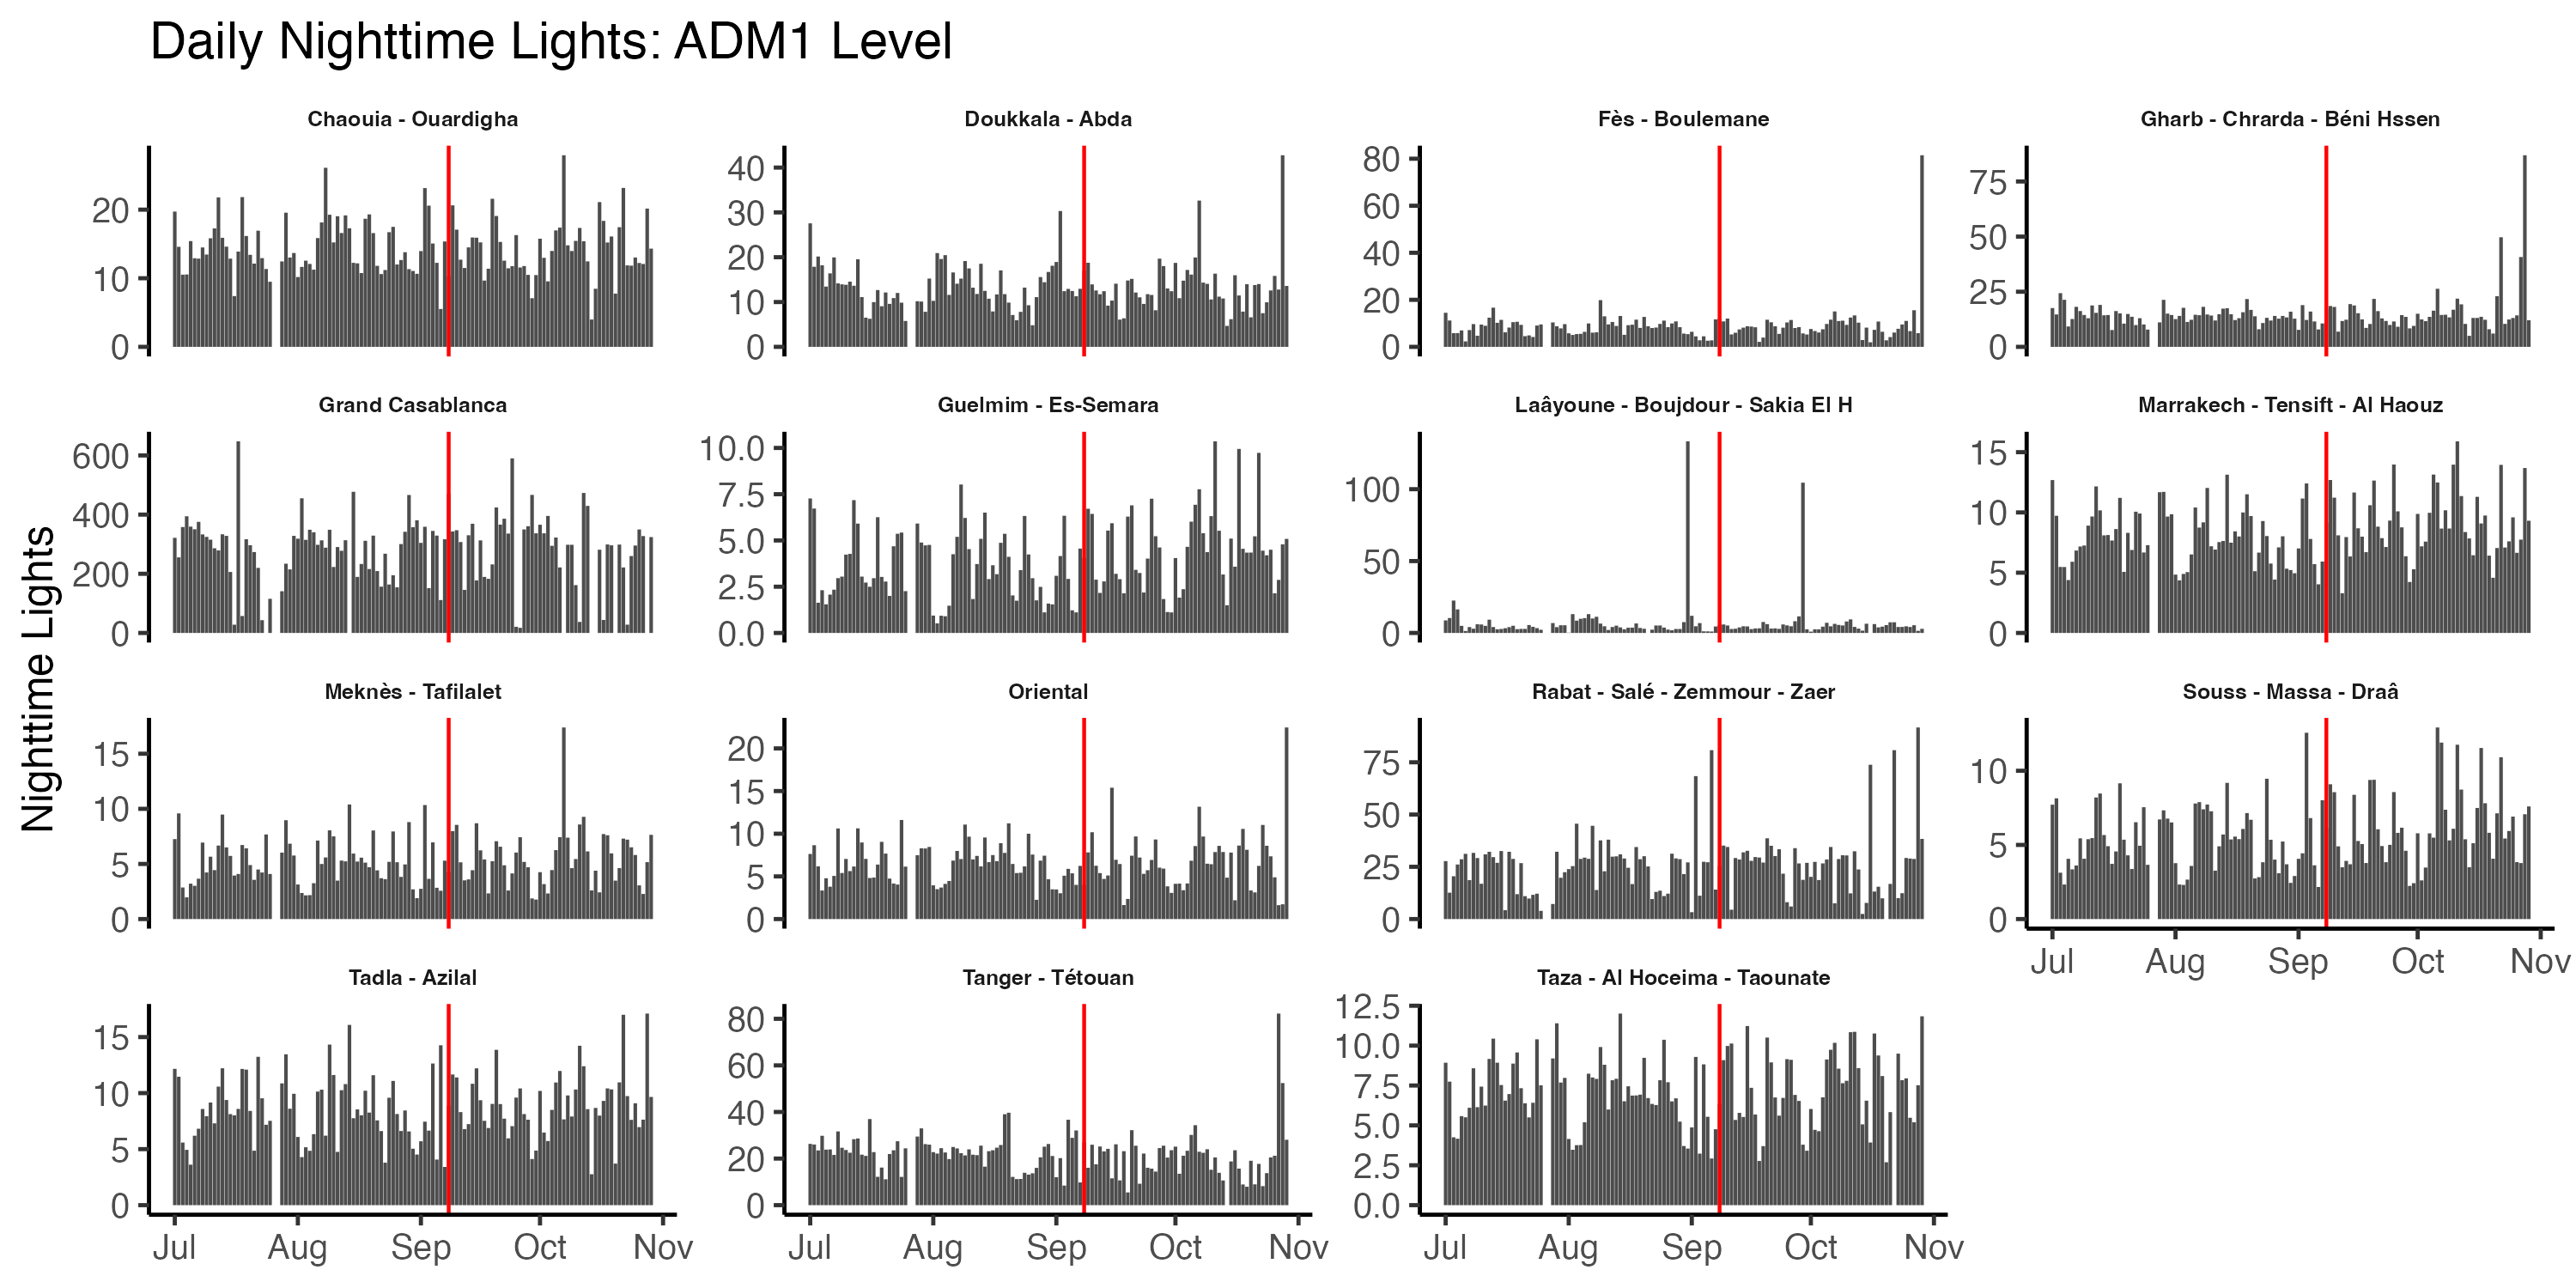
Fig. 5 Daily Trends in Nighttime Lights: ADM 1 Level#
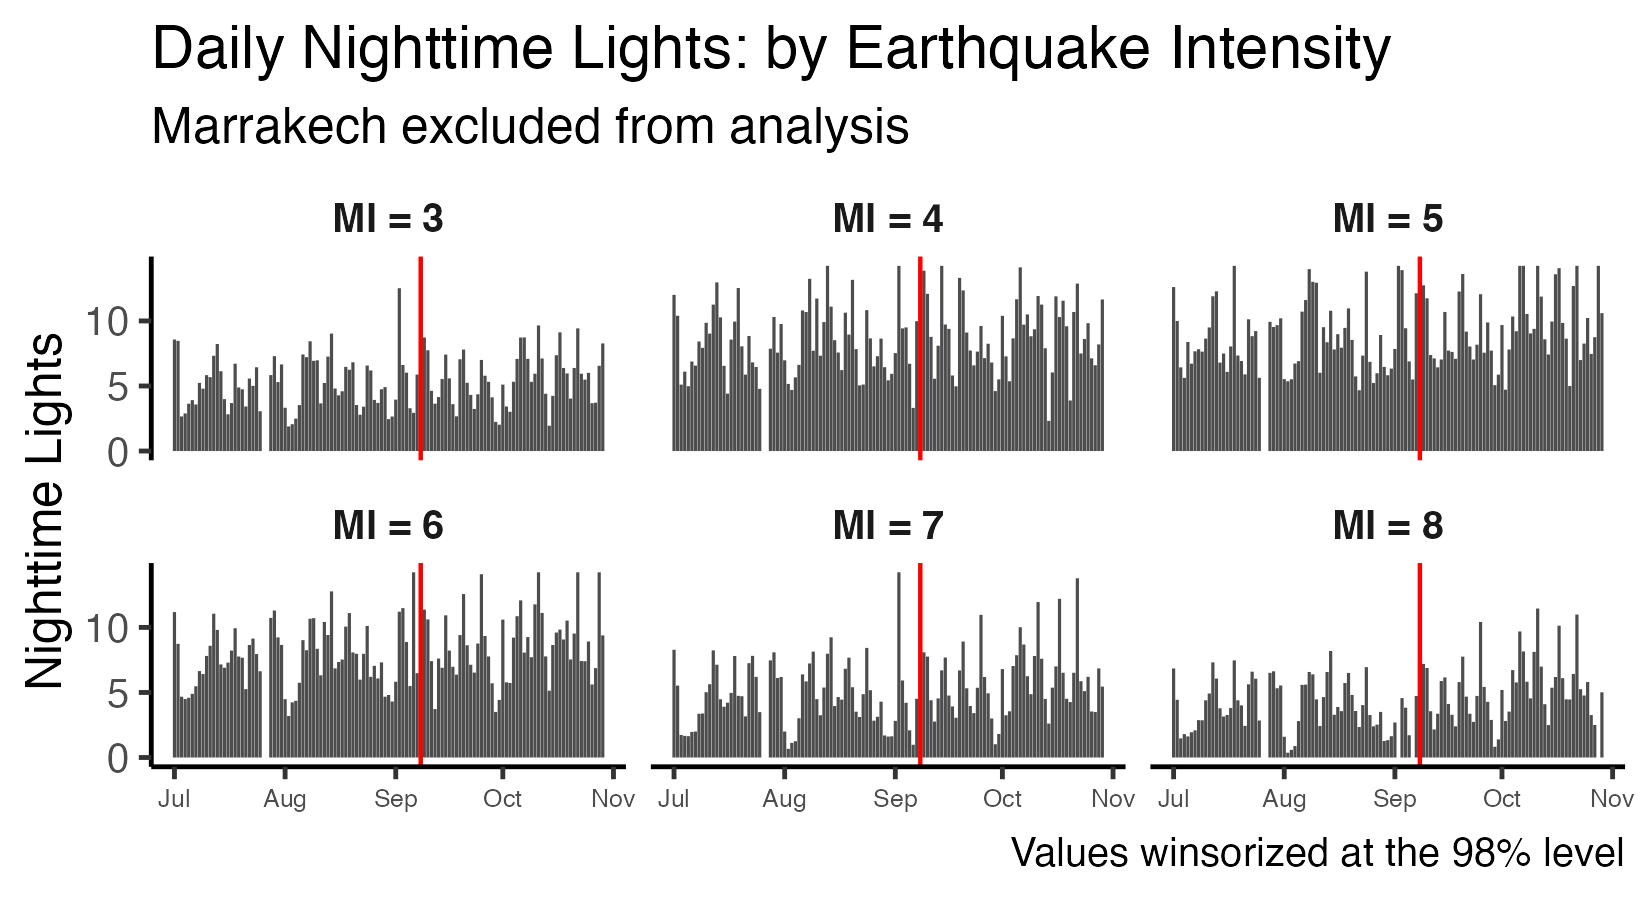
Fig. 6 Daily Trends in Nighttime Lights: Earthquake Intensity#
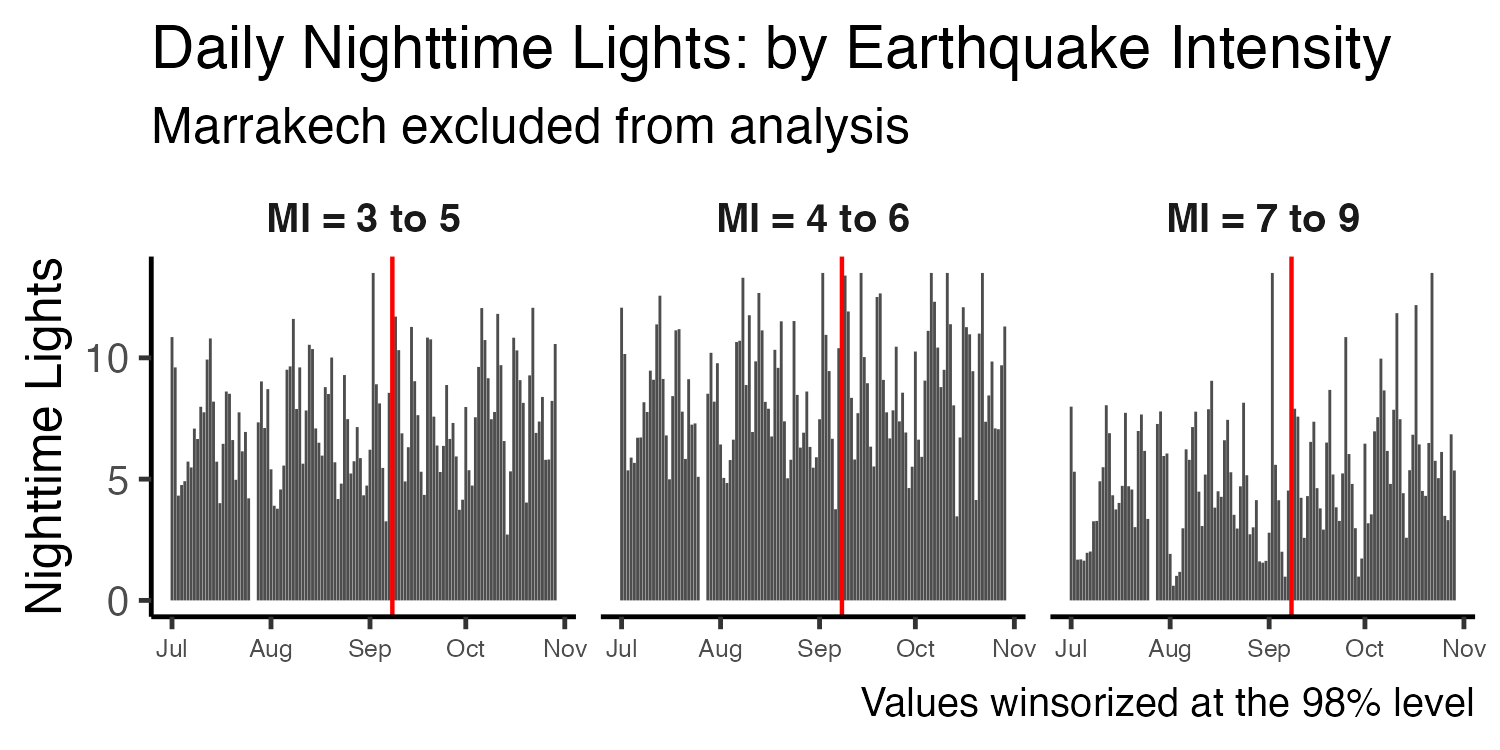
Fig. 7 Daily Trends in Nighttime Lights: Earthquake Intensity#
Nighttime Lights: ADM2 and ADM3#
The below tables show average nighttime lights at ADM2 and ADM3 levels for 2014, 2023 (before the earthquake), and 2023 (after the earthquake). For 2023, we take the average of daily nighttime lights for the respective time periods.
The below tables show the 30 administrative zones with the largest earthquake intensities. The csv files here provide data for all administrative zones.
Across all of Morocco, the average nighttime lights in 2014 was 27.80; after the earthquake, average nighttime lights was 40.73—a 46% increase.
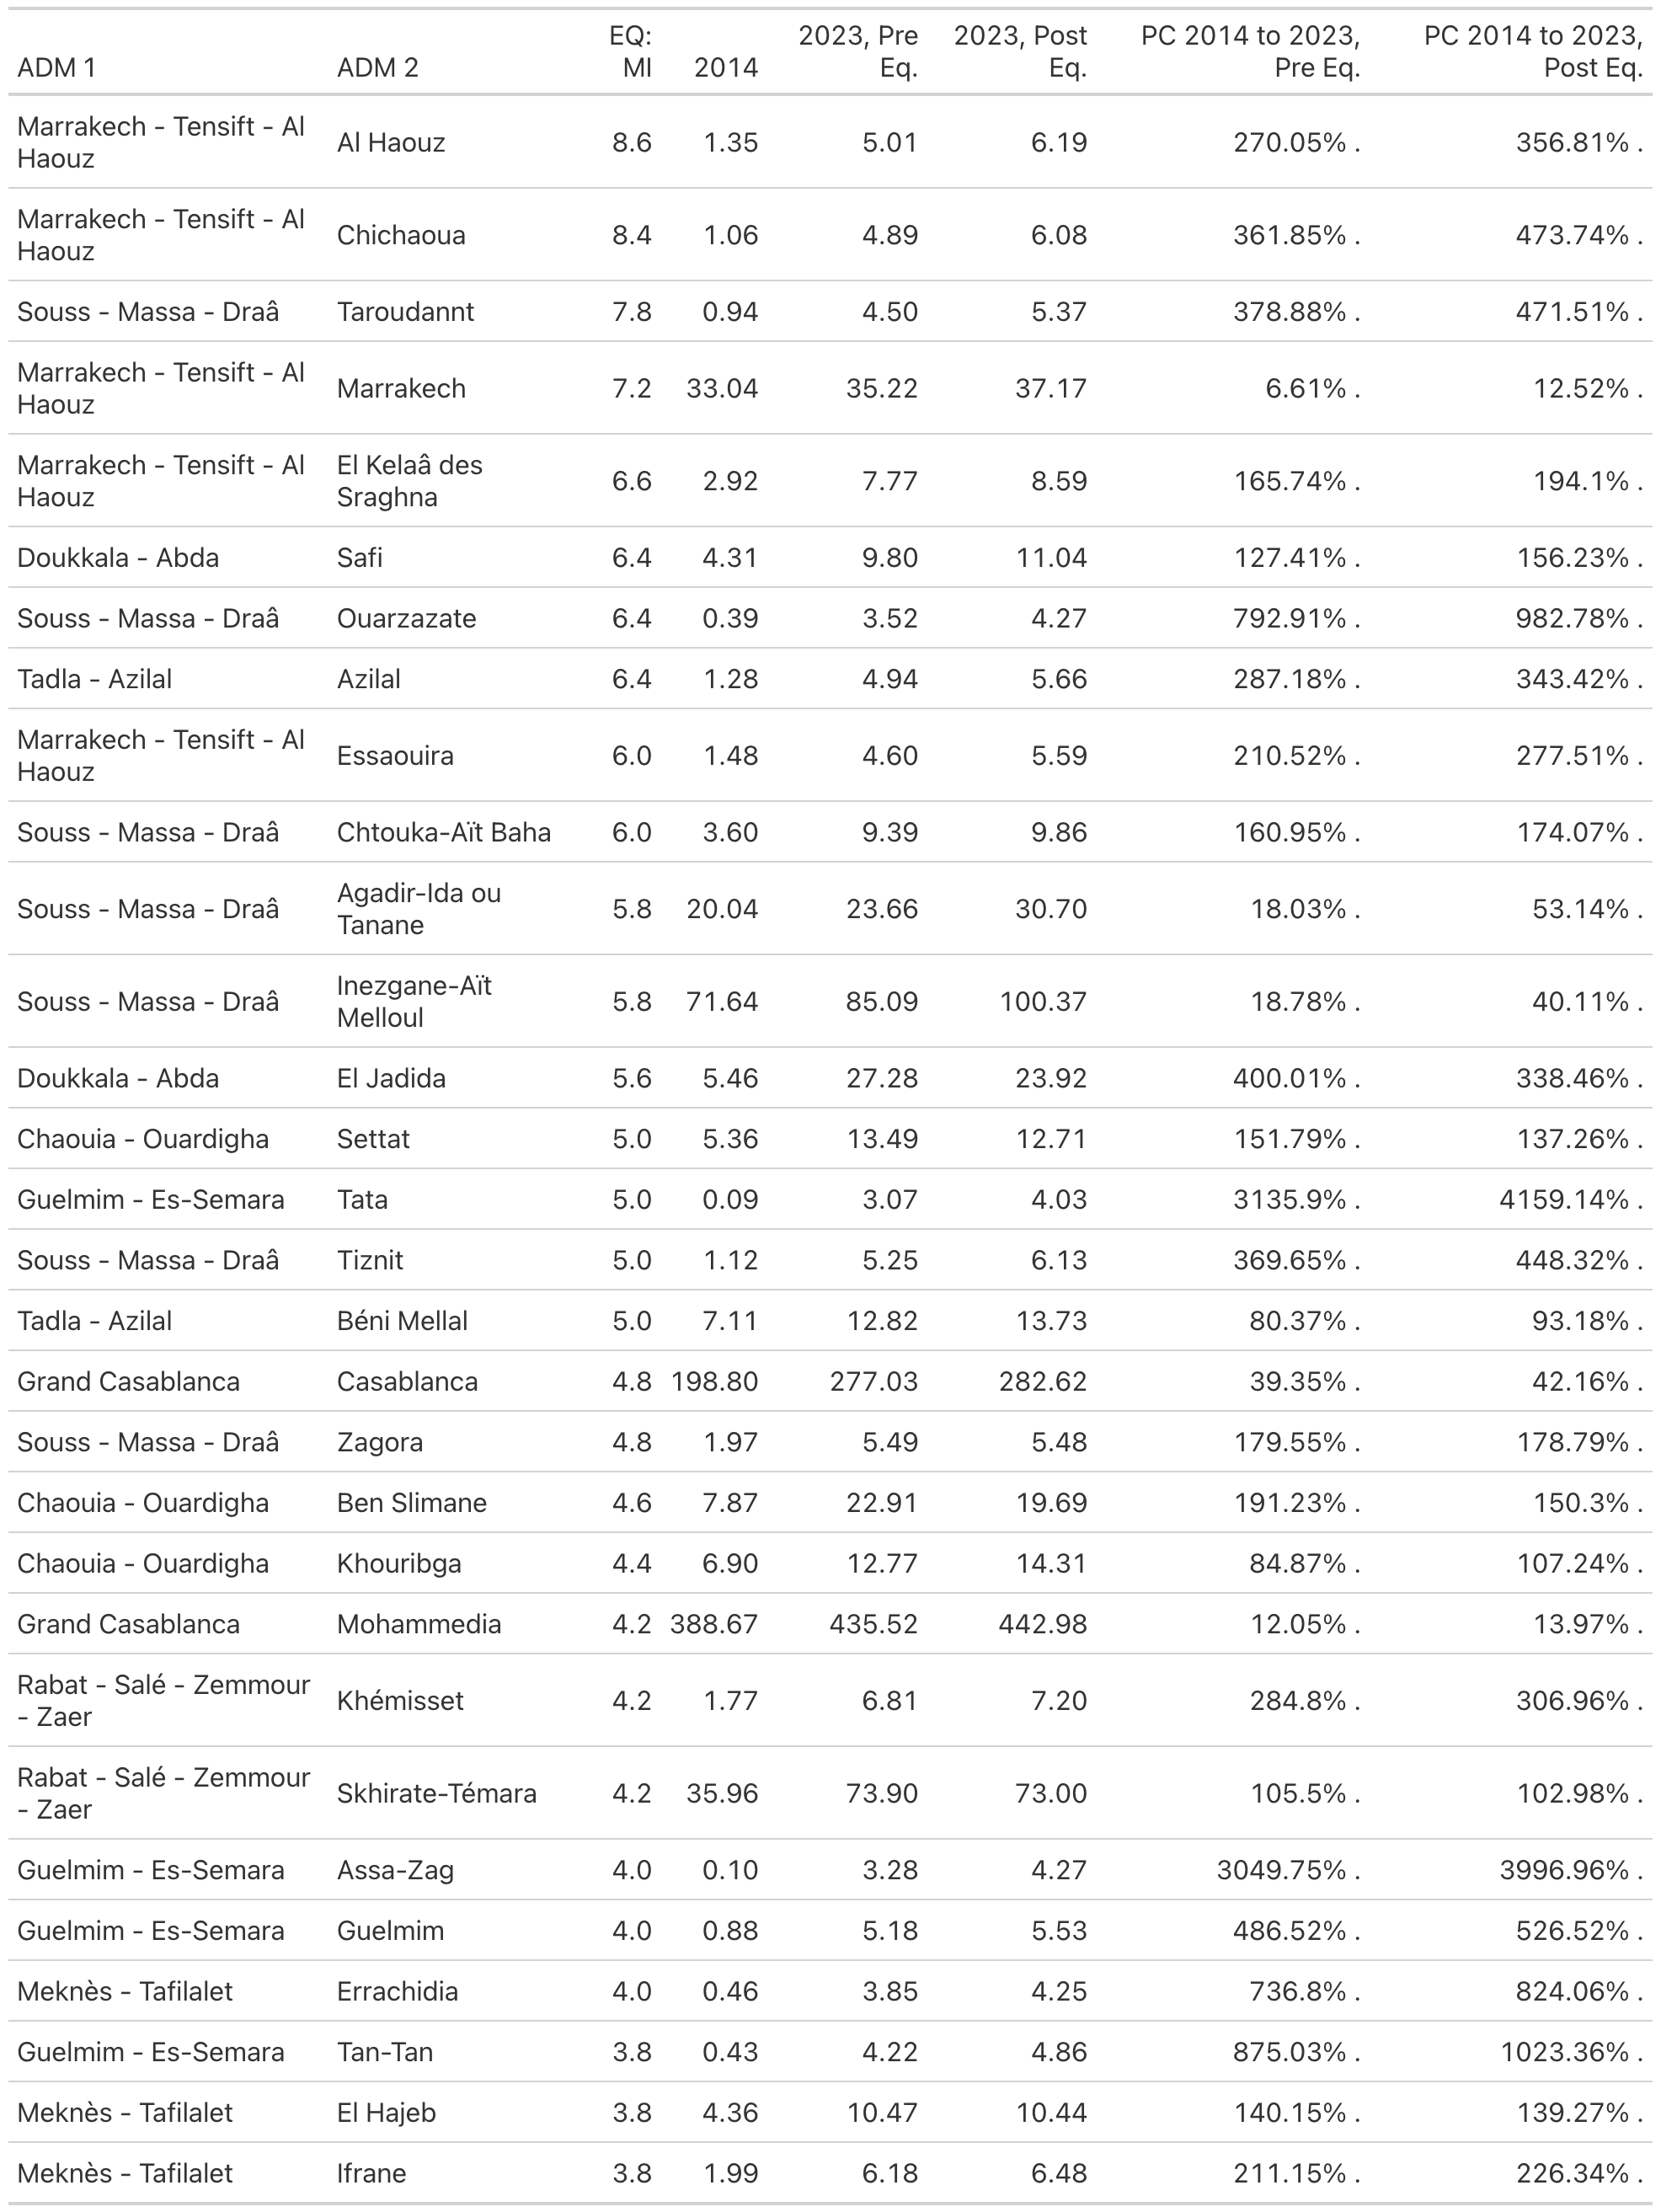
Fig. 8 Annual Nighttime Lights: ADM 2 Level#
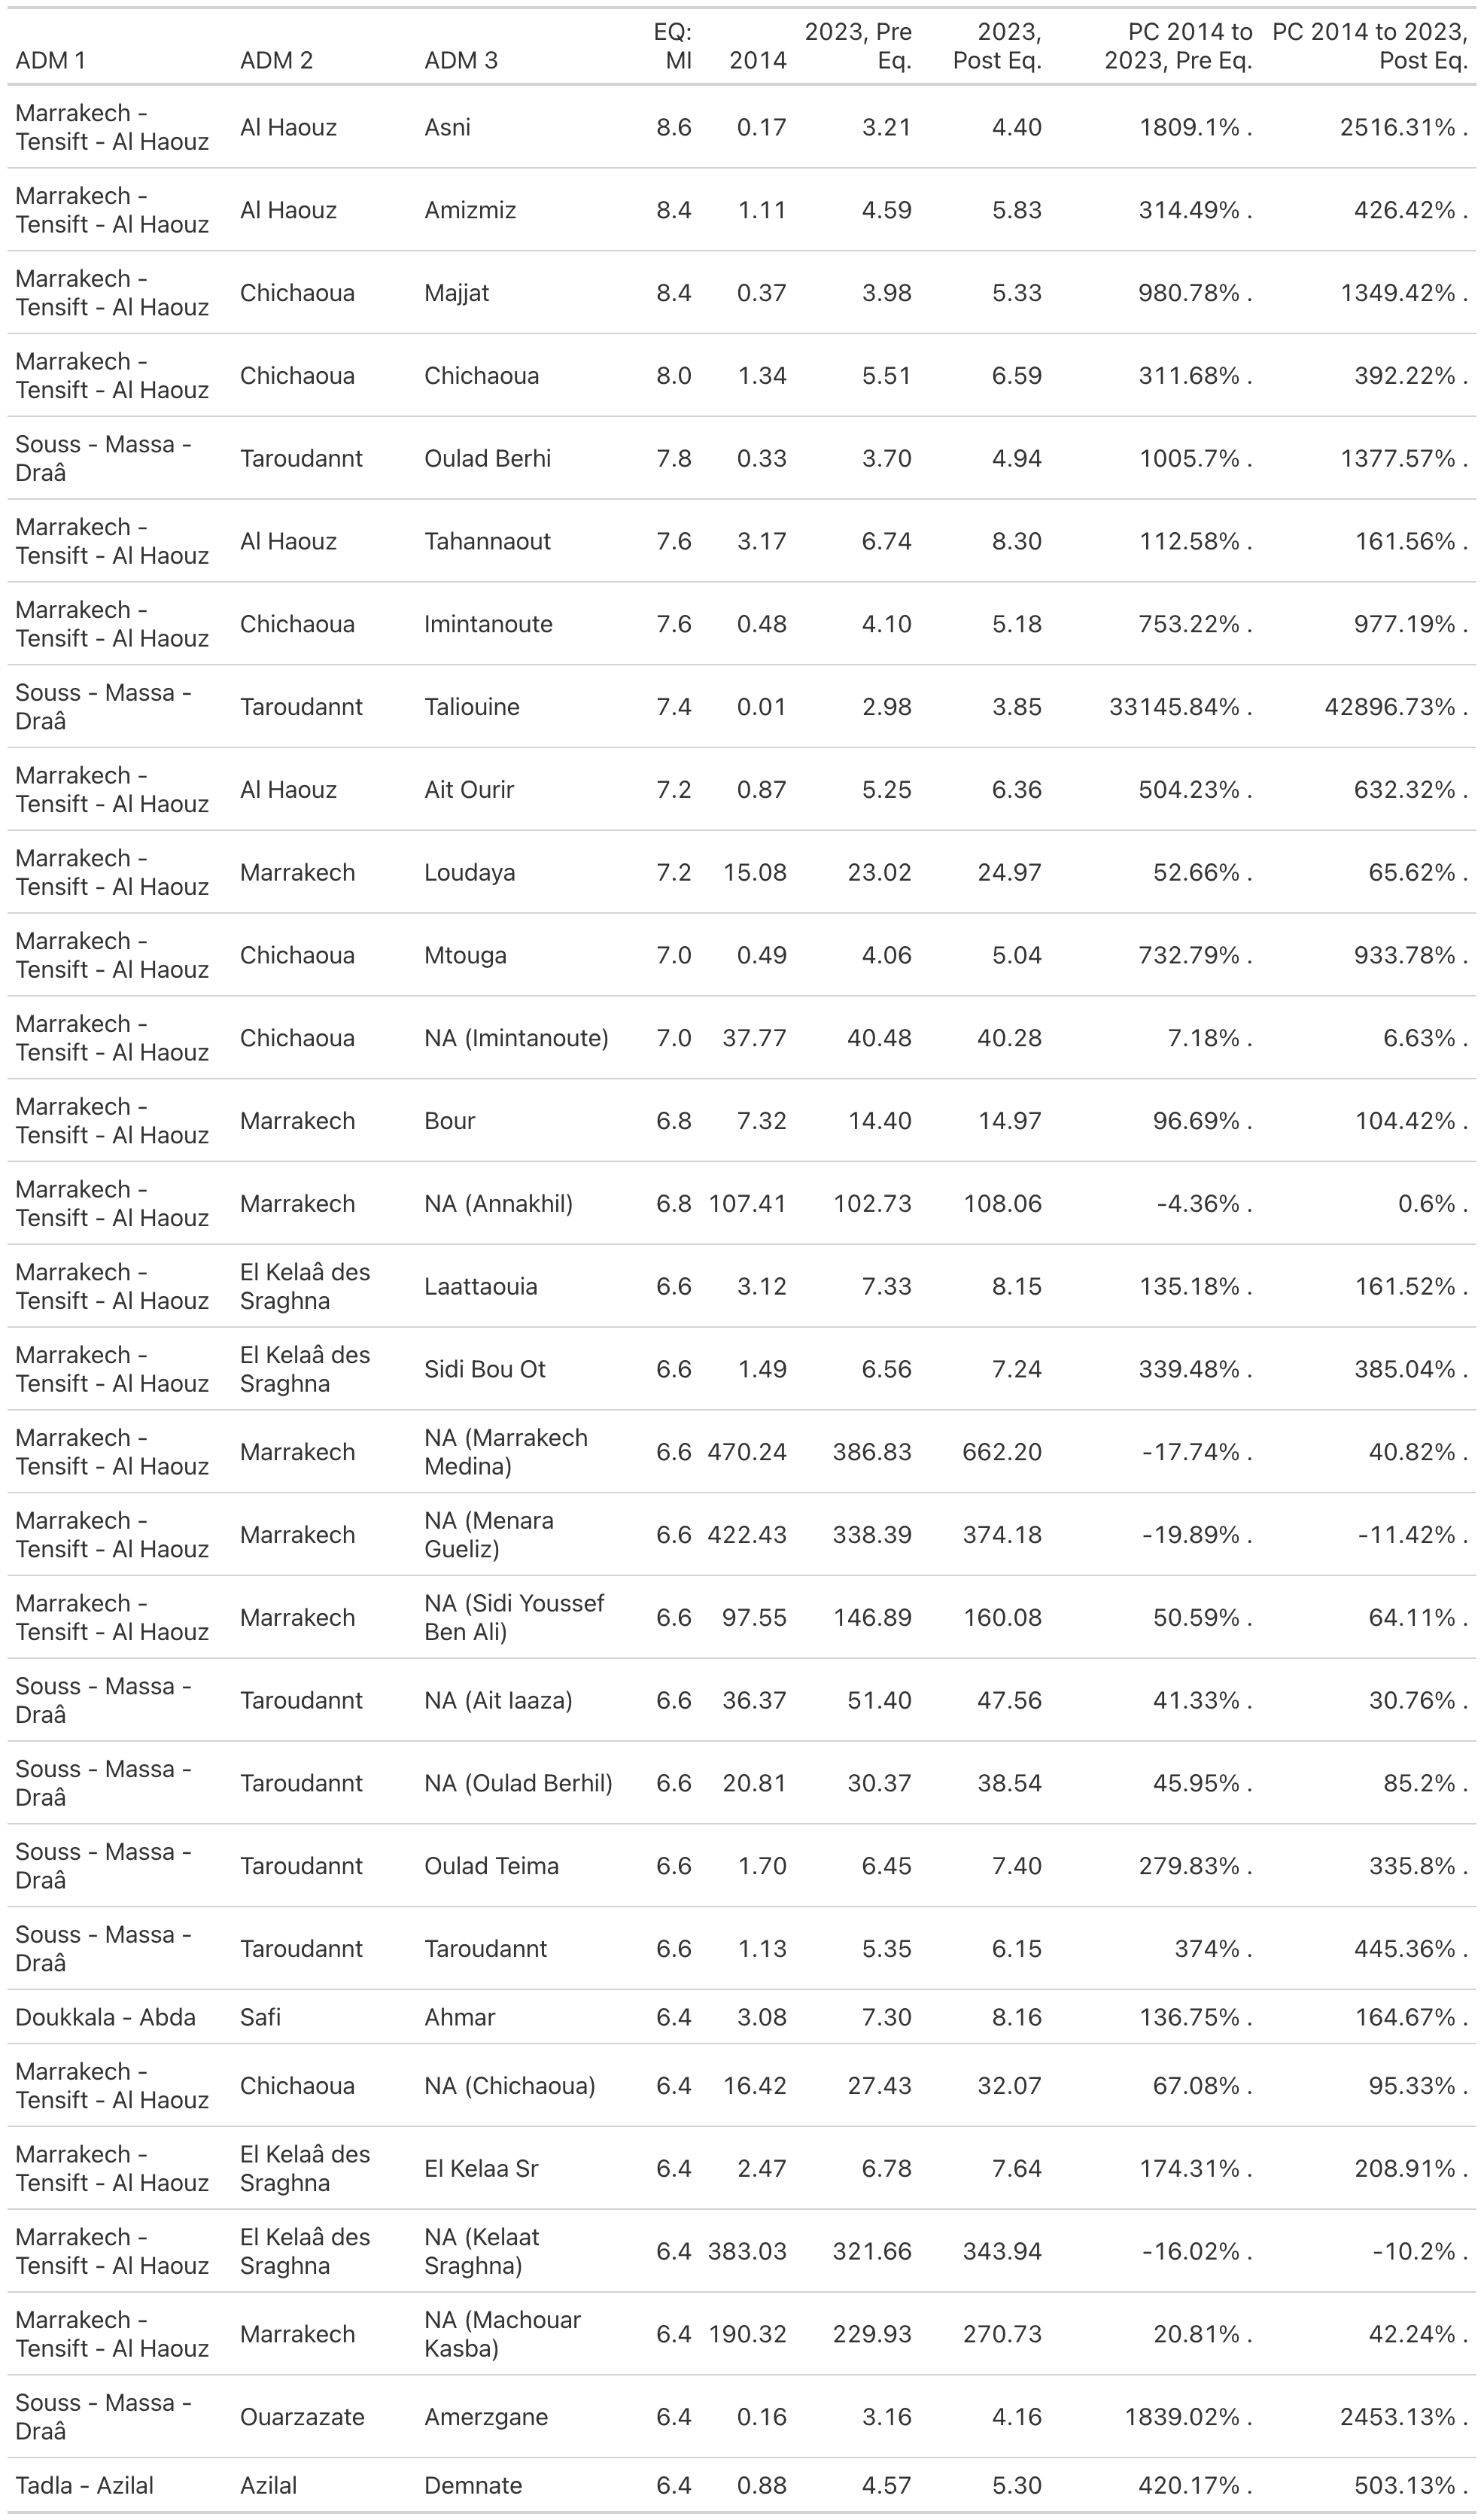
Fig. 9 Annual Nighttime Lights: ADM 3 Level#
The below tables show the percent change in nighttime lights relative to the week before the earthquake.
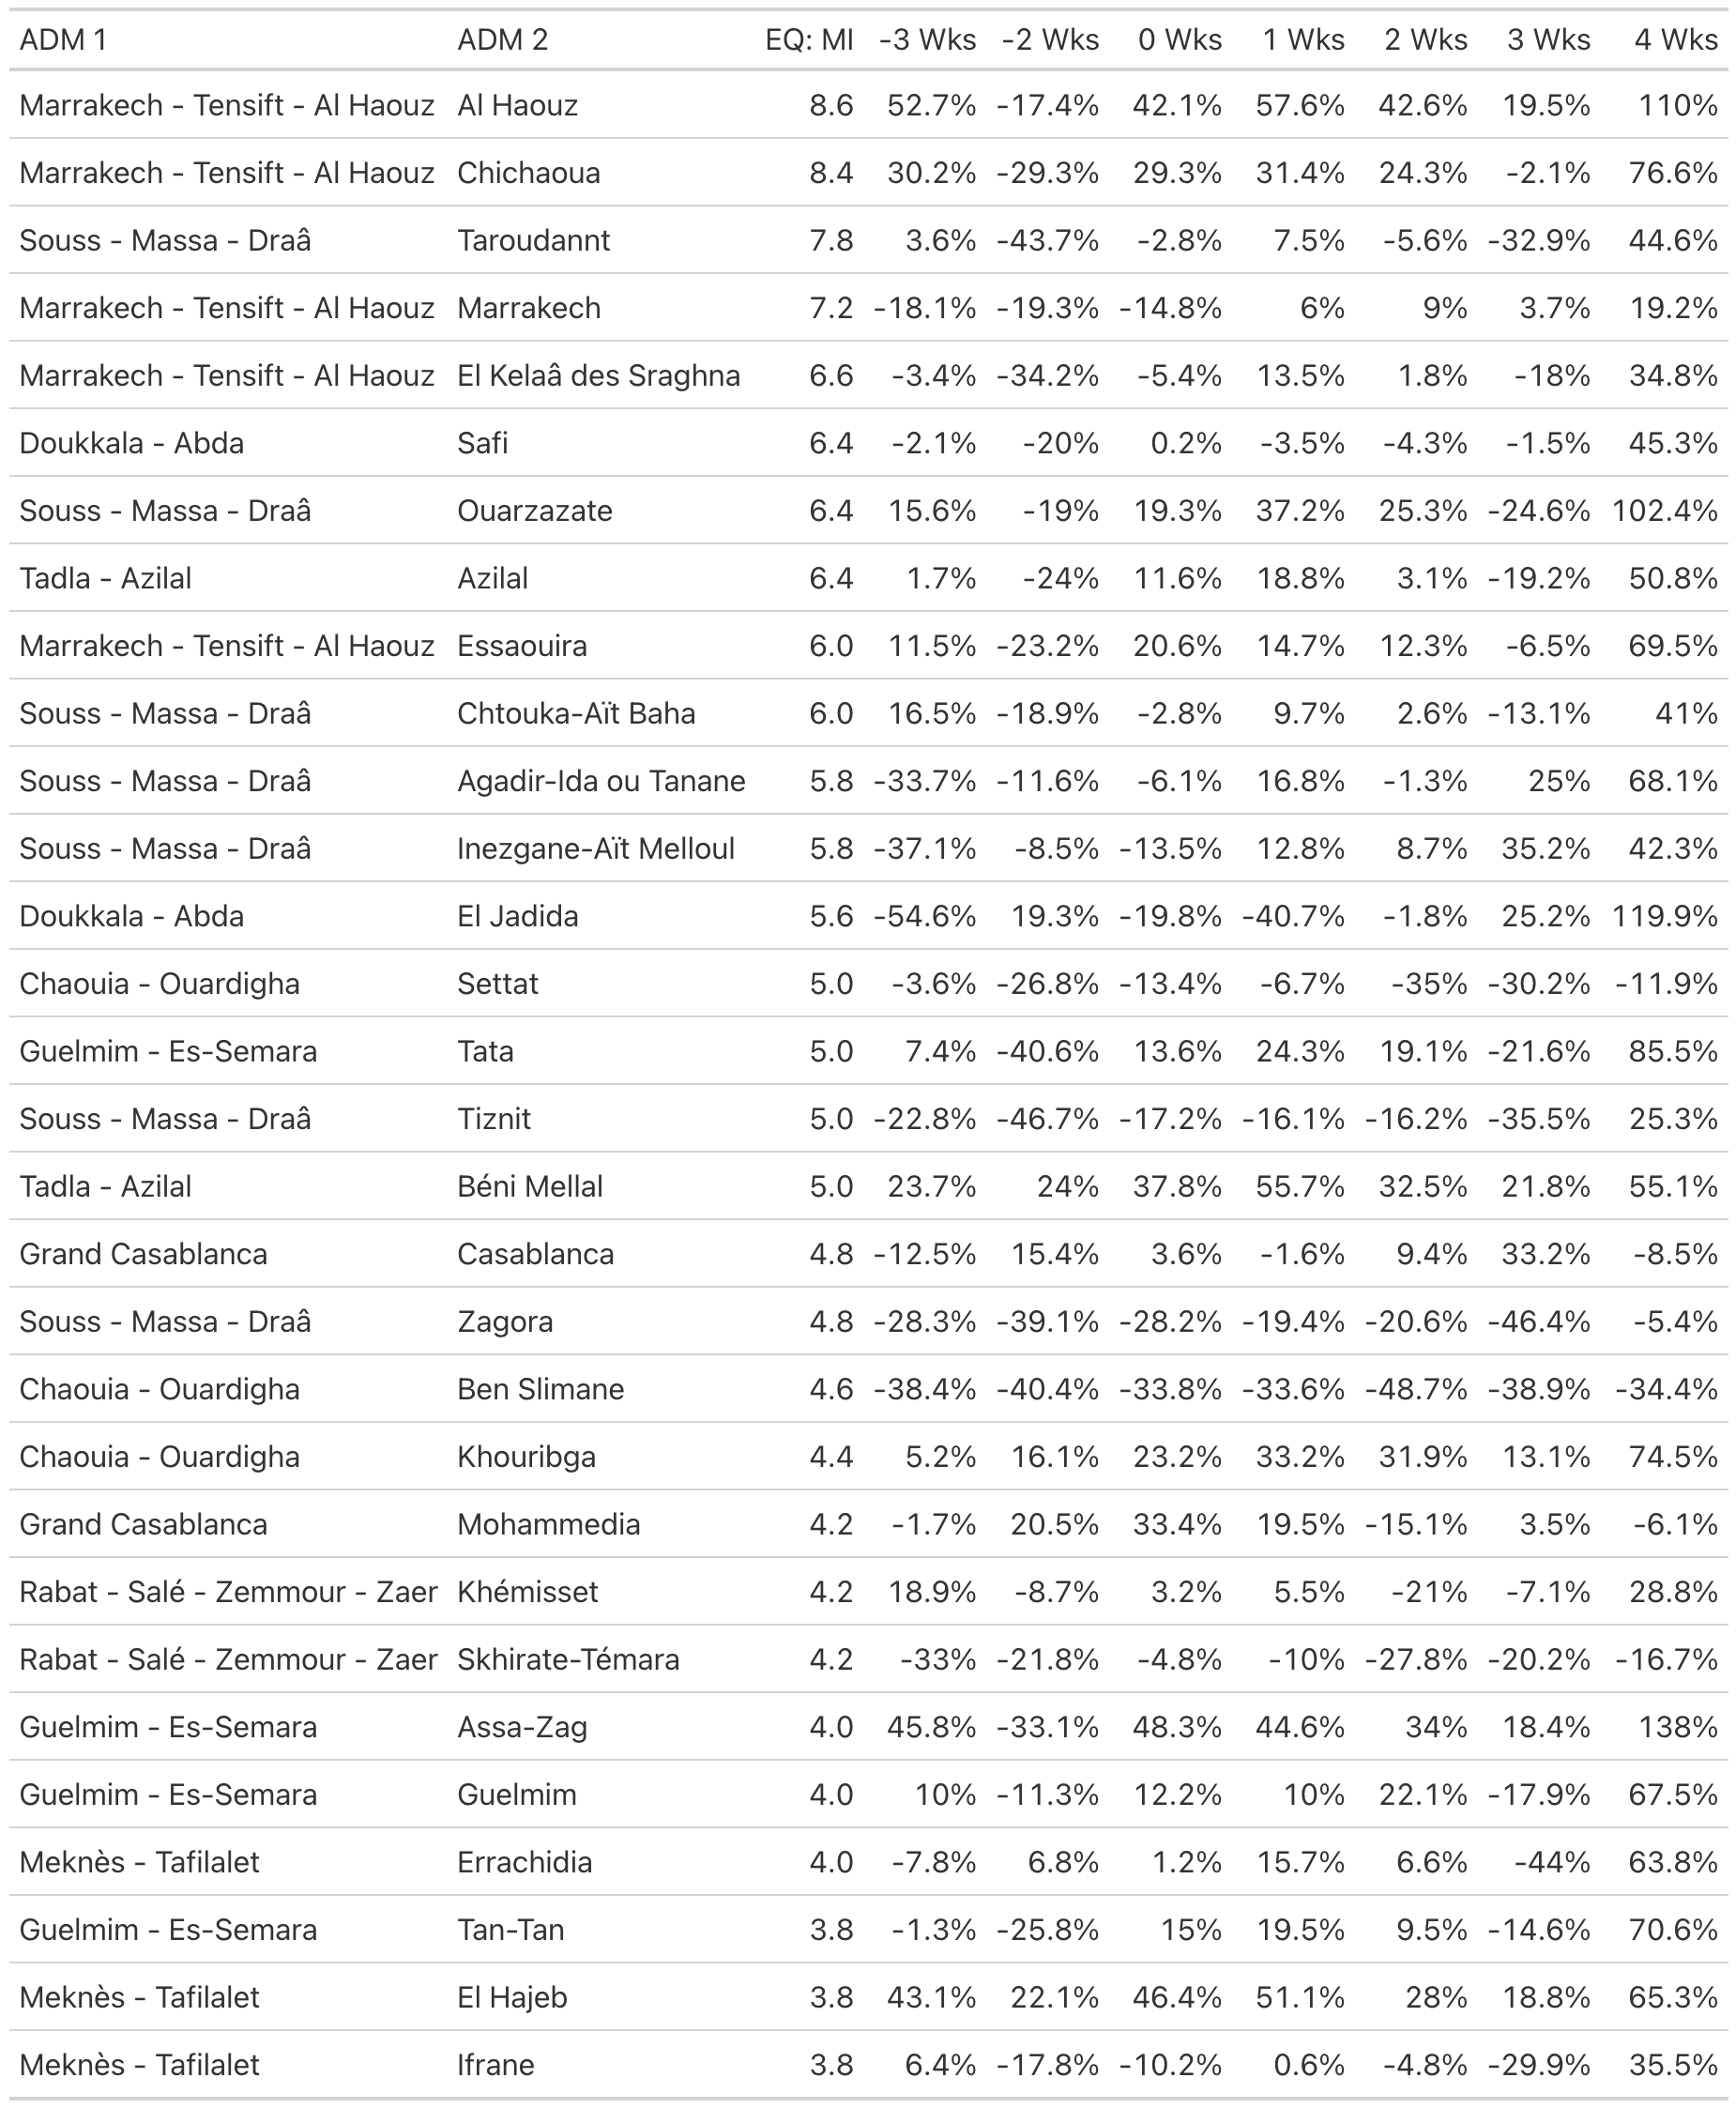
Fig. 10 Percent change in nighttime lights relative to week before earthquake: ADM 2 Level#
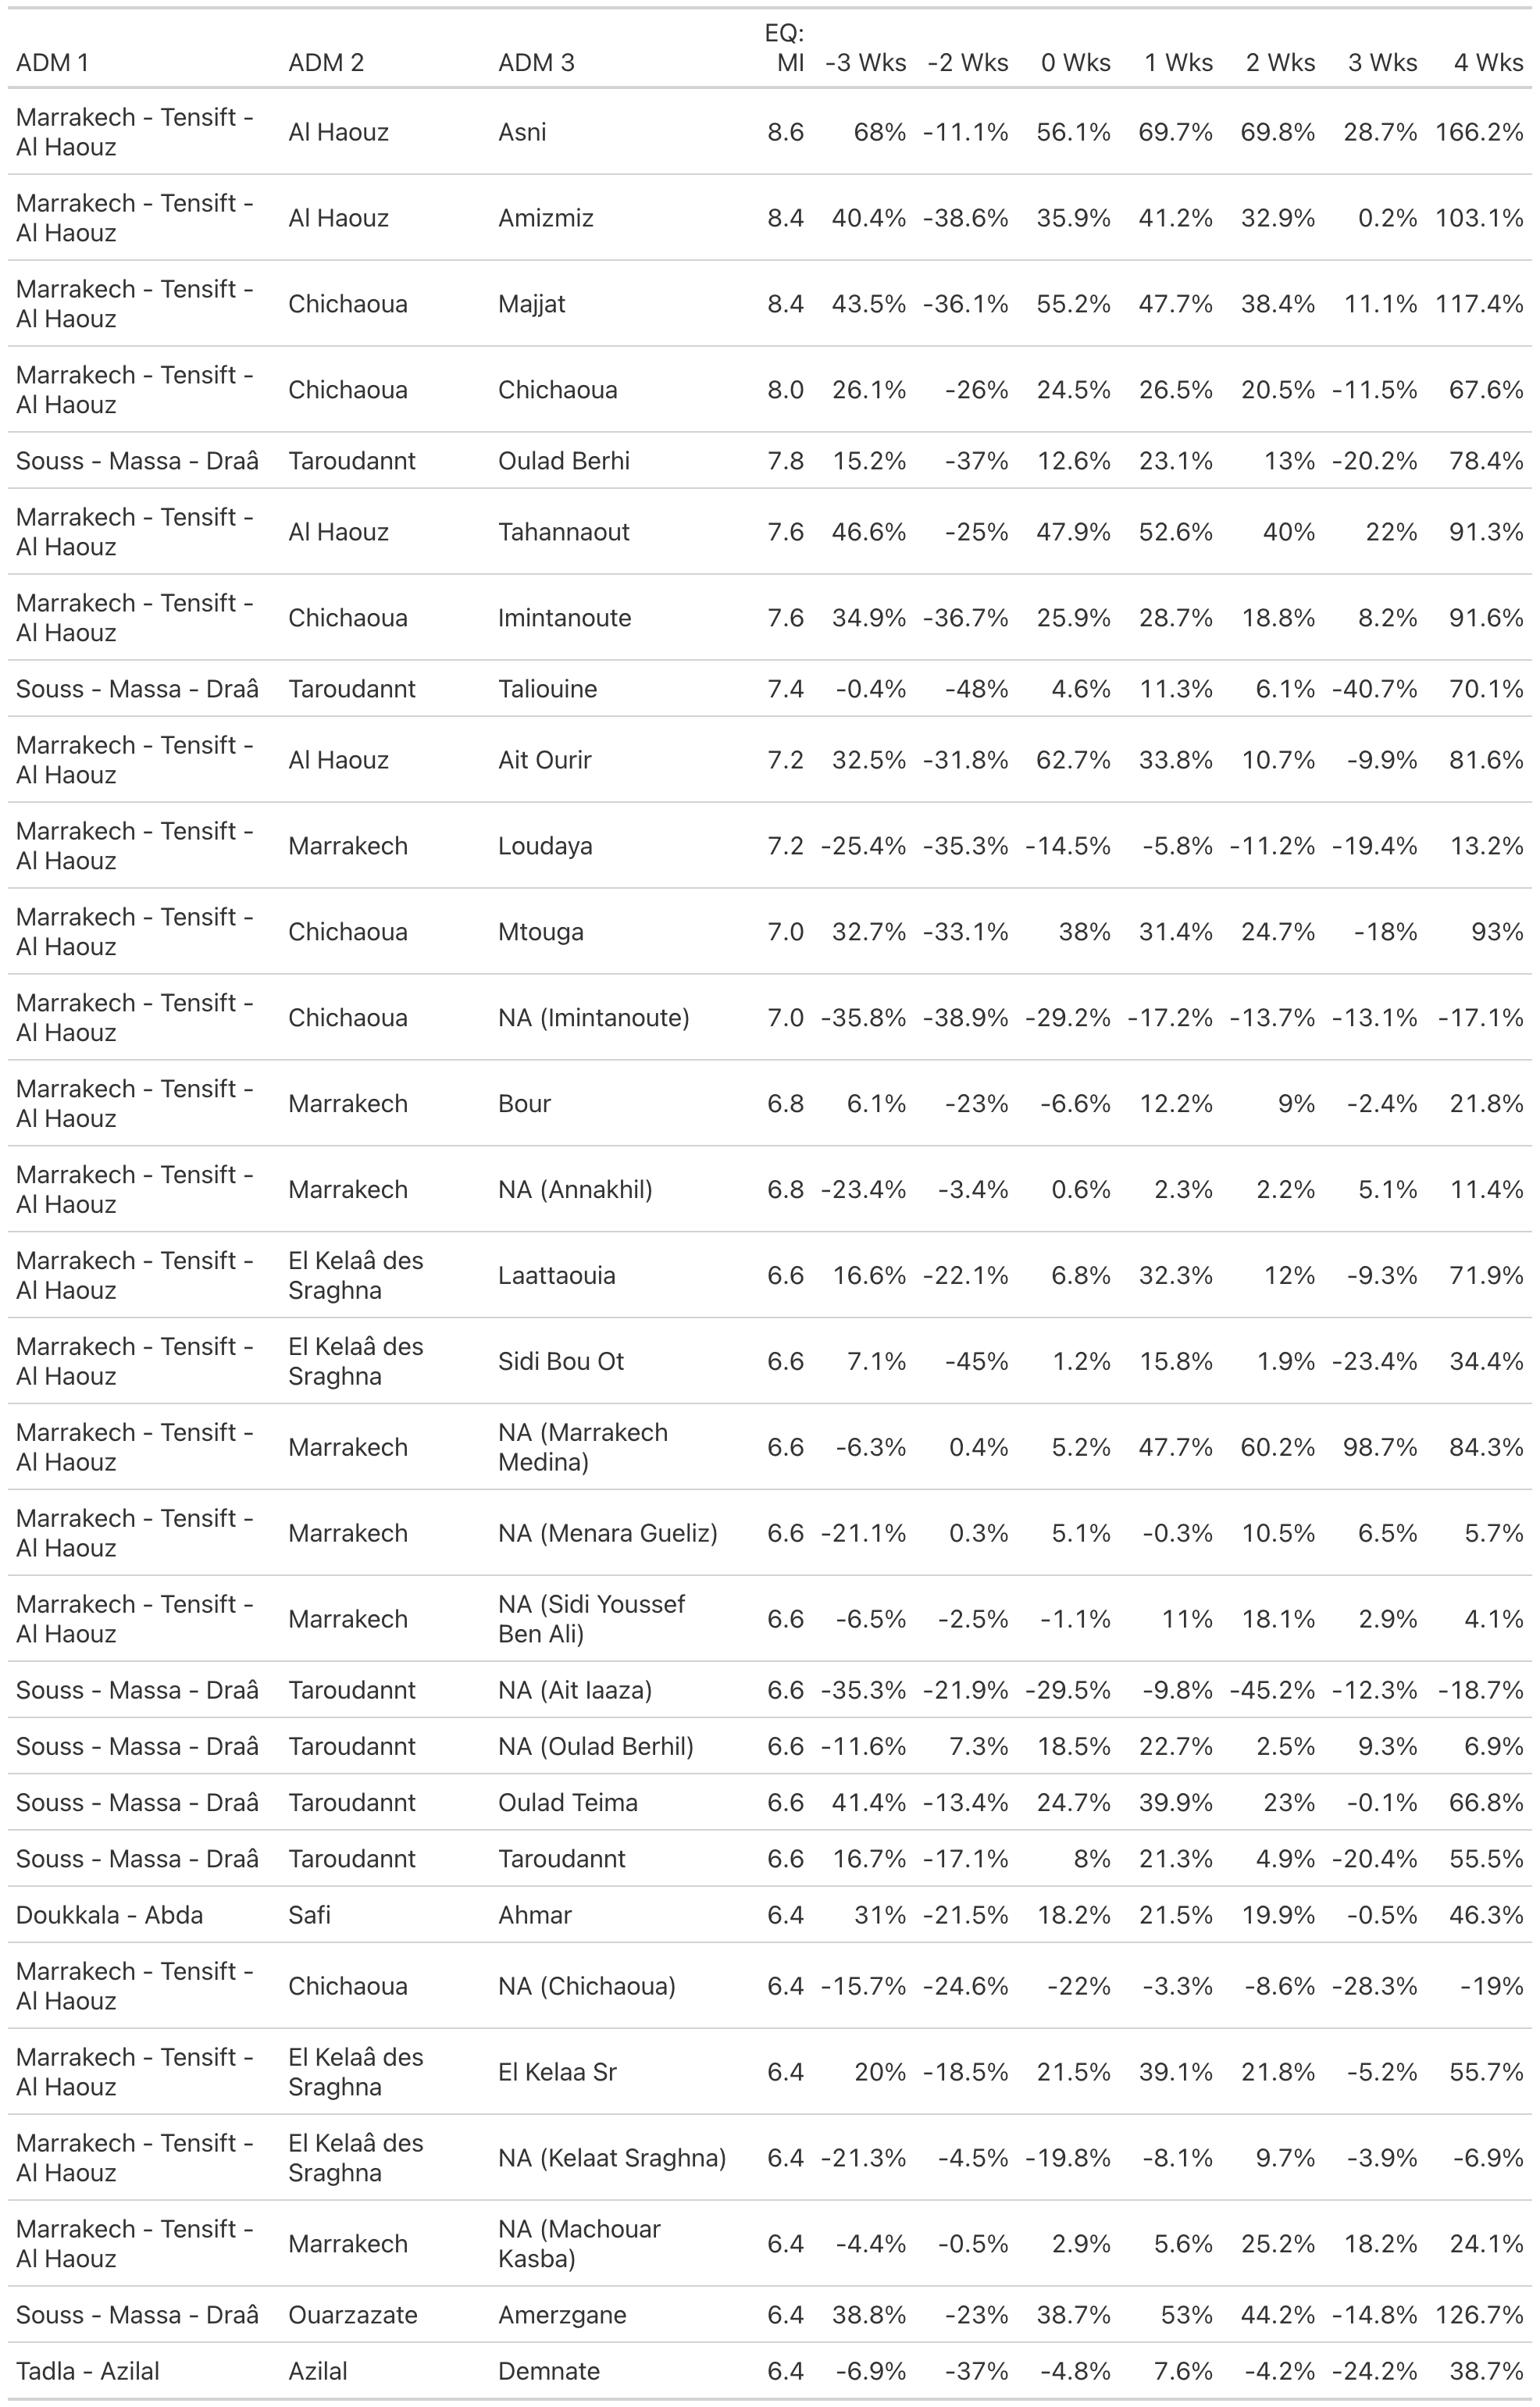
Fig. 11 Percent change in nighttime lights relative to week before earthquake: ADM 3 Level#
Change in Nighttime Lights#
This section shows the percent change in nighttime lights from 2019, 2020, 2021 until 2022 at different administrative levels.
Maps#
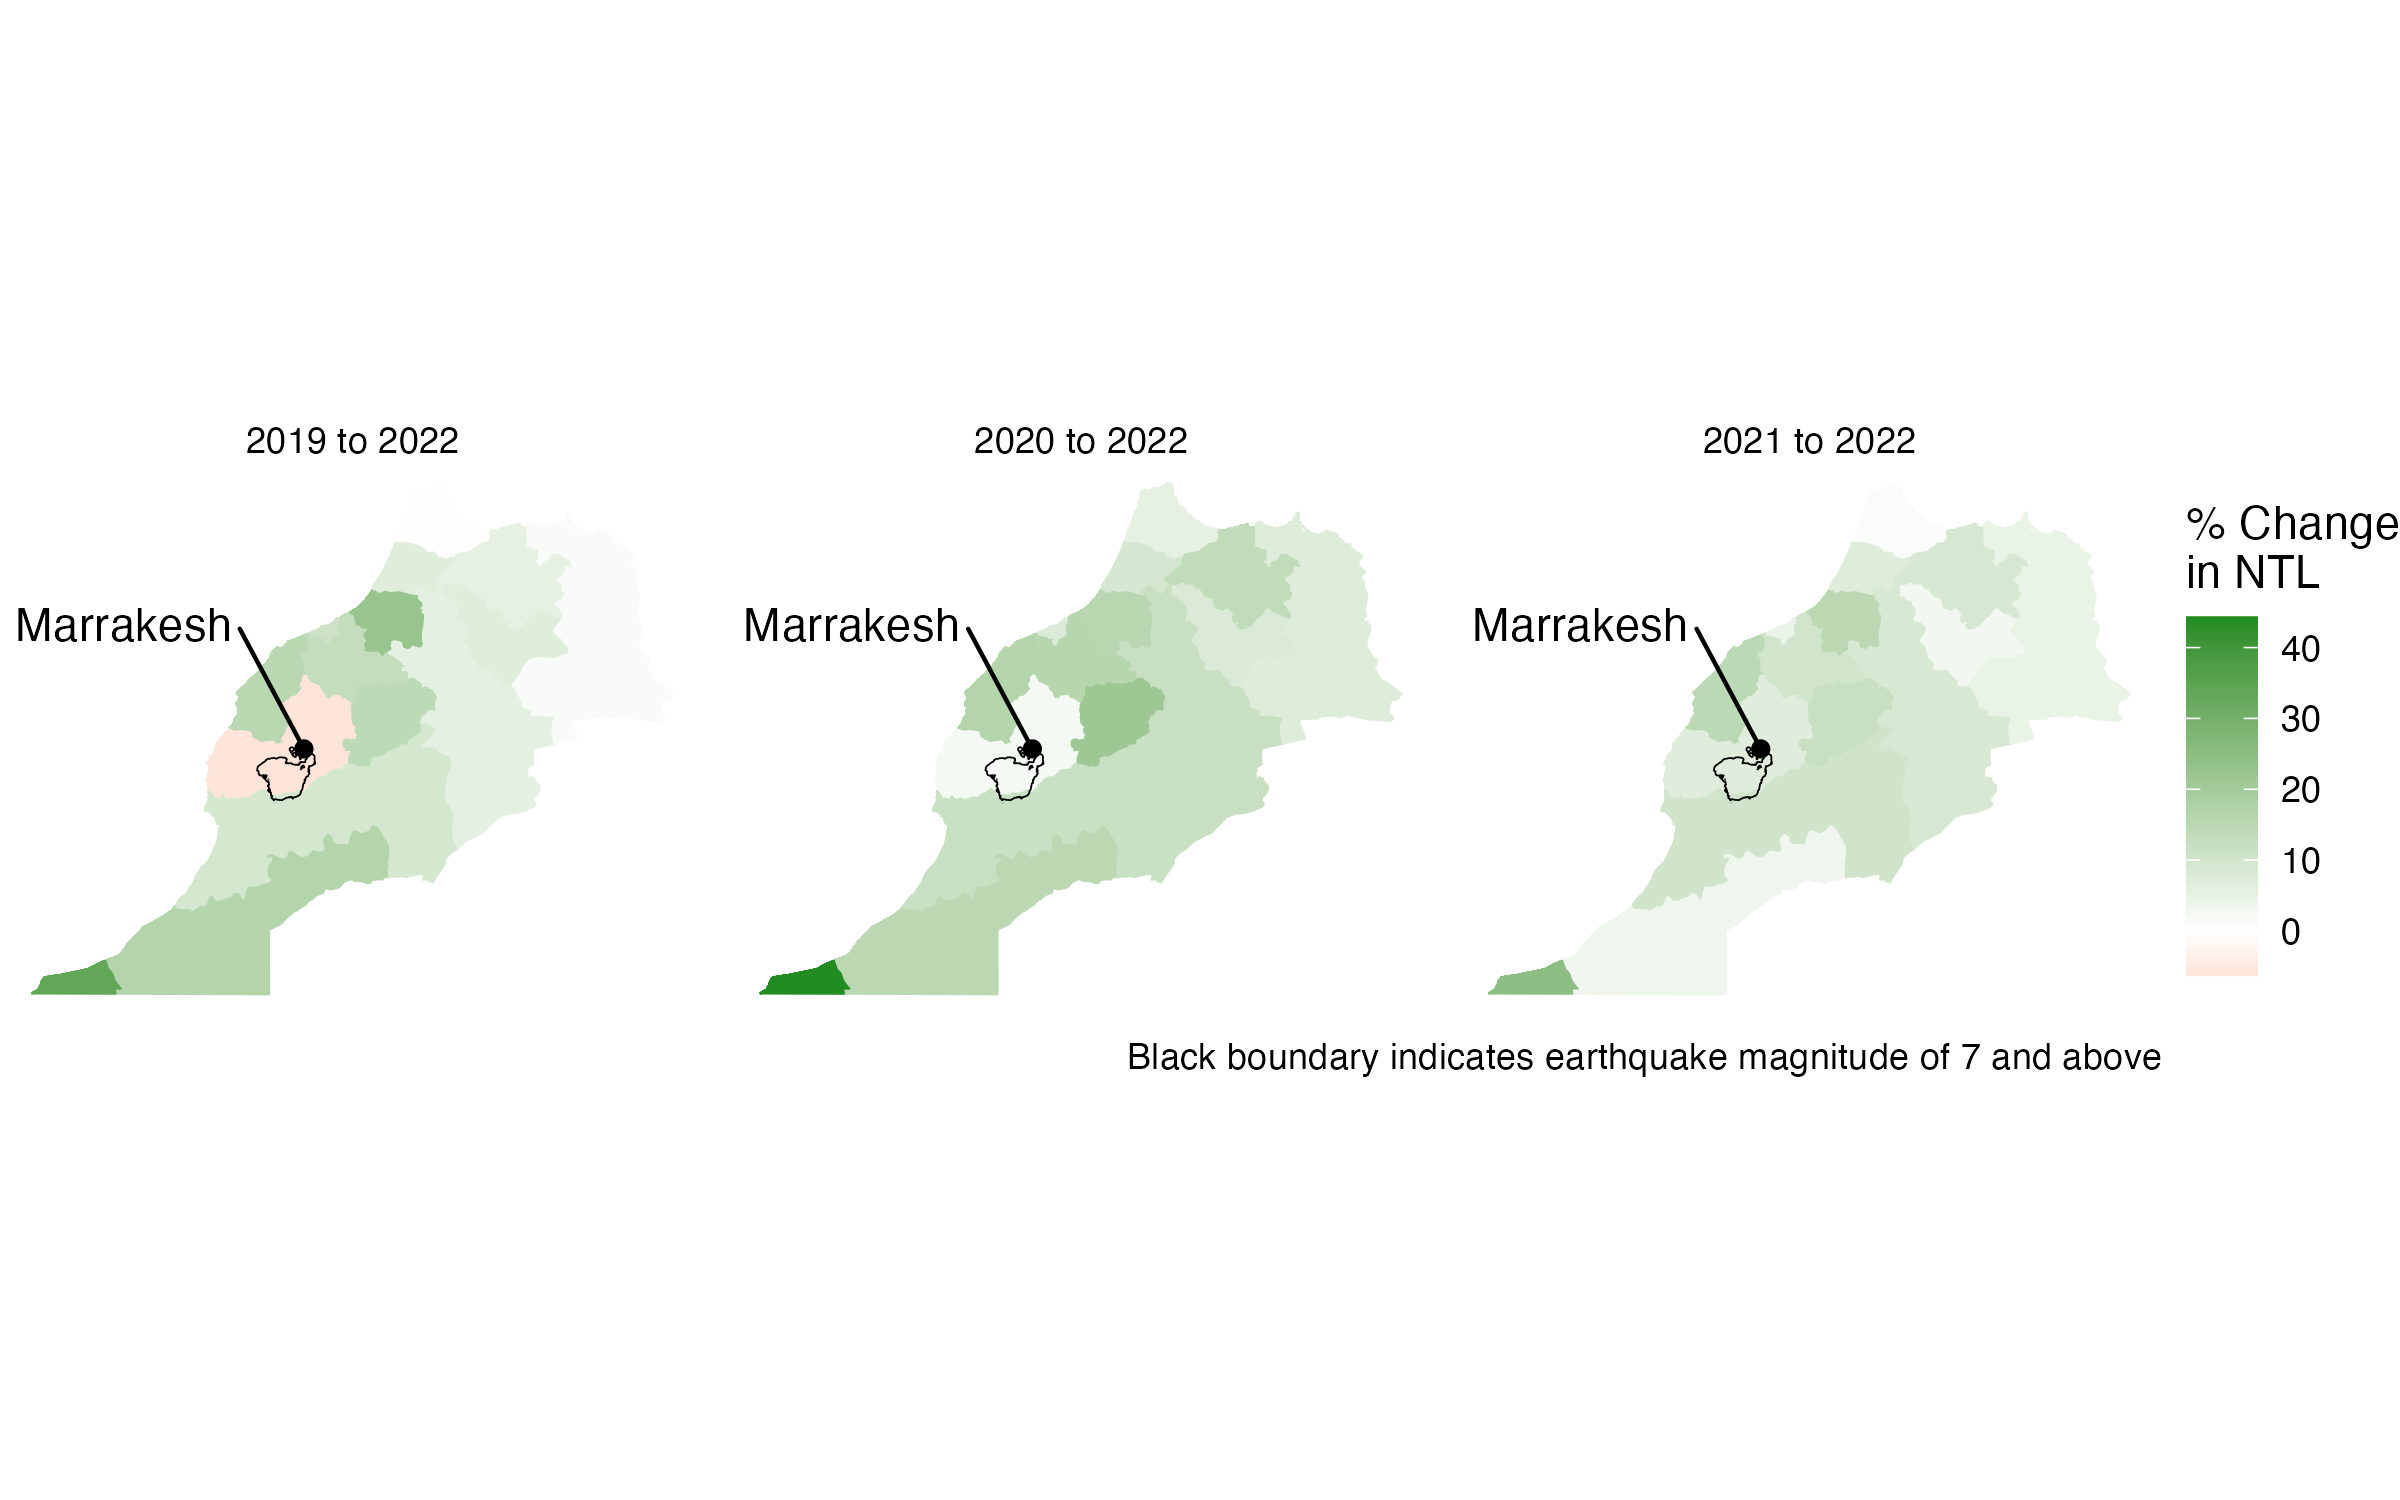
Fig. 12 Percent Change in Nighttime Lights: ADM 1#
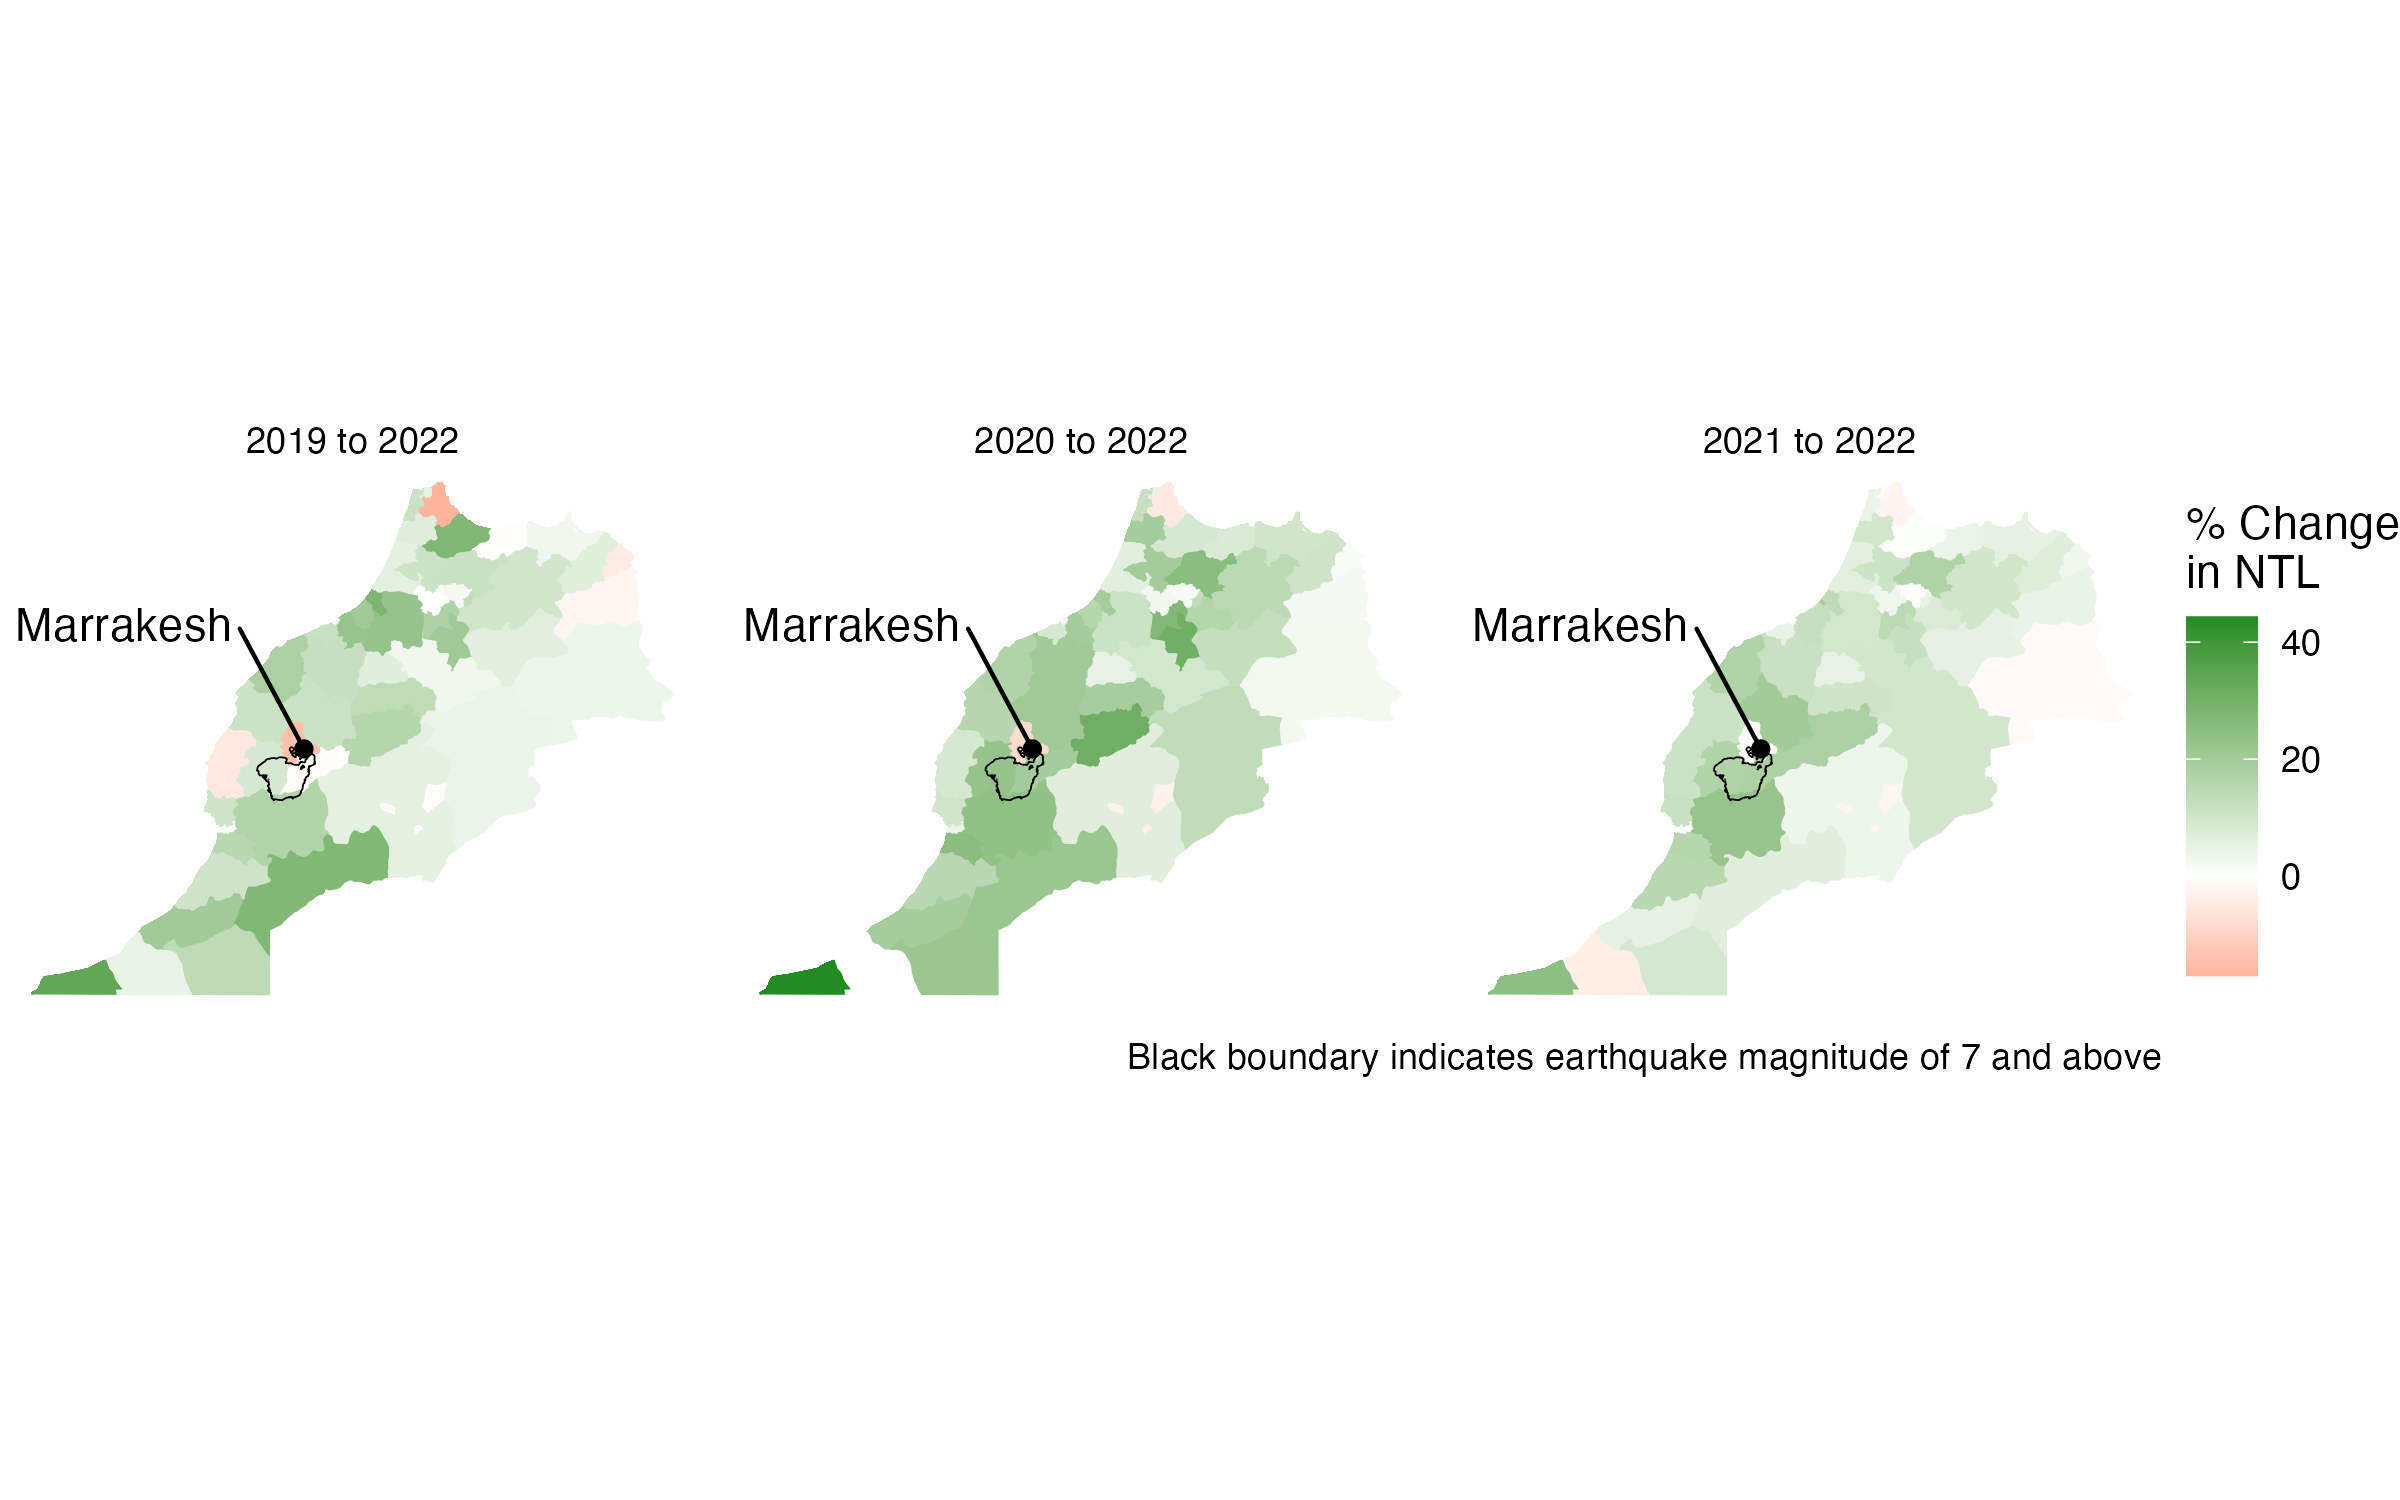
Fig. 13 Percent Change in Nighttime Lights: ADM 2#
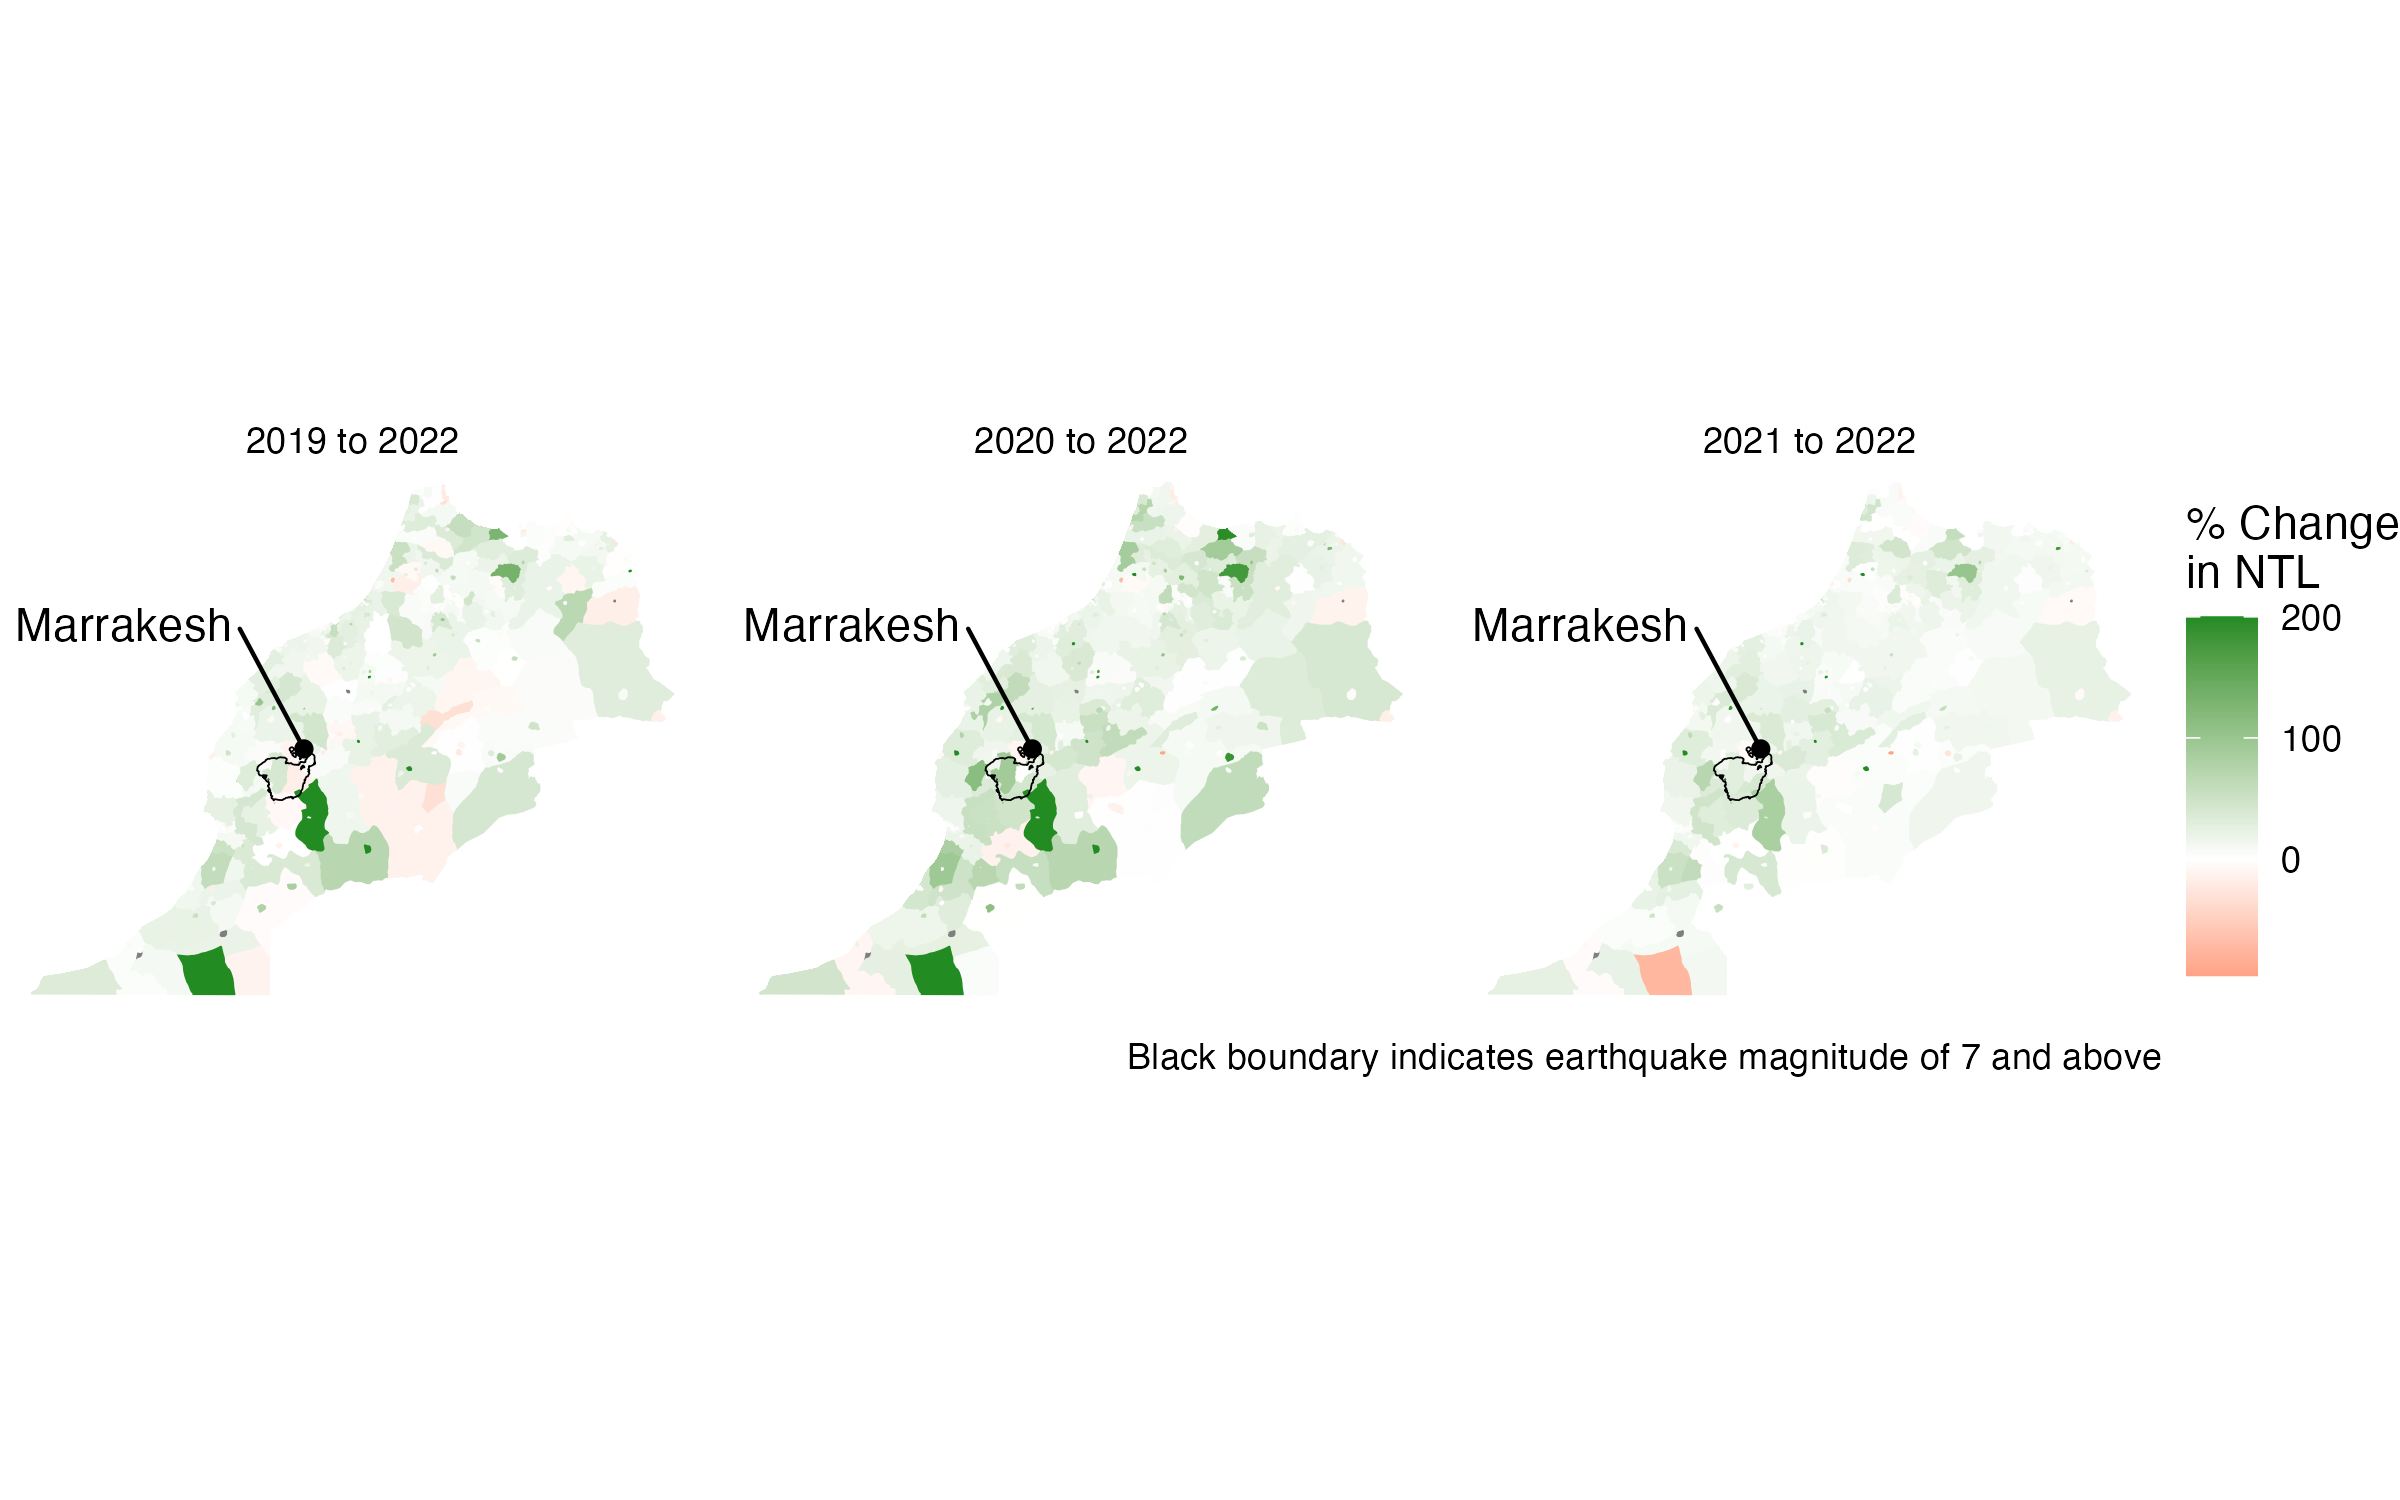
Fig. 14 Percent Change in Nighttime Lights: ADM 3#
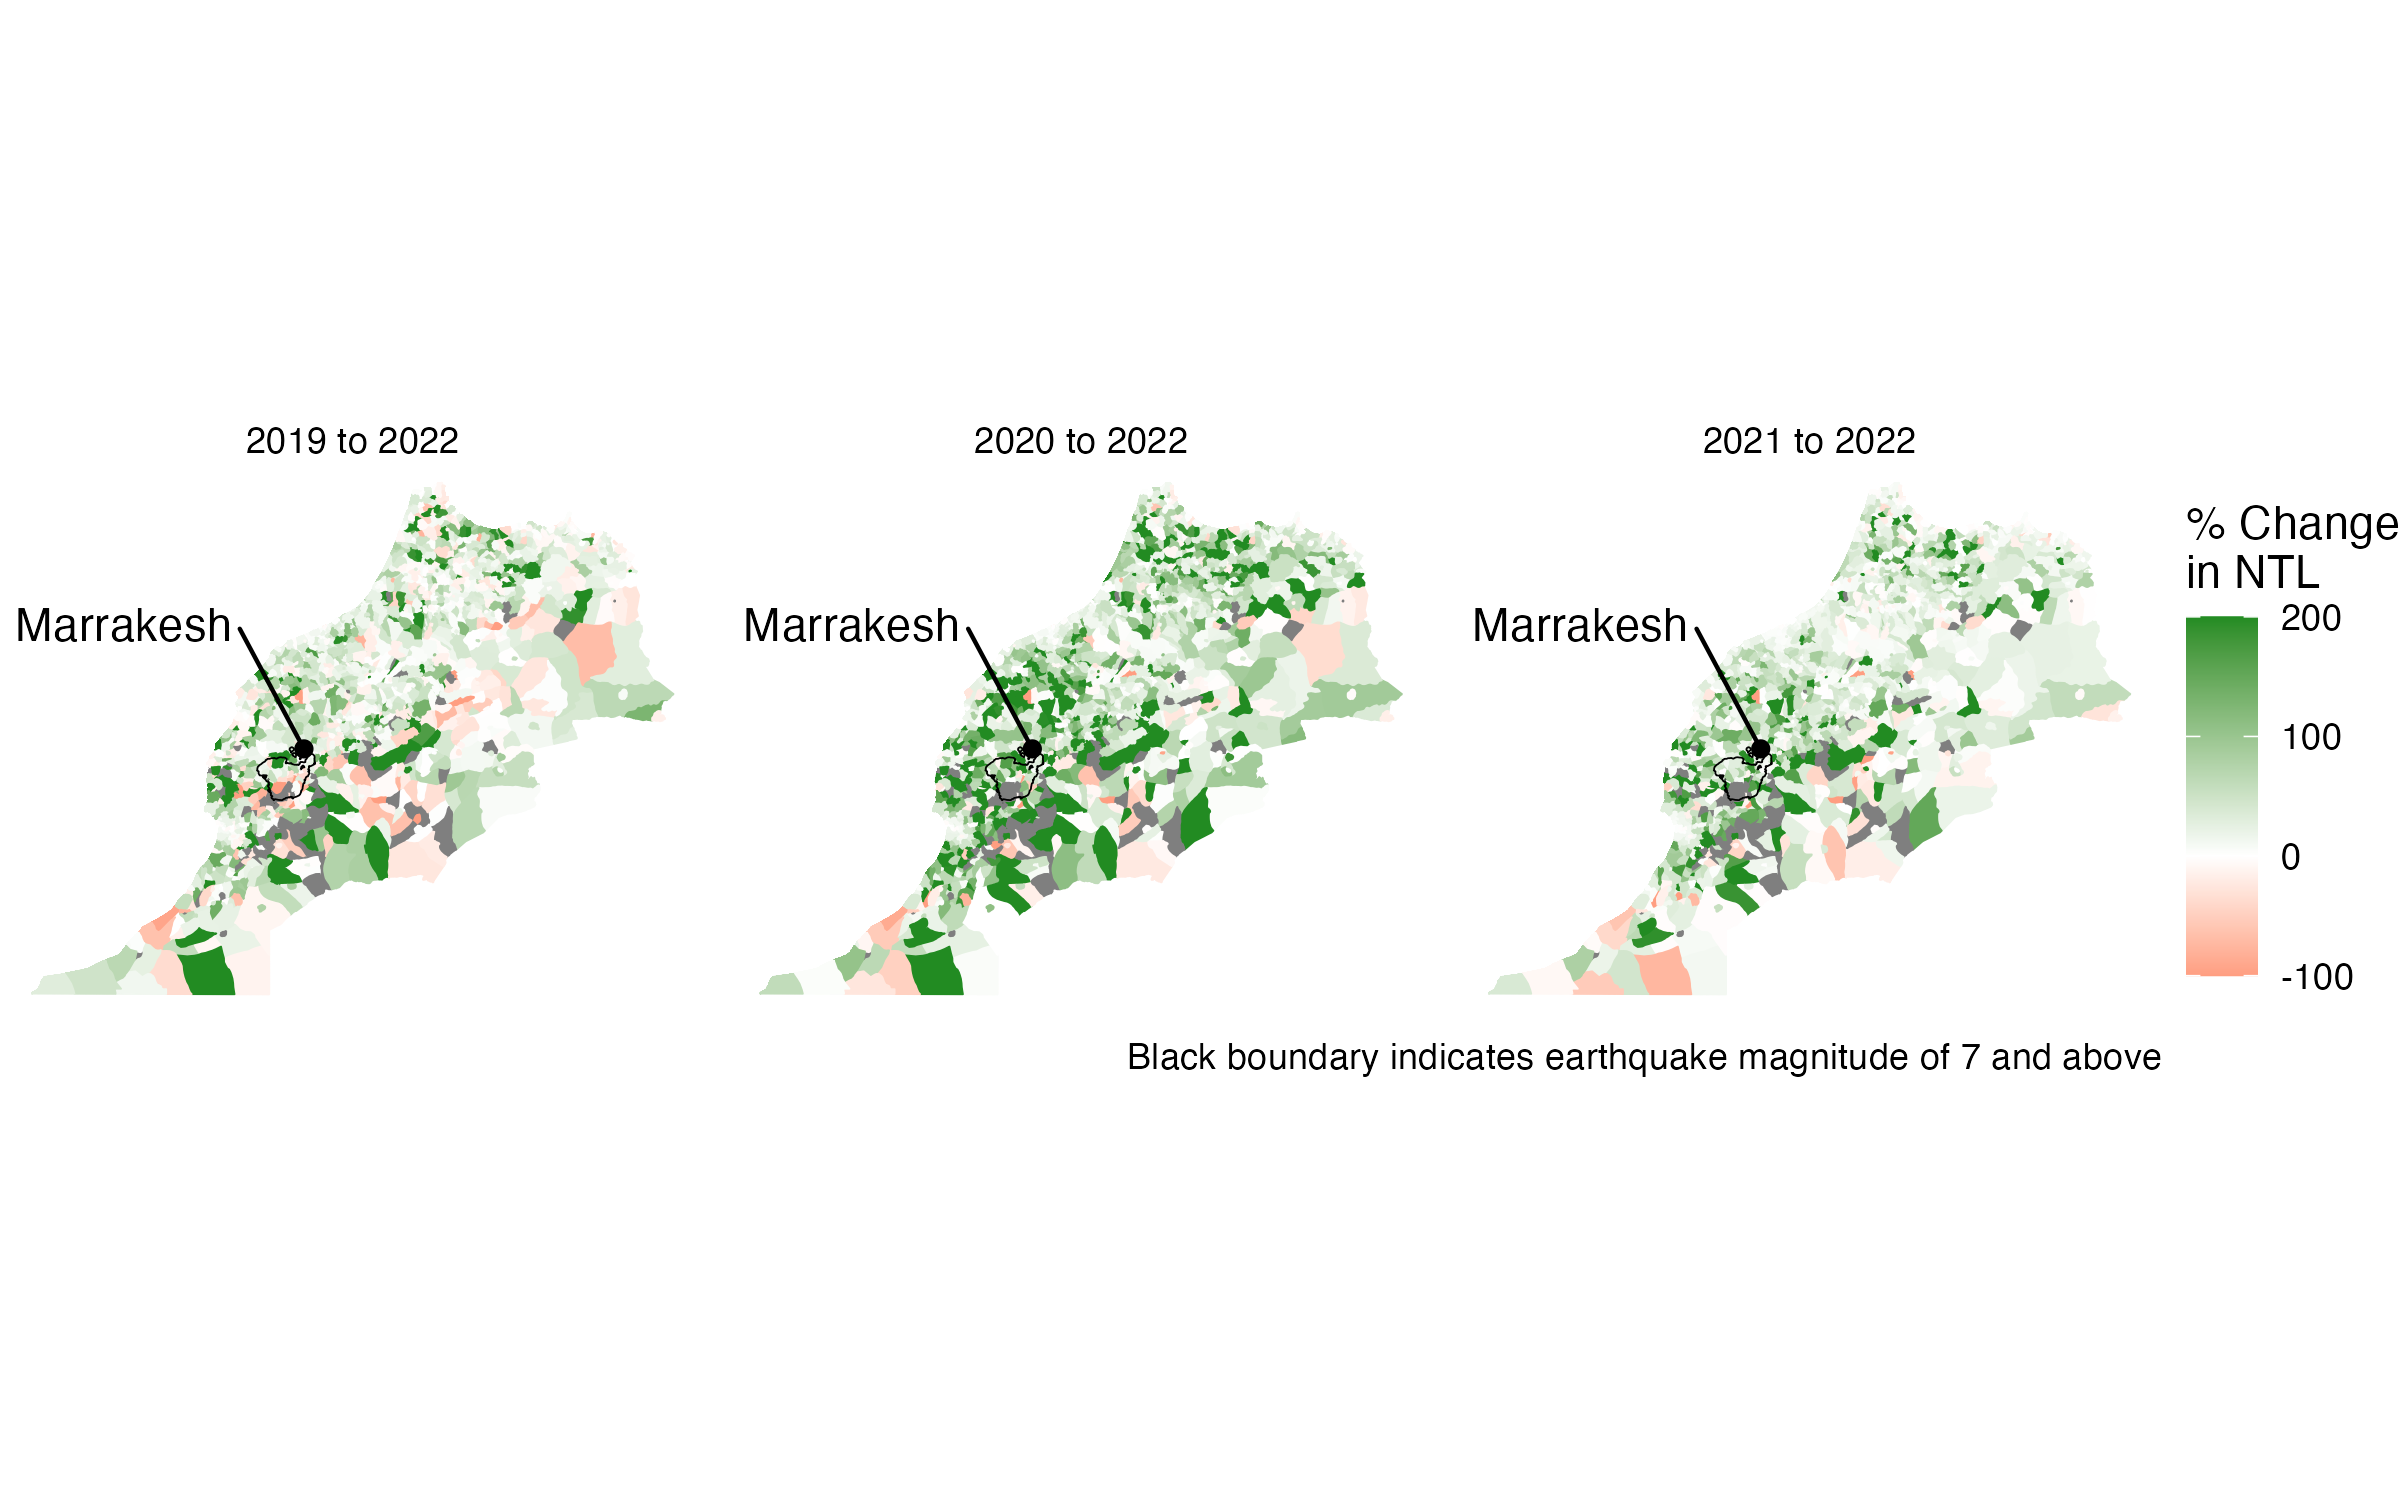
Fig. 15 Percent Change in Nighttime Lights: ADM 4#
Proportion of lights in earthquake impacted areas#
The sum of nighttime lights in earthquake impacts areas (ie, areas where the intensity is rated 7 or above) is: 37914.54
The sum of nighttime lights in all of Morocco is: 10999127
Consequently, the proportion of nighttime lights in earthquake impacted areas is: (37914 / 10999127) = 0.00344 (or 0.344%).