Premise Crowdsourced Surveys#
Premise crowdsourced surveys are a way of validating, verifying the ground truth and understanding the needs of people on ground, especially in regions impacted by a crisis
Community Needs Survey#
Show code cell source
import textwrap
from matplotlib.lines import Line2D

fig, axs = plt.subplots(2,3,figsize=(20,12))
ax = axs.flatten()
plt.rcParams["font.family"] = "Georgia"

ei_adm4.plot(column='PARAMVALUE', cmap = 'Reds', ax=ax[0], legend = True, alpha = 0.5)

for idx, column in enumerate(community_needs_coi):

    response_list = list(gdf[column].unique())
    morocco_adm3.boundary.plot(ax=ax[idx], edgecolor = '#D3D3D3', linewidth=0.5)

    unique_values = gdf[column].unique()

    custom_colors = ['#1f77b4', '#2ca02c', '#9467bd', '#ff7f0e']

    color_dict = {value: custom_colors[i % len(custom_colors)] for i, value in enumerate(unique_values)}

    for value in unique_values:
        # Create a separate plot for each unique value
        subset = gdf[gdf[column] == value]
        subset.plot(ax=ax[idx], alpha=0.5, label=value, legend=True, marker='o', markersize=20, color=color_dict[value])

    #gdf[standard_coi+community_needs_coi].plot(ax=ax[idx], column = column, legend = True, cmap='viridis')


    title = column.replace('_', ' ').title()
    wrapped_title = '\n'.join(textwrap.wrap(title, width=50))

    ax[idx].set_title(wrapped_title, loc = 'left', fontsize = 11)

    # print(gdf[column].unique())
    legend_labels = list(gdf[column].unique())
    handles = [Line2D([0], [0], marker='o', color='w', label=label, markerfacecolor=color_dict[label]) for label in legend_labels]
    ax[idx].legend(handles=handles, loc='upper left',  frameon=False)


    ax[idx].spines['top'].set_visible(False)
    ax[idx].spines['bottom'].set_visible(False)
    ax[idx].spines['right'].set_visible(False)
    ax[idx].spines['left'].set_visible(False)

    ax[idx].set_xticks([])
    ax[idx].set_yticks([])

plt.show()
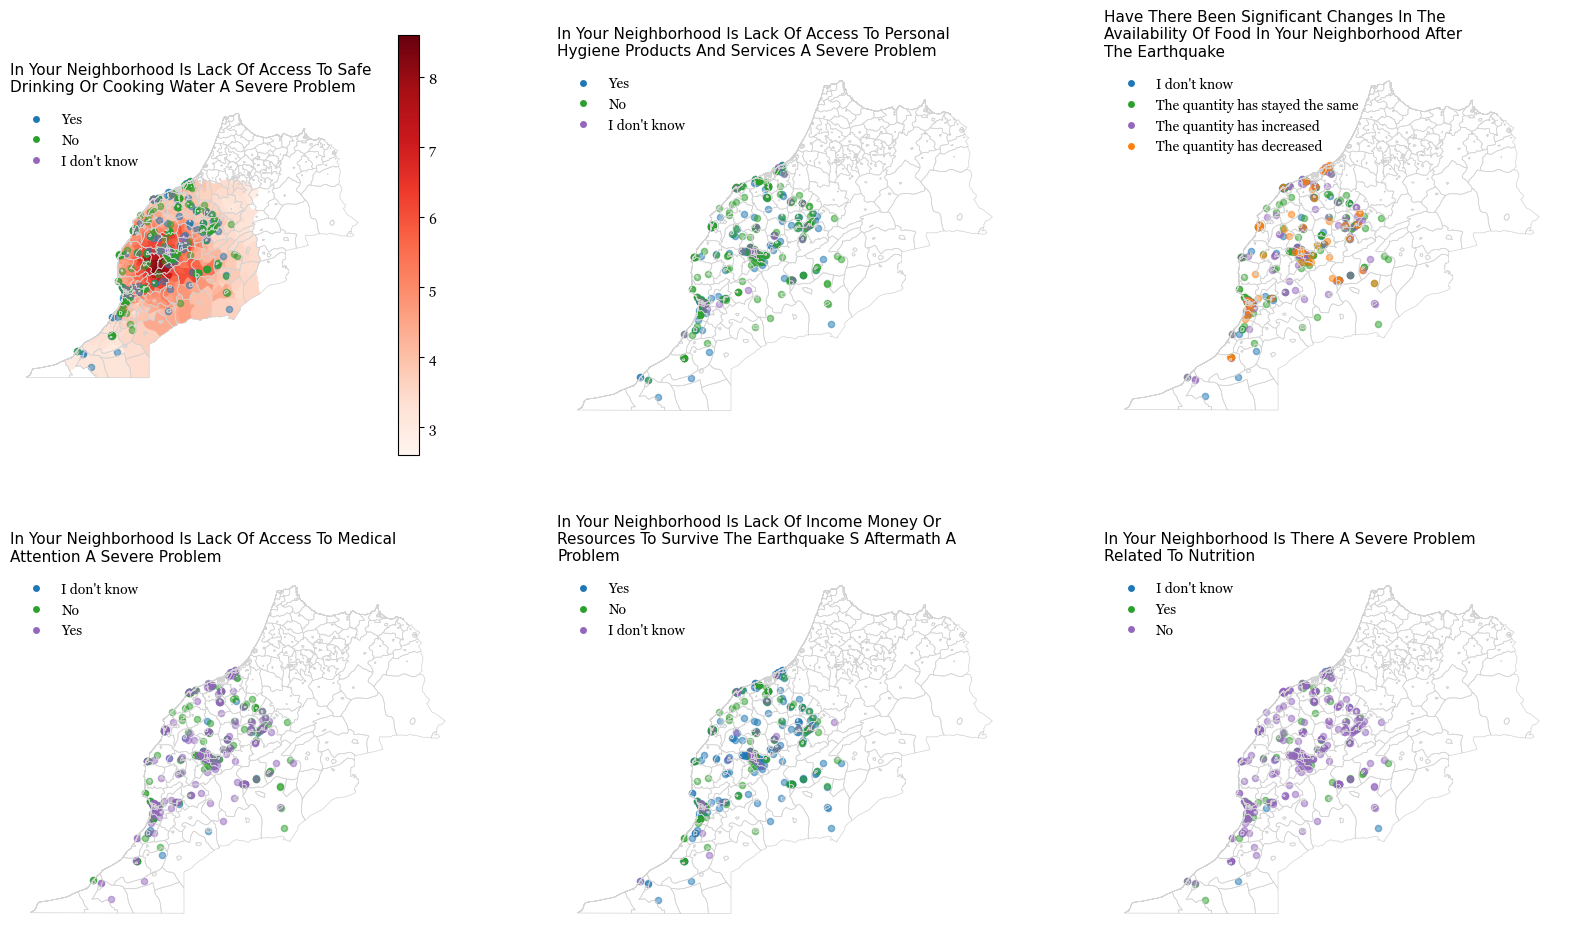
Observations:#
There seems to be few responses that report lack of nutrition, but a lot more that report shortage of money and medical services.
Google Trends data can be used to identfy need for ‘Water’, ‘Drinking Water’
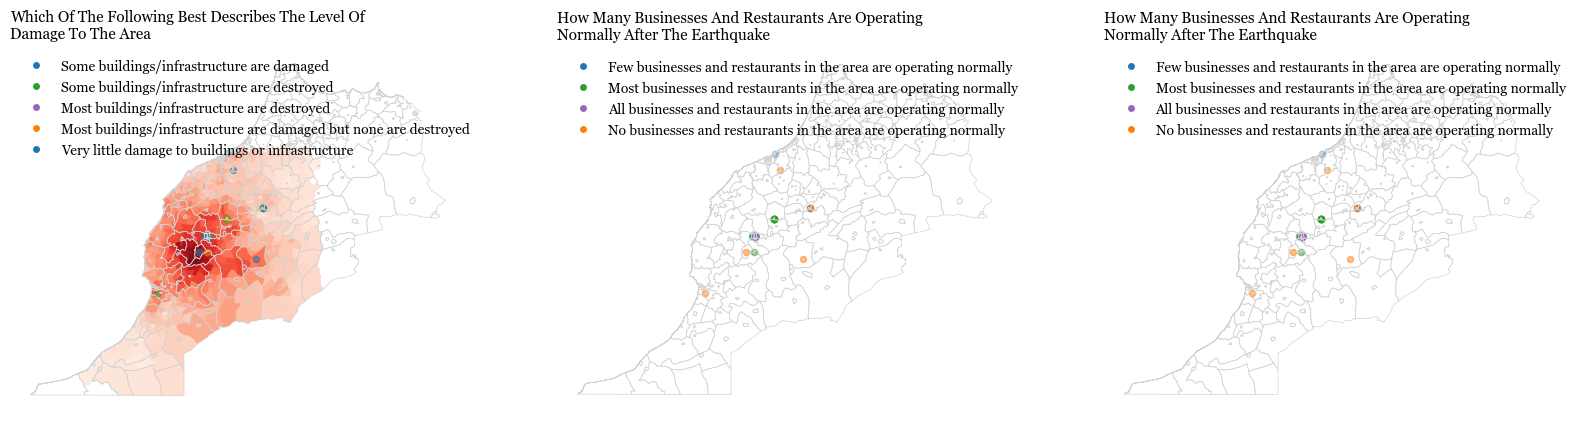
earthquake_damage_coi = ['which_of_the_following_best_describes_the_level_of_damage_to_the_area', 'how_many_businesses_and_restaurants_are_operating_normally_after_the_earthquake', 'how_many_businesses_and_restaurants_are_operating_normally_after_the_earthquake']
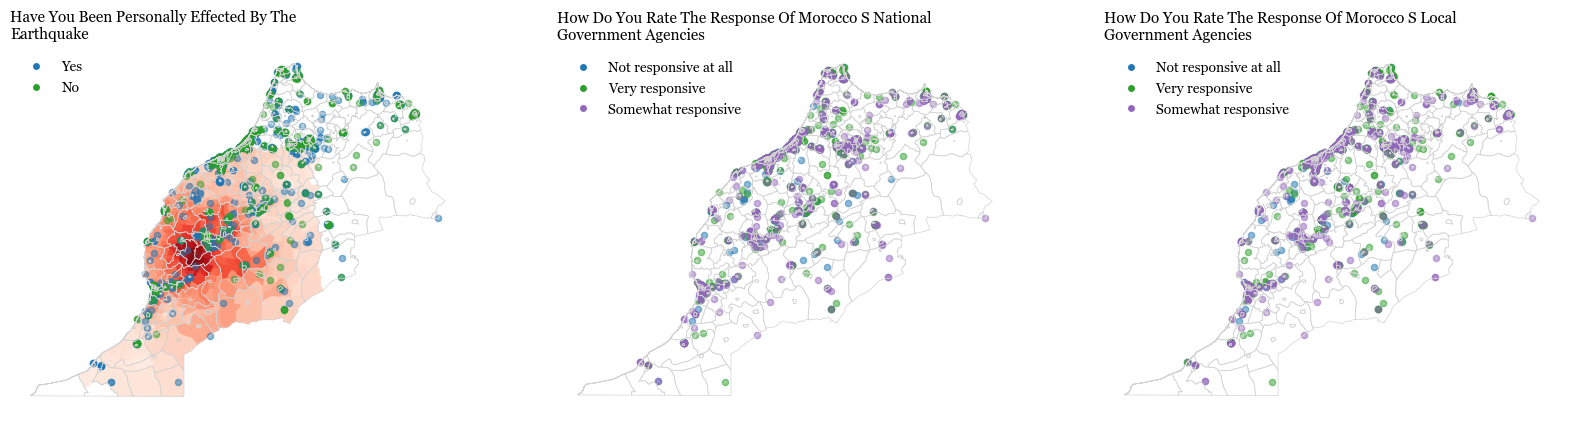
earthquake_relief_coi = ['have_you_been_personally_effected_by_the_earthquake','how_do_you_rate_the_response_of_morocco_s_national_government_agencies',
'how_do_you_rate_the_response_of_morocco_s_local_government_agencies']
hospitals_coi = ['how_safe_do_you_feel_in_this_area?']
fuel_coi = ['is_fuel_currently_available_for_sale_at_this_location']
fuel_prices = ['what_is_the_price_of_a_liter_of_petrol', 'what_is_the_price_of_a_liter_of_diesel']
Earthquake Damage#
Show code cell source
import textwrap
from matplotlib.lines import Line2D

fig, axs = plt.subplots(1,3,figsize=(20,12))
ax = axs.flatten()
plt.rcParams["font.family"] = "Georgia"

ei_adm4.plot(column='PARAMVALUE', cmap = 'Reds', ax=ax[0],alpha = 0.5)

for idx, column in enumerate(earthquake_damage_coi):

    morocco_adm3.boundary.plot(ax=ax[idx], edgecolor = '#D3D3D3', linewidth=0.5)

    df = gdf.dropna(subset=column)

    unique_values = df[column].unique()

    custom_colors = ['#1f77b4', '#2ca02c', '#9467bd', '#ff7f0e']

    color_dict = {value: custom_colors[i % len(custom_colors)] for i, value in enumerate(unique_values)}

    for value in unique_values:
        # Create a separate plot for each unique value
        subset = df[df[column] == value]
        subset.plot(ax=ax[idx], alpha=0.5, label=value, legend=True, marker='o', markersize=20, color=color_dict[value])

    #gdf[standard_coi+community_needs_coi].plot(ax=ax[idx], column = column, legend = True, cmap='viridis')


    title = column.replace('_', ' ').title()
    wrapped_title = '\n'.join(textwrap.wrap(title, width=50))

    ax[idx].set_title(wrapped_title, loc = 'left', fontsize = 11)

    # print(gdf[column].unique())
    legend_labels = list(df[column].unique())
    handles = [Line2D([0], [0], marker='o', color='w', label=label, markerfacecolor=color_dict[label]) for label in legend_labels]
    ax[idx].legend(handles=handles, loc='upper left',  frameon=False)


    ax[idx].spines['top'].set_visible(False)
    ax[idx].spines['bottom'].set_visible(False)
    ax[idx].spines['right'].set_visible(False)
    ax[idx].spines['left'].set_visible(False)

    ax[idx].set_xticks([])
    ax[idx].set_yticks([])

plt.show()
Earthquake Relief#
Show code cell source
import textwrap
from matplotlib.lines import Line2D

fig, axs = plt.subplots(1,3,figsize=(20,12))
ax = axs#.flatten()
plt.rcParams["font.family"] = "Georgia"

ei_adm4.plot(column='PARAMVALUE', cmap = 'Reds', ax=ax[0],alpha = 0.5)

for idx, column in enumerate(earthquake_relief_coi):

    morocco_adm3.boundary.plot(ax=ax[idx], edgecolor = '#D3D3D3', linewidth=0.5)

    df = gdf.dropna(subset=column)

    unique_values = df[column].unique()

    custom_colors = ['#1f77b4', '#2ca02c', '#9467bd', '#ff7f0e']

    color_dict = {value: custom_colors[i % len(custom_colors)] for i, value in enumerate(unique_values)}

    for value in unique_values:
        # Create a separate plot for each unique value
        subset = df[df[column] == value]
        subset.plot(ax=ax[idx], alpha=0.5, label=value, legend=True, marker='o', markersize=20, color=color_dict[value])

    #gdf[standard_coi+community_needs_coi].plot(ax=ax[idx], column = column, legend = True, cmap='viridis')


    title = column.replace('_', ' ').title()
    wrapped_title = '\n'.join(textwrap.wrap(title, width=50))

    ax[idx].set_title(wrapped_title, loc = 'left', fontsize = 11)

    # print(gdf[column].unique())
    legend_labels = list(df[column].unique())
    handles = [Line2D([0], [0], marker='o', color='w', label=label, markerfacecolor=color_dict[label]) for label in legend_labels]
    ax[idx].legend(handles=handles, loc='upper left',  frameon=False)


    ax[idx].spines['top'].set_visible(False)
    ax[idx].spines['bottom'].set_visible(False)
    ax[idx].spines['right'].set_visible(False)
    ax[idx].spines['left'].set_visible(False)

    ax[idx].set_xticks([])
    ax[idx].set_yticks([])

plt.show()