Air Pollution in Algeria#
Methodology#
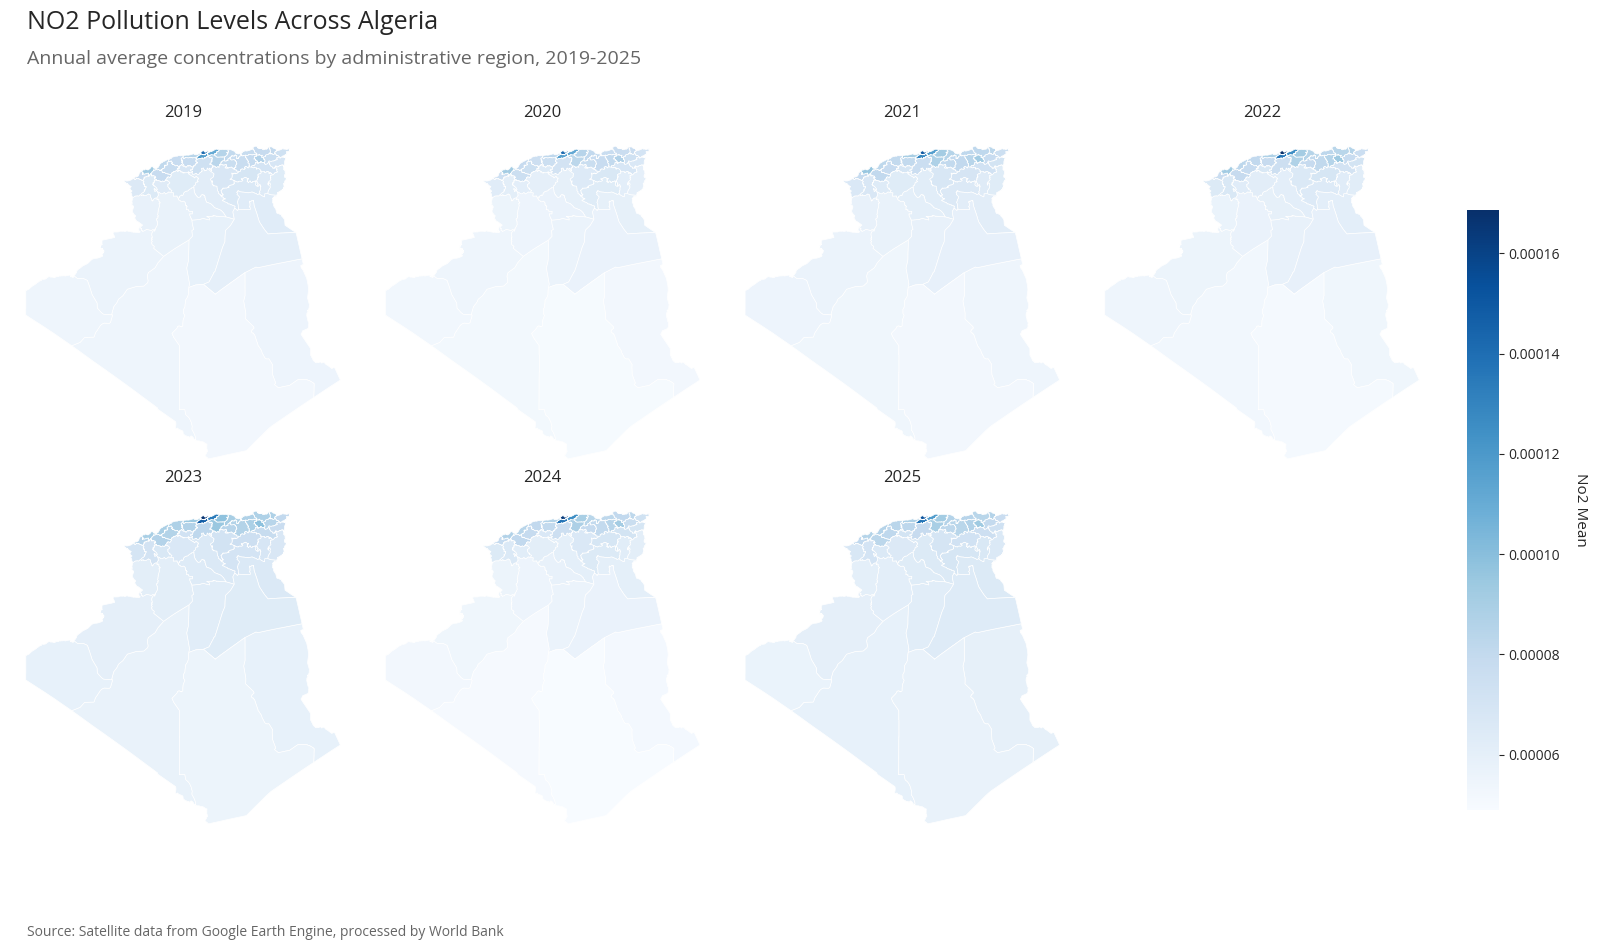
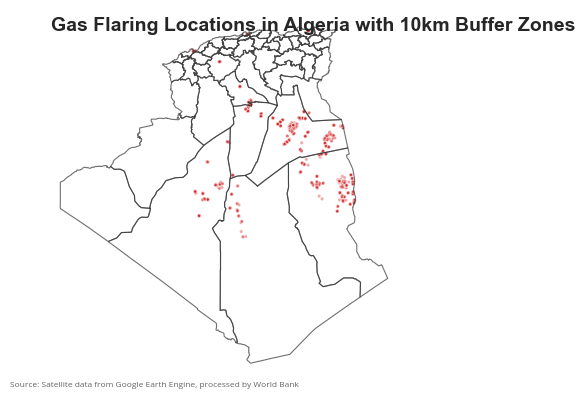
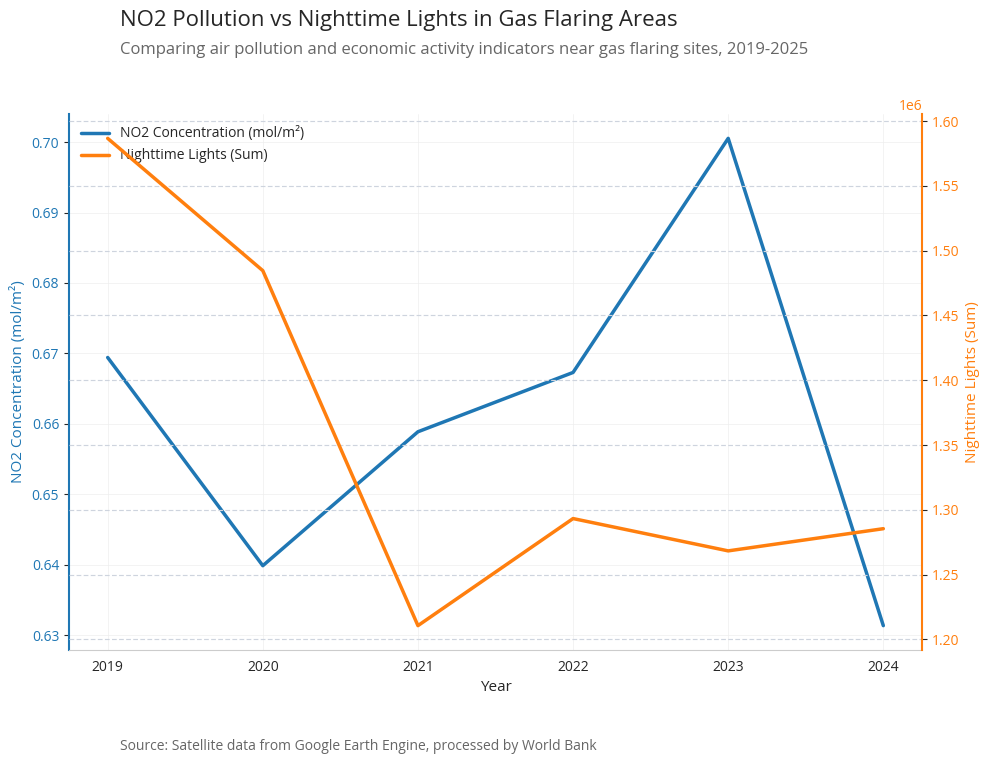
This analysis examines NO2 (nitrogen dioxide) pollution levels across Algeria from 2019-2025 using satellite data from the Sentinel-5P TROPOMI instrument via Google Earth Engine. We processed monthly NO2 column number density measurements at high spatial resolution, matched monitoring points to administrative boundaries (provinces and districts), and aggregated the data to identify pollution patterns. Special attention was given to areas near gas flaring sites, where we analyzed the relationship between NO2 concentrations and nighttime lights as a proxy for economic activity. The analysis reveals temporal trends, spatial distributions, and regional variations in air quality across Algeria.
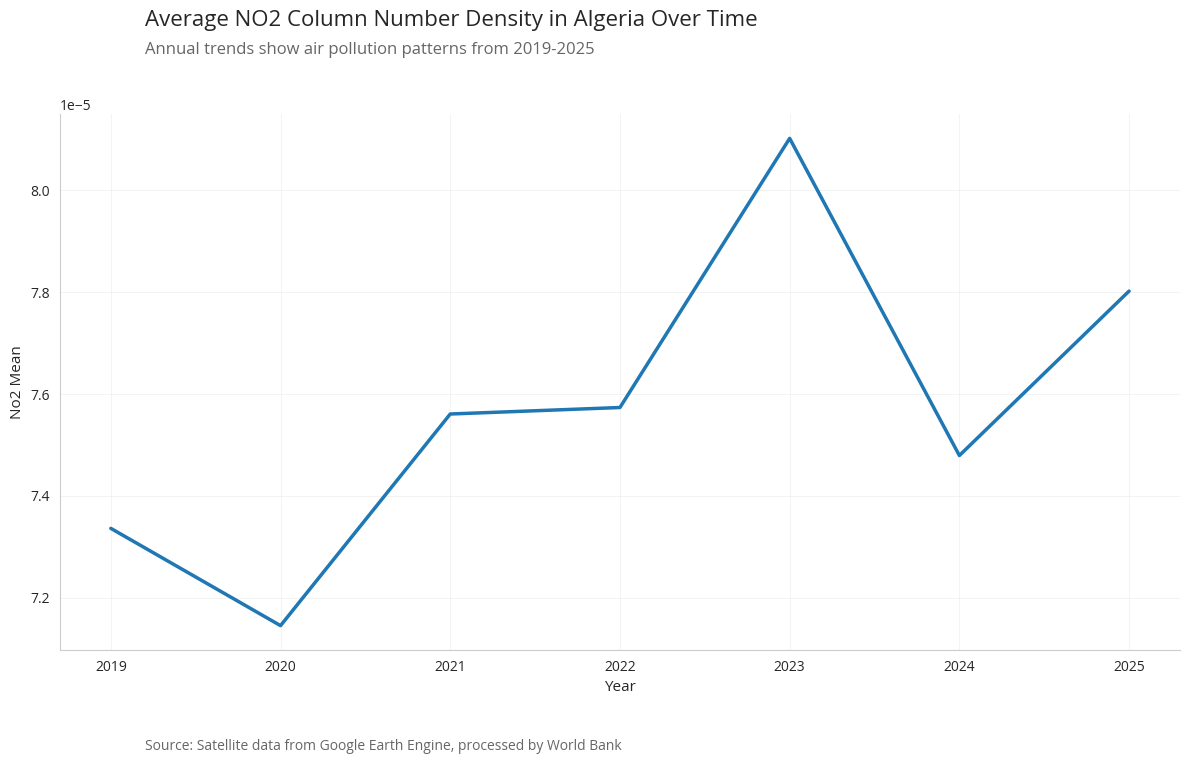
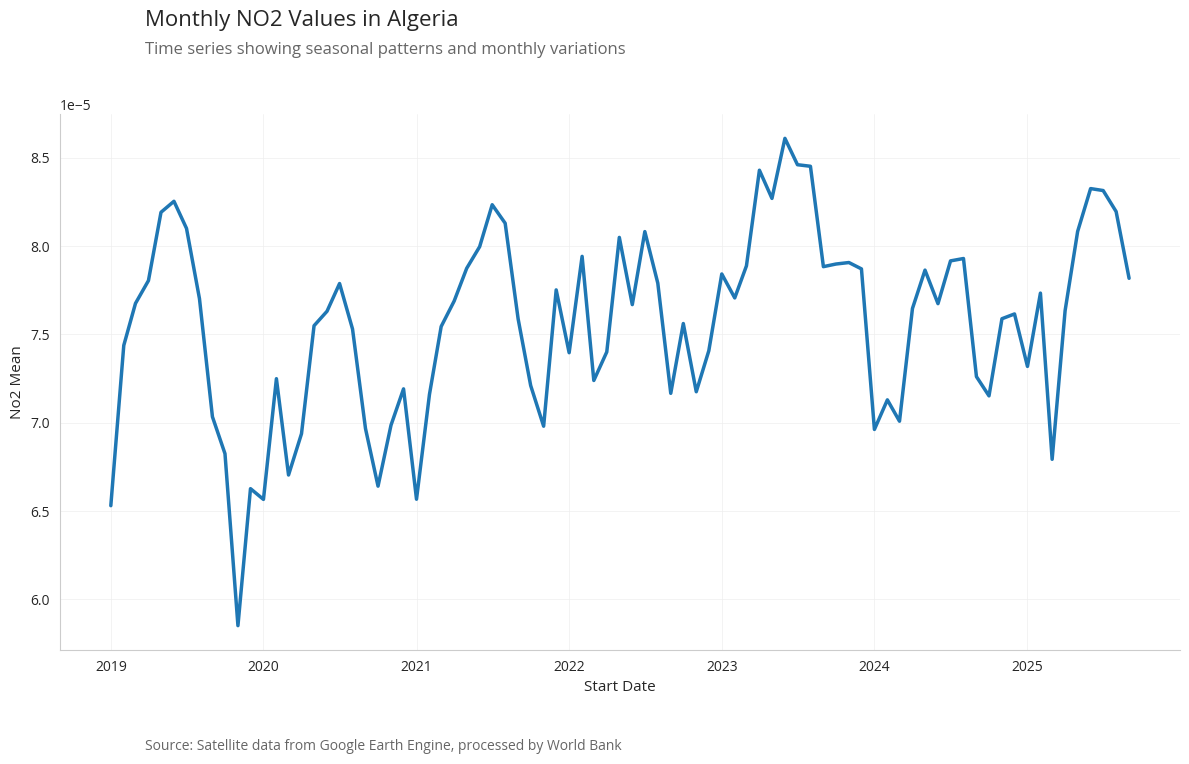
National Trends in NO2#
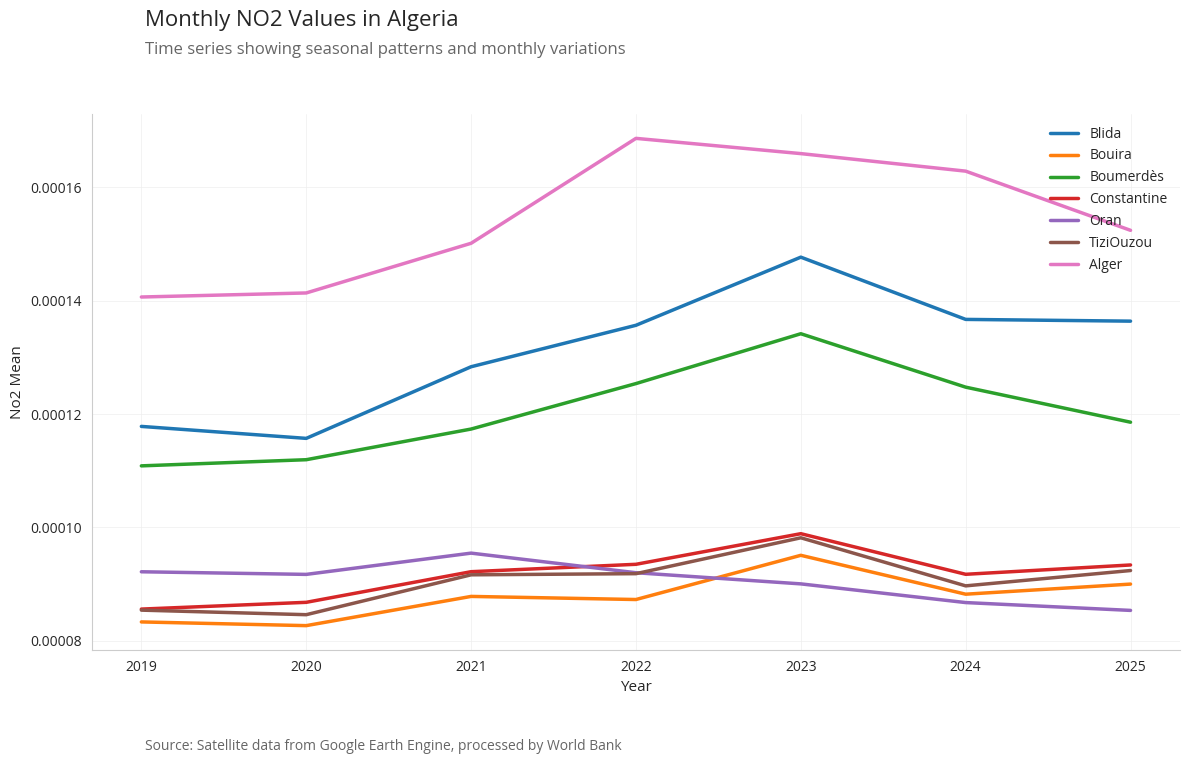
Wilaya Trends in NO2#
/Users/ssarva/algeria-economic-monitoring/notebooks/emissions/visuals.py:98: UserWarning: This figure includes Axes that are not compatible with tight_layout, so results might be incorrect.
  # Axis labels
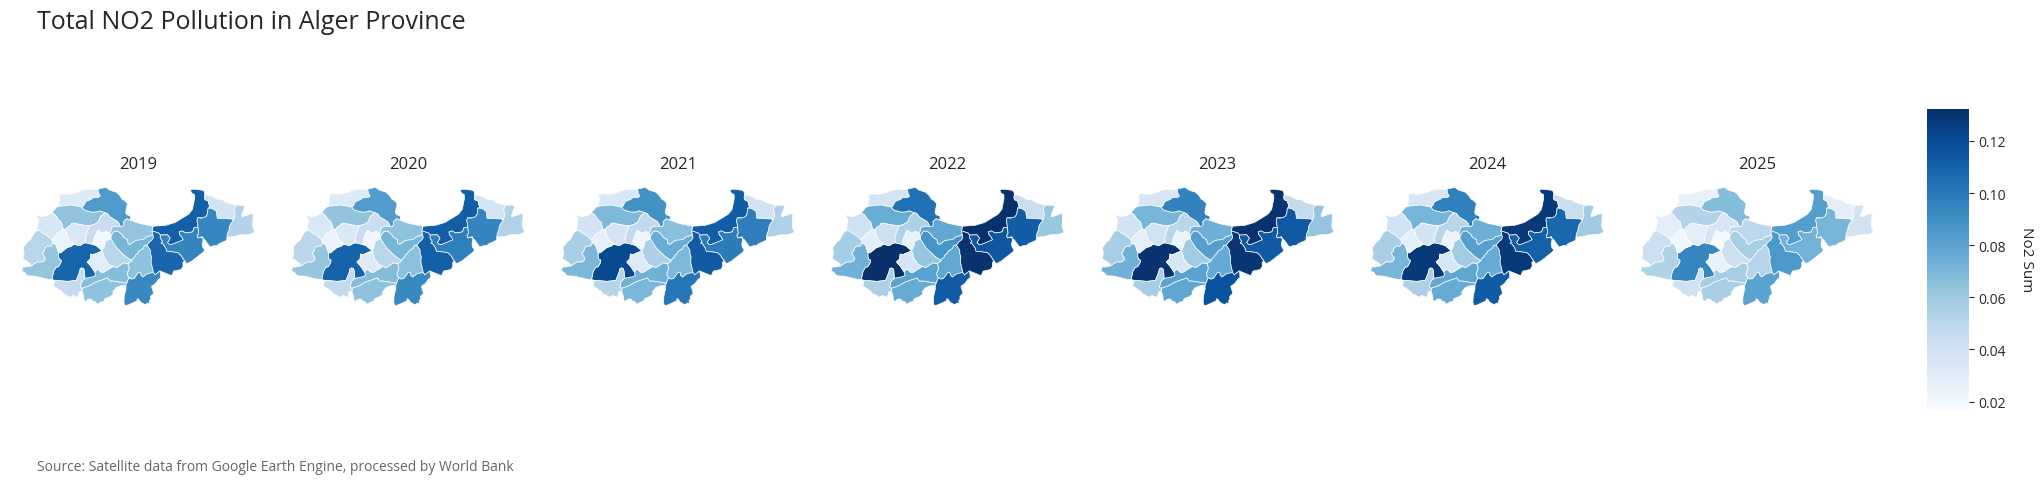
Pollution in Alger#
/Users/ssarva/algeria-economic-monitoring/notebooks/emissions/visuals.py:98: UserWarning: This figure includes Axes that are not compatible with tight_layout, so results might be incorrect.
  # Axis labels
/Users/ssarva/algeria-economic-monitoring/notebooks/emissions/visuals.py:98: UserWarning: This figure includes Axes that are not compatible with tight_layout, so results might be incorrect.
  # Axis labels

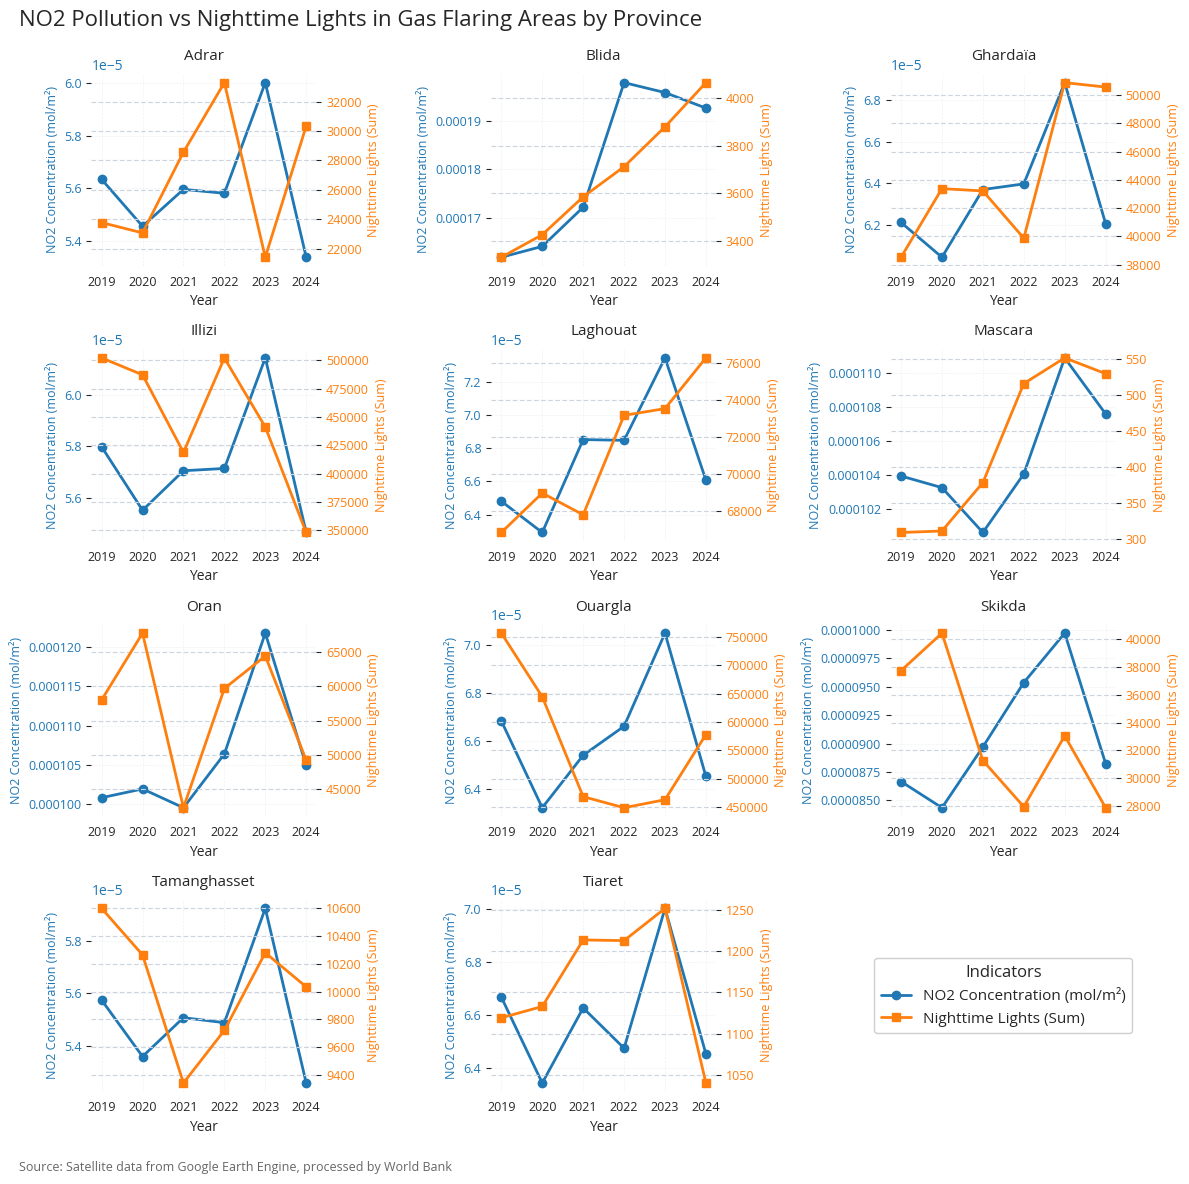
Pollution in Gas Flaring Locations#
Creating subplots for 11 categories