Crop Land Area Change and Deforestation#
This notebook presents an analysis of cropland expansion and deforestation trends across Bolivia at the ADM3 level (municipalities) from 2015 to 2024, using land cover datasets and Sentinel-1 radar data. The objective is to track land-use changes and identify regions of significant agricultural transformation.
Author: Pietro Milillo, Assistant Professor, University of Houston and Short Term Consultant for Worldbank
Data#
Land Cover#
GLC_FCS30D (2015–2022): High-resolution 30m annual global land cover product distinguishing cropland types (rainfed, herbaceous, orchard, irrigated).
Source: Zhang et al., 2023.
Shapefiles#
Bolivia Administrative Boundaries (ADM3): Obtained from geoBoundaries, delineating municipal units for aggregation.
Deforestation Map#
Global Forest Watch (GFW), Hansen Global Forest Change v1.10: Used for deforestation validation and cross-comparison with Sentinel-1 and GLC_FCS30D datasets.
Methodology#
We implemented the Sentinel-1 change detection repository and developed custom Python scripts using the following libraries:
geopandas,rasterio,pandas,matplotlib
Key Steps:#
Cropland classification extracted per ADM3 using GLC_FCS30D.
Area (km²) and percentage metrics computed annually.
Ranking ADM3 units by cropland area and changes year-to-year.
Visual comparison of cropland distributions across time.
Sentinel-1 backscatter trend analysis (brightening/darkening) and cross-comparison with ESA and GFW datasets.
Insights#
a. 2015 vs 2024 (Map Panels)#
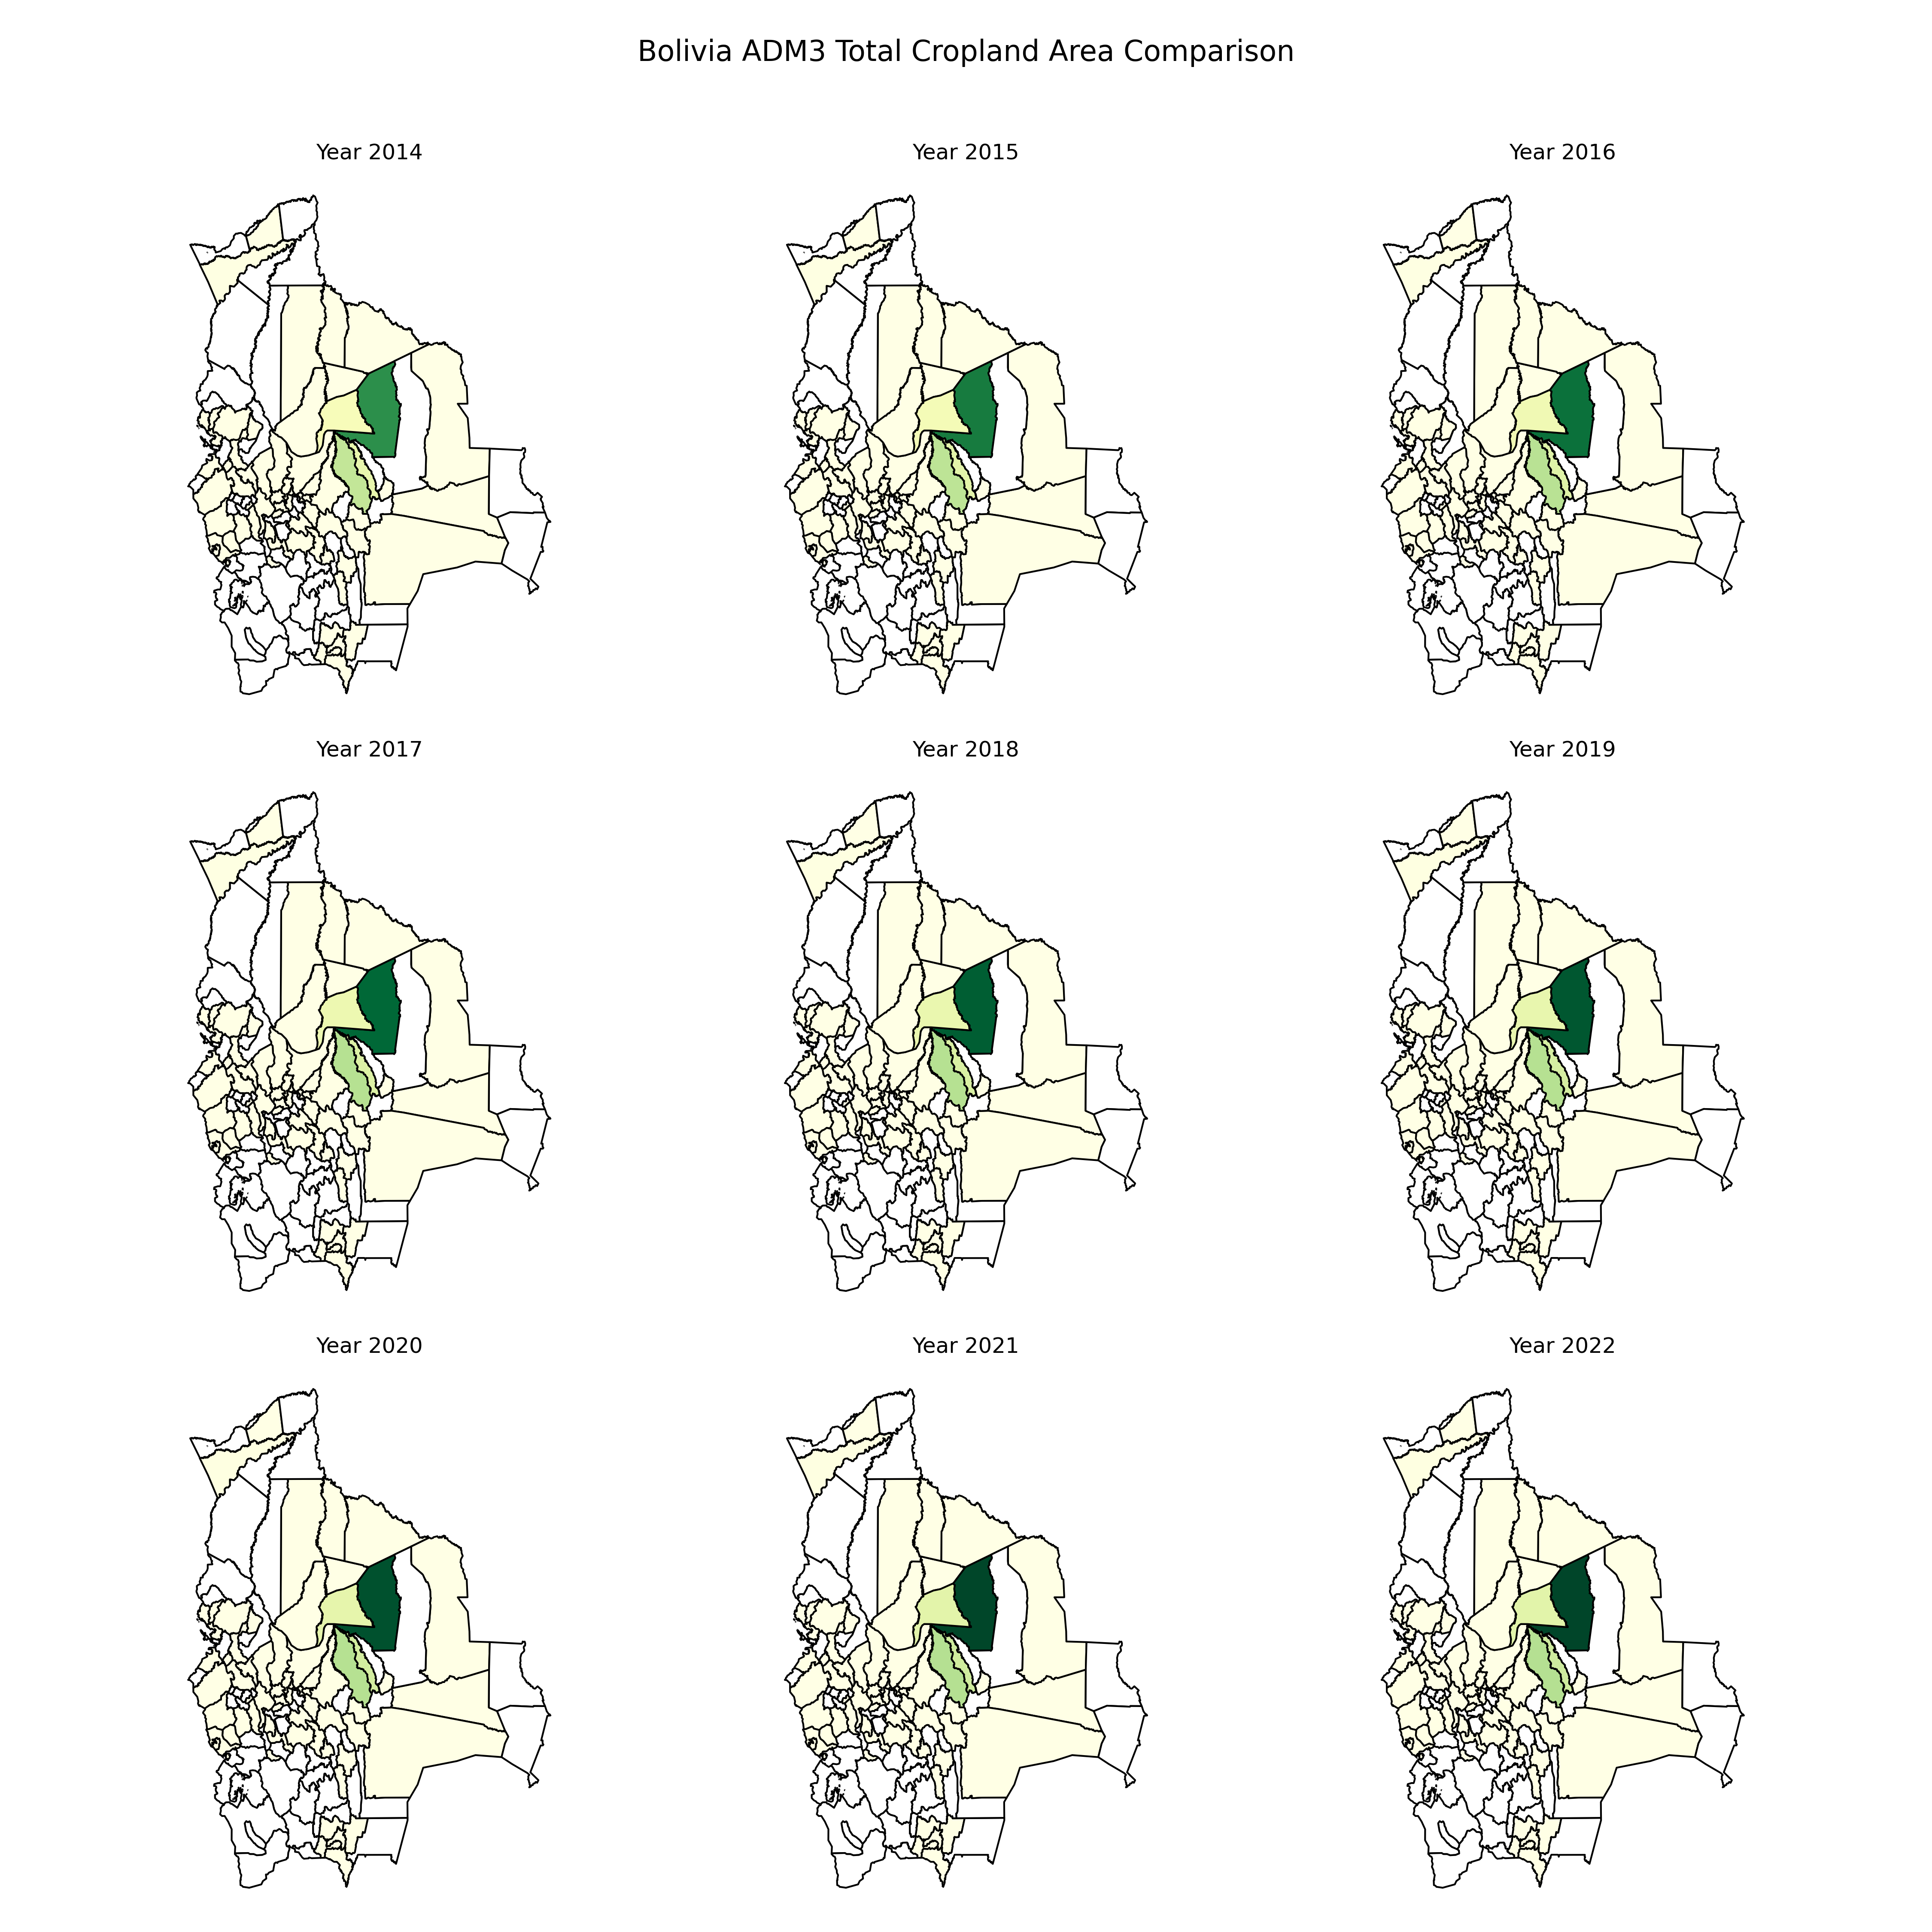
Multi-panel visualization of Bolivia’s cropland evolution from 2015 to 2022. Each panel shows spatial distribution of cropland classes at the ADM3 level. Scale goes from white (0) to green (1000) km²
b. Admin Regions that Gained the Most Cropland#
import pandas as pd

df_gainers = pd.read_csv('my_cropland_outputs/cropland_top_ADM_rankings.csv')
df_gainers.head(10)
| Year | Rank | ADMName | Total_Cropland_km2 | Cropland_pct_of_ADM | |
|---|---|---|---|---|---|
| 0 | 2014 | 1 | Guarayos | 1687.09 | 5.06 |
| 1 | 2014 | 2 | Ichilo | 747.98 | 4.93 |
| 2 | 2014 | 3 | Sara | 446.14 | 8.13 |
| 3 | 2014 | 4 | Ñuflo_De_Chávez | 430.94 | NaN |
| 4 | 2014 | 5 | Marbán | 291.04 | 1.74 |
| 5 | 2015 | 1 | Guarayos | 1869.95 | 5.61 |
| 6 | 2015 | 2 | Ichilo | 782.17 | 5.16 |
| 7 | 2015 | 3 | Sara | 495.34 | 9.03 |
| 8 | 2015 | 4 | Ñuflo_De_Chávez | 470.41 | NaN |
| 9 | 2015 | 5 | Marbán | 332.72 | 1.99 |
Example from 2022:
Rank |
ADMName |
Total Cropland (km²) |
% of ADM Area |
|---|---|---|---|
1 |
Guarayos |
2368.78 |
7.1% |
2 |
Ichilo |
839.22 |
5.54% |
3 |
Sara |
670.19 |
12.21% |
4 |
Nuflo De Chavez |
538.23 |
0.0% |
5 |
Marban |
503.2 |
3% |
c. Admin Regions that Lost the Most Cropland#
df_change = pd.read_csv('my_cropland_outputs/cropland_change_leaders.csv')
df_change.sort_values(by='Decrease_km2', ascending=True).head(10)
Year-over-year maximum losses:
Year |
Max Decrease ADM |
Decrease (km²) |
|---|---|---|
2018 |
Luis Calvo |
-4.98 |
2019 |
Luis Calvo |
-2.54 |
2020 |
Ichilo |
-2.18 |
2022 |
Angel Sandoval |
-0.54 |
d. Definitions and Cropland Type Trends#
Rainfed Cropland
Agricultural lands where crops depend solely on natural rainfall, without artificial irrigation. Includes major staple crops such as cereals, legumes, and tubers, showing strong seasonal dependence on precipitation.
Herbaceous Cropland
Cropland dominated by short-cycle, non-woody herbaceous crops, such as grasses, herbs, or forage species (e.g., alfalfa, clover), cultivated for food, fodder, or fiber. Excludes woody or perennial tree-based crops.
Orchard Cropland
Permanent cropland areas occupied by woody perennial crops, including fruit trees, nut trees, vineyards, coffee, or tea plantations. Managed for long-term production cycles, with distinct spatial patterns.
Irrigated Cropland
Agricultural lands where crops are grown using artificial irrigation systems (canals, sprinklers, drip systems, groundwater pumping), identifiable by spectral signatures indicating artificial water inputs and intensified cropping patterns.
Visualizing time series (example for Guarayos):
Guarayos
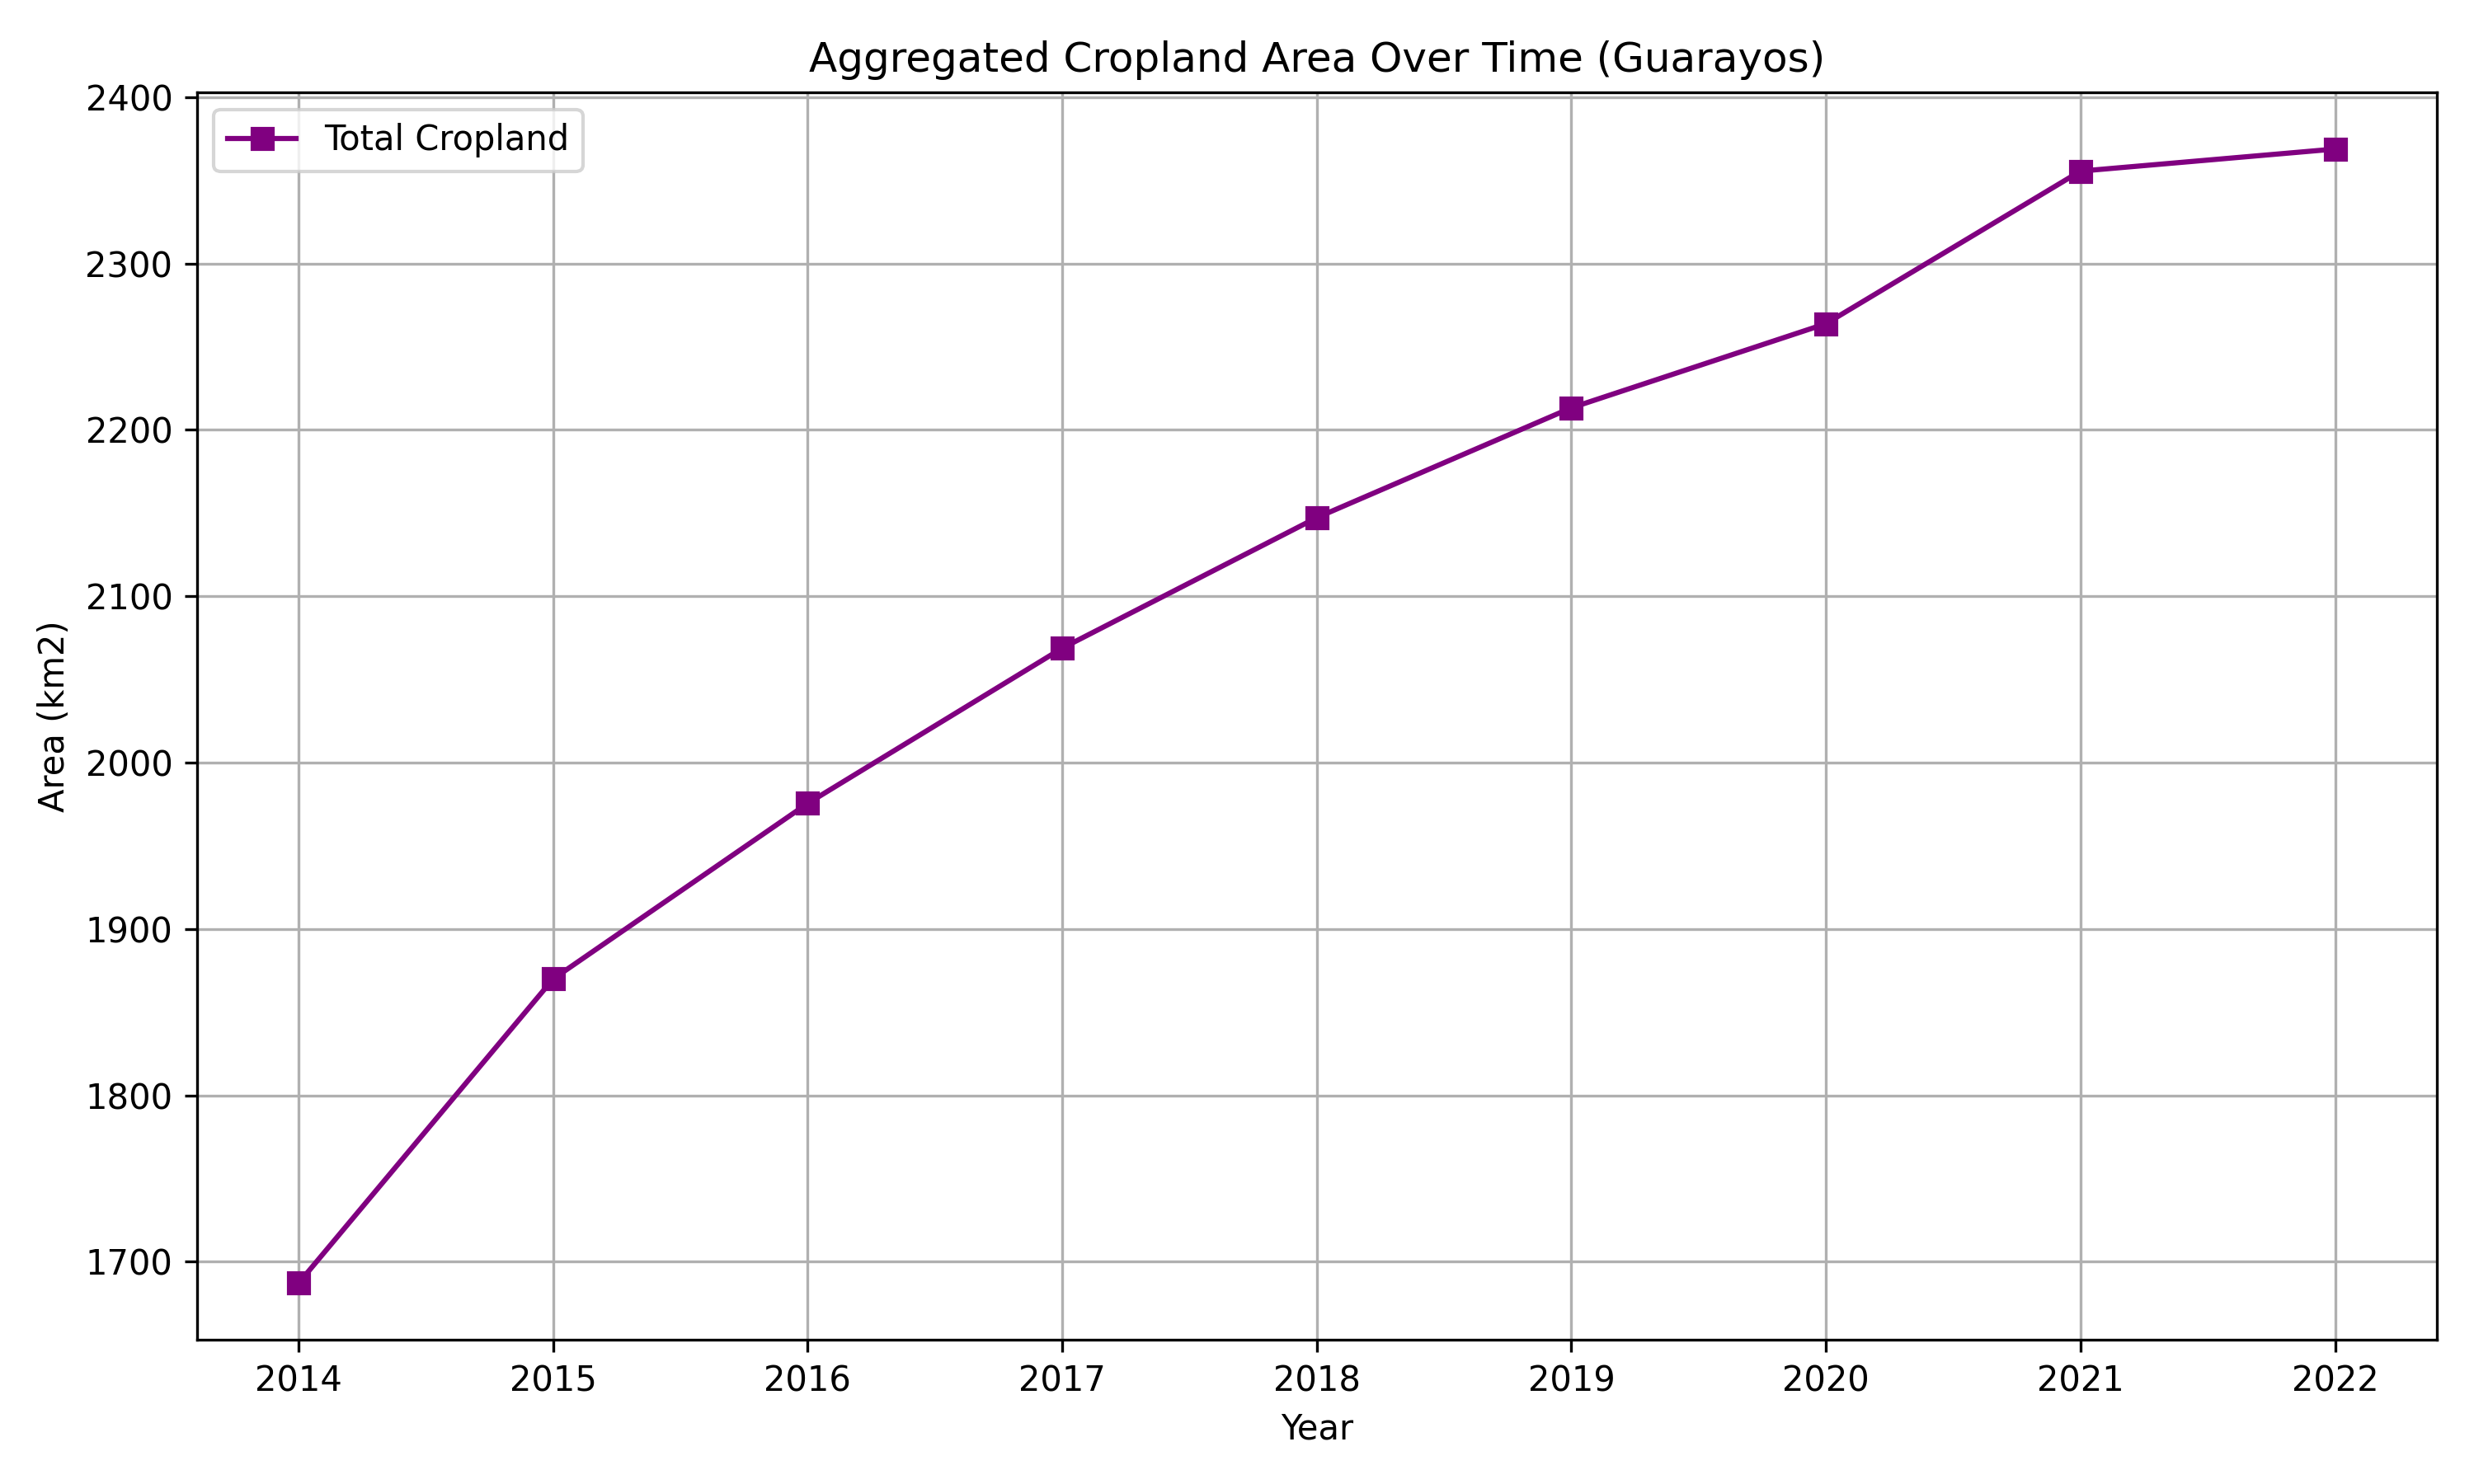
We generated time series plots for top cropland gainers (Guarayos, Ichilo, Sara, Nuflo De Chavez, Marban) and the top cropland losers year-to-year. These plots visualize the trends of agricultural expansion or contraction and help identify hotspots of change.
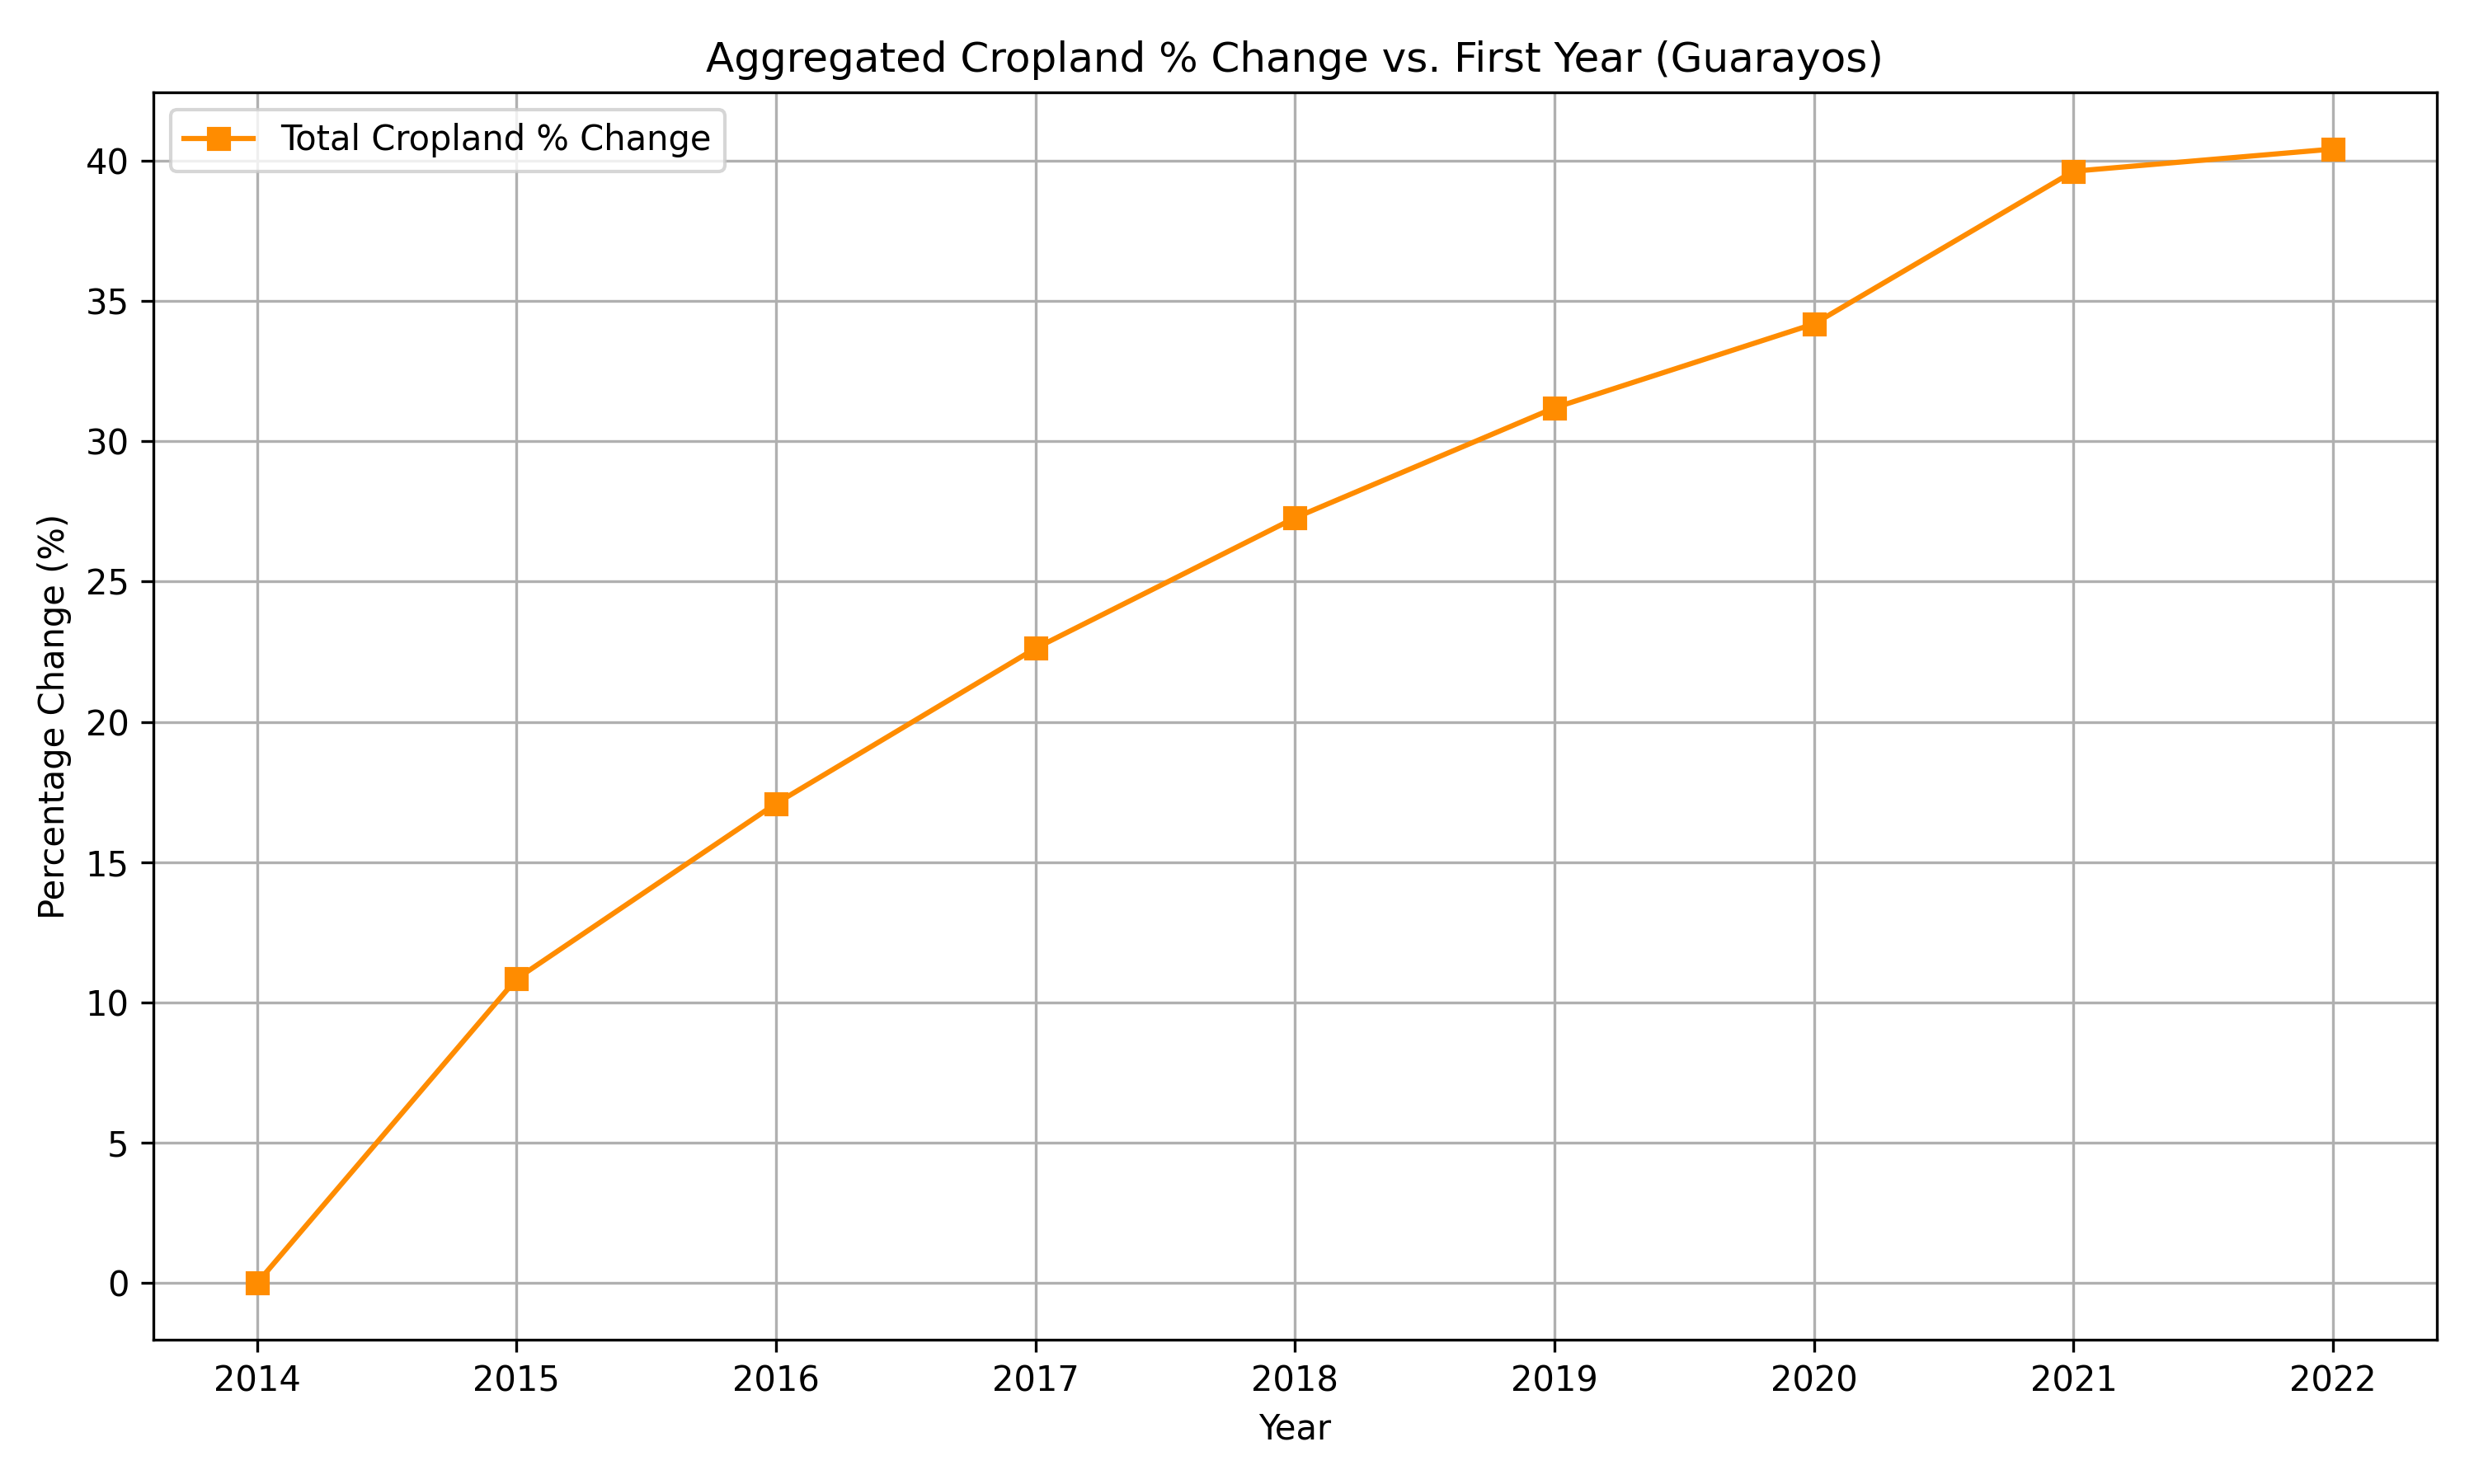
Aggregated Area % increase compared to 2014
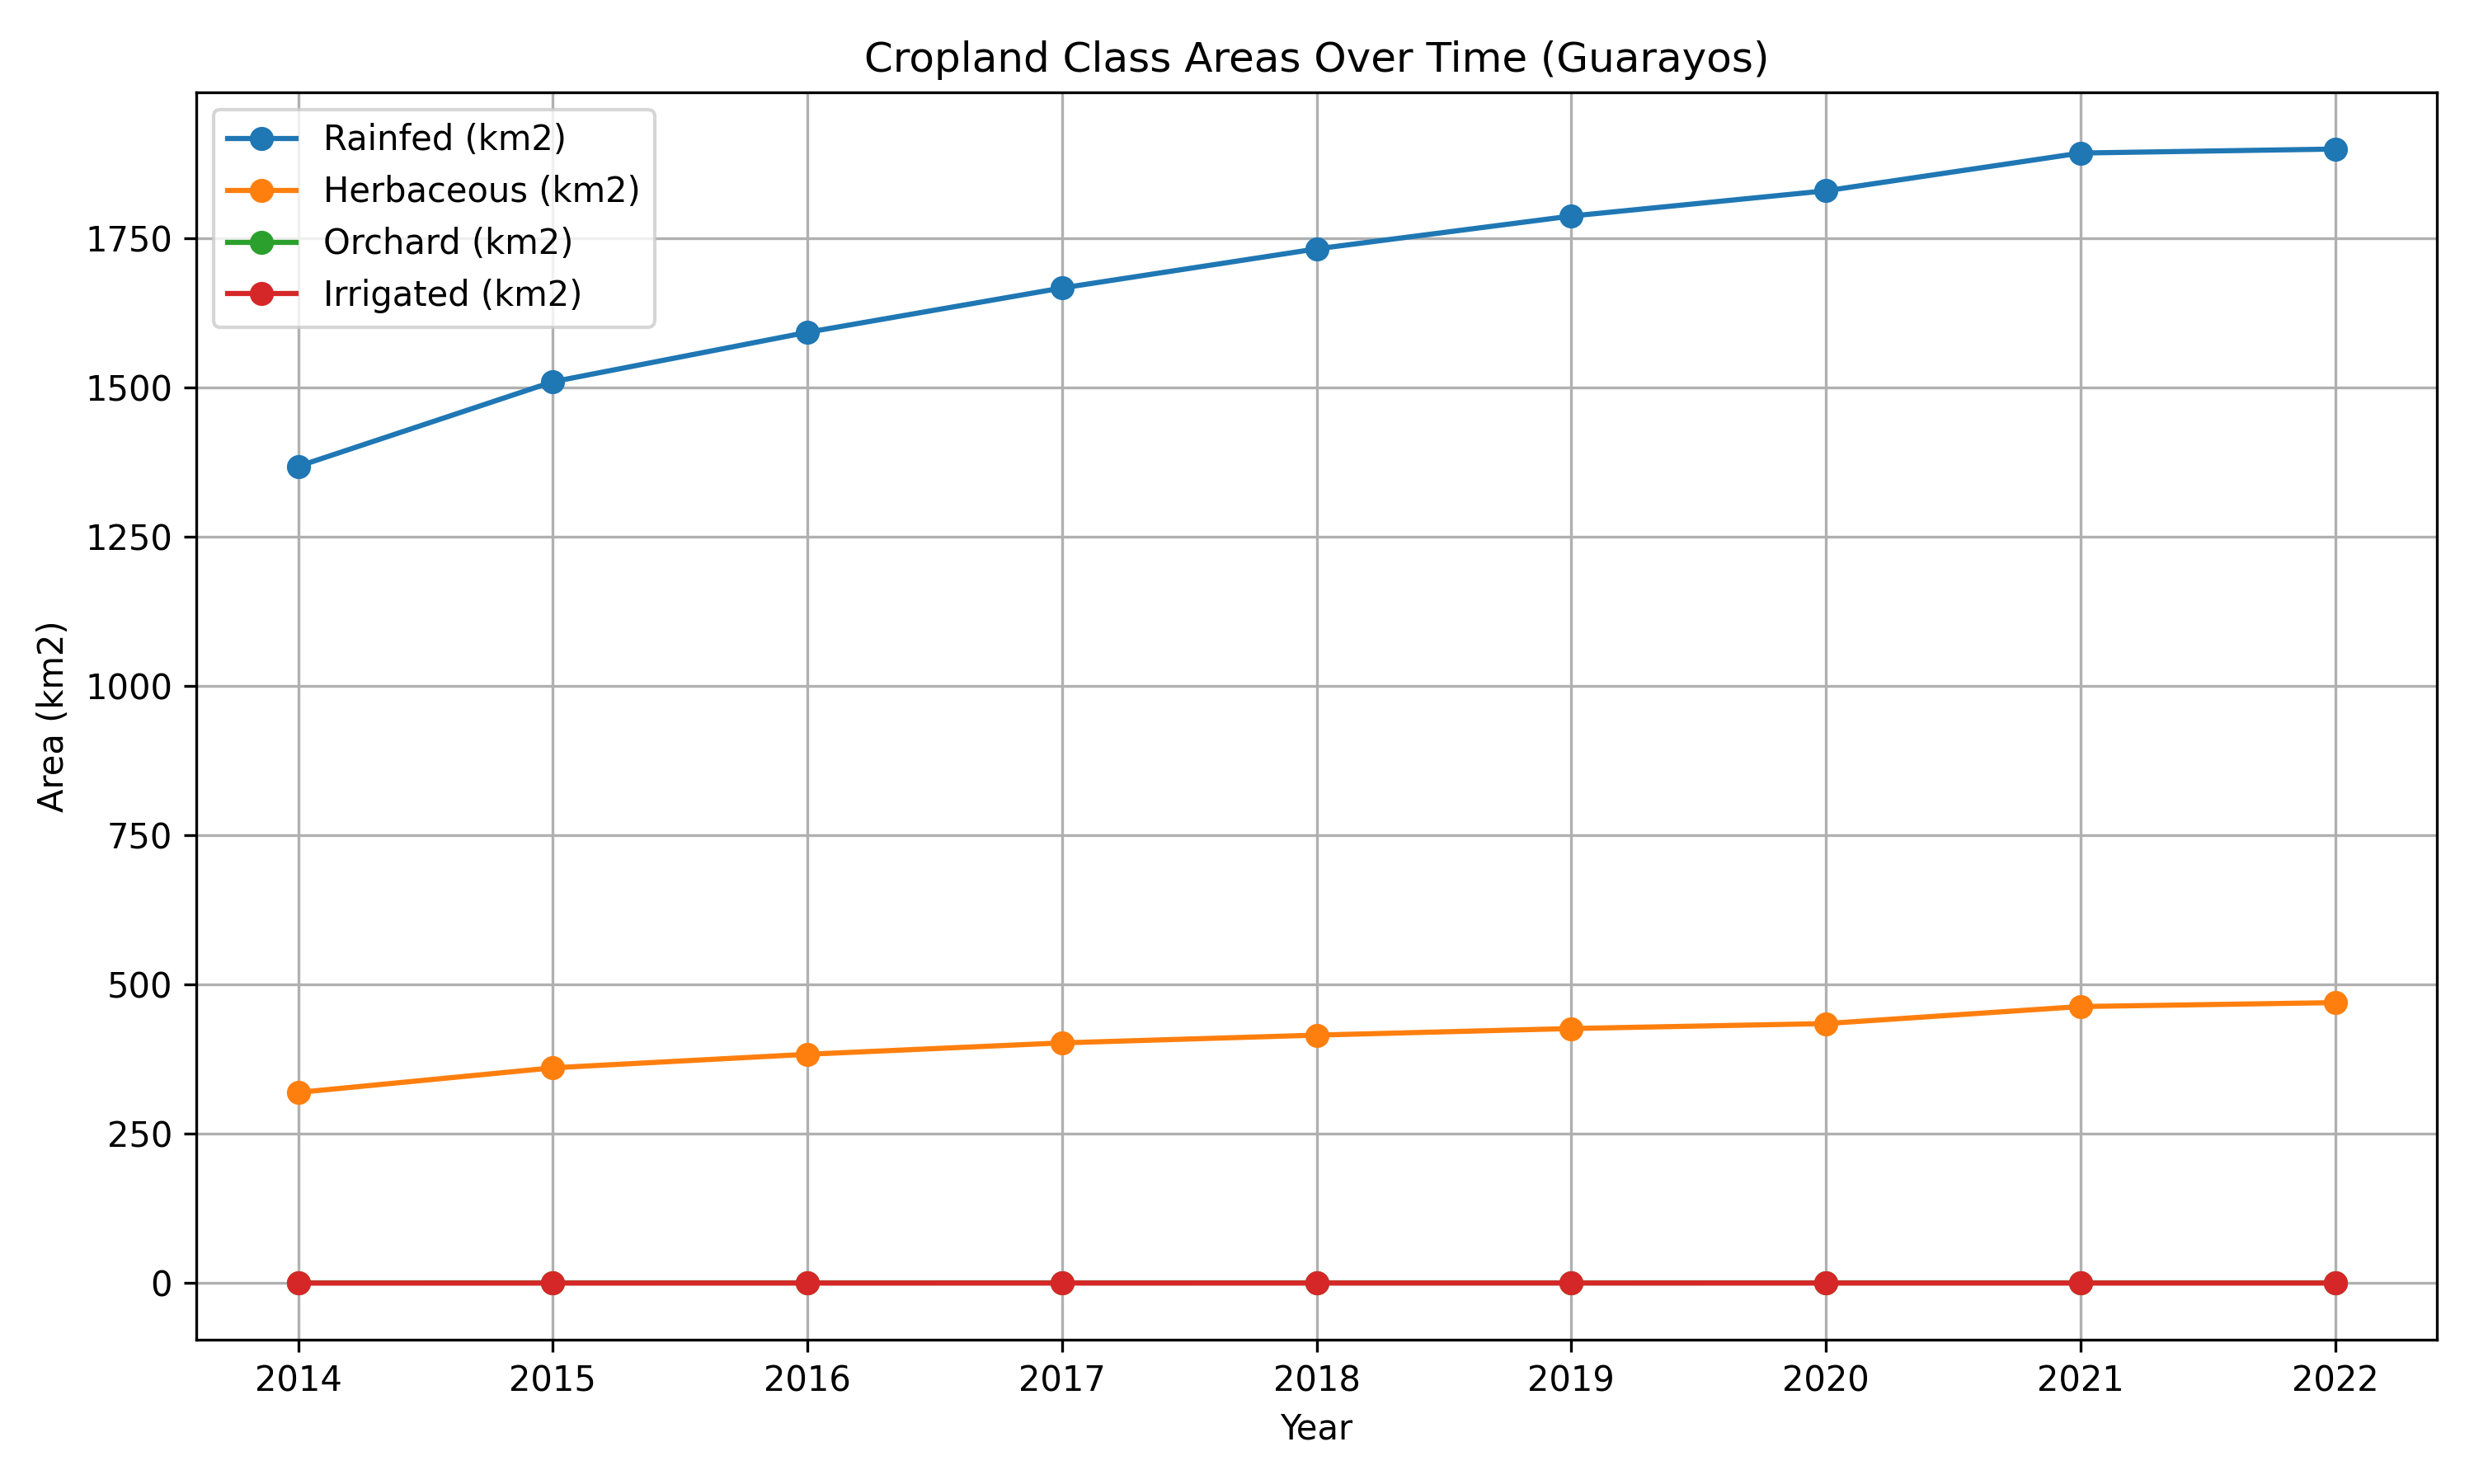
Aggregated Area plot for each cropland type
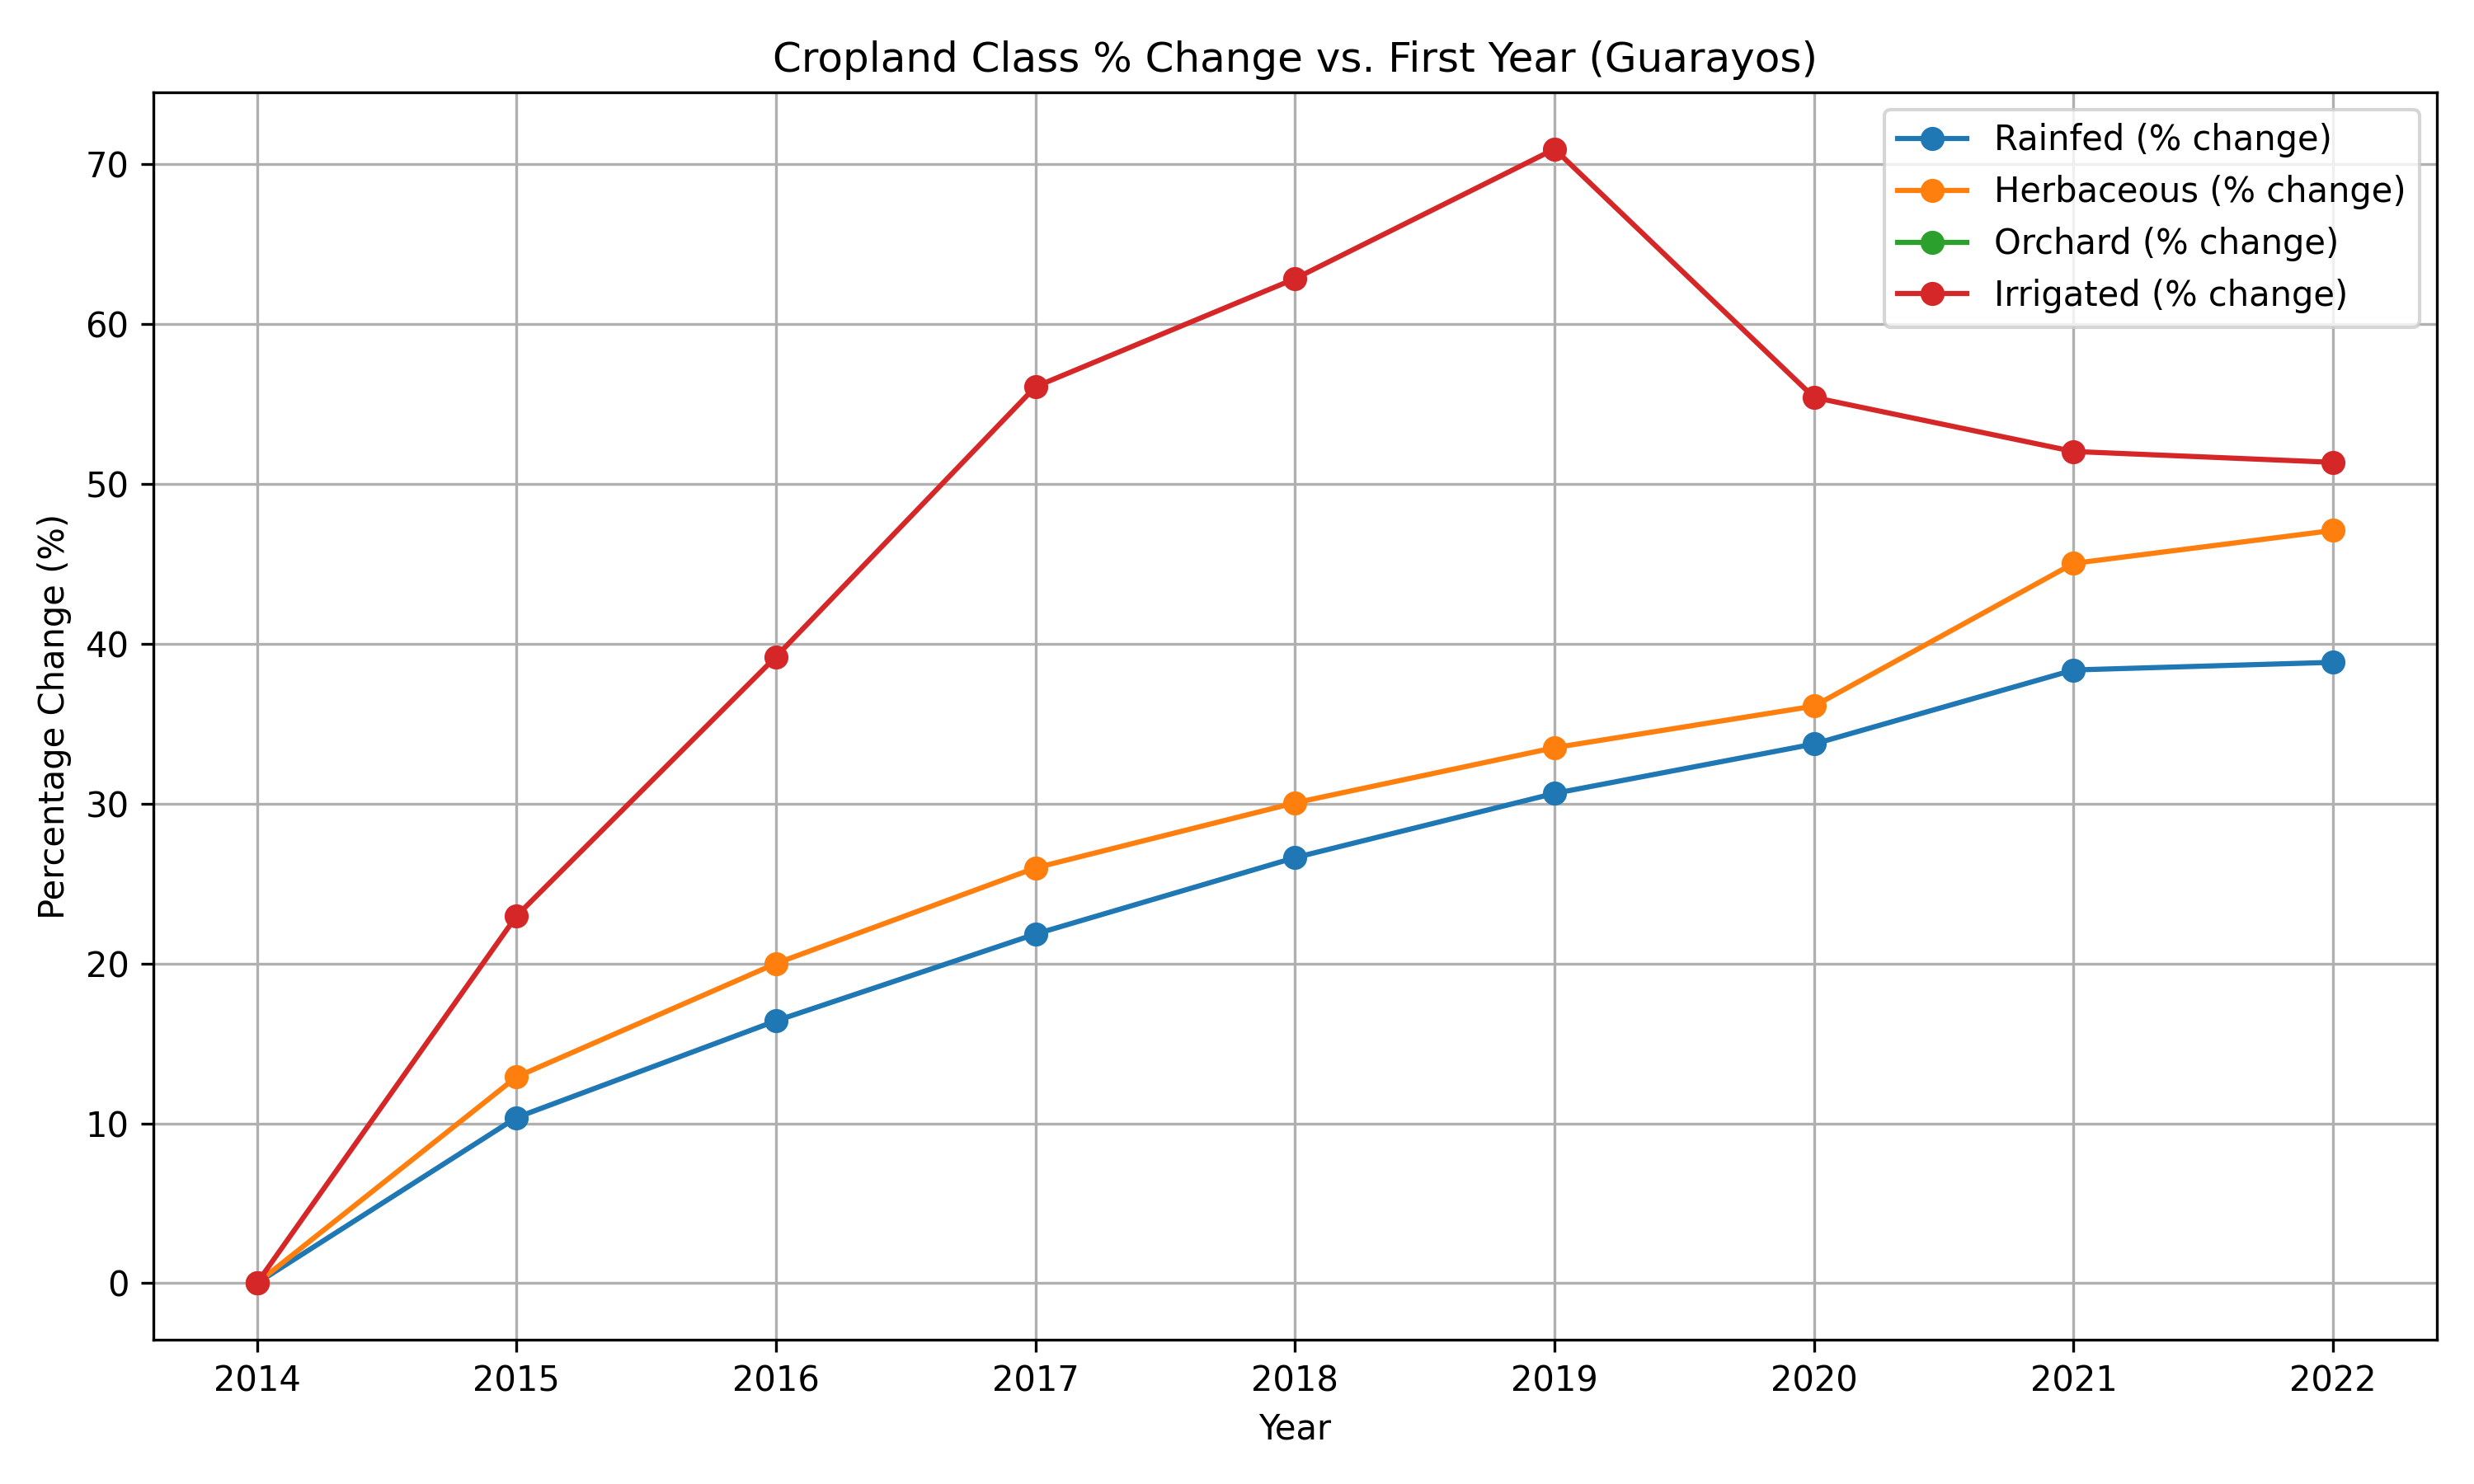
Aggregated Area % increase for each cropland type compared to 2014
Ichilo
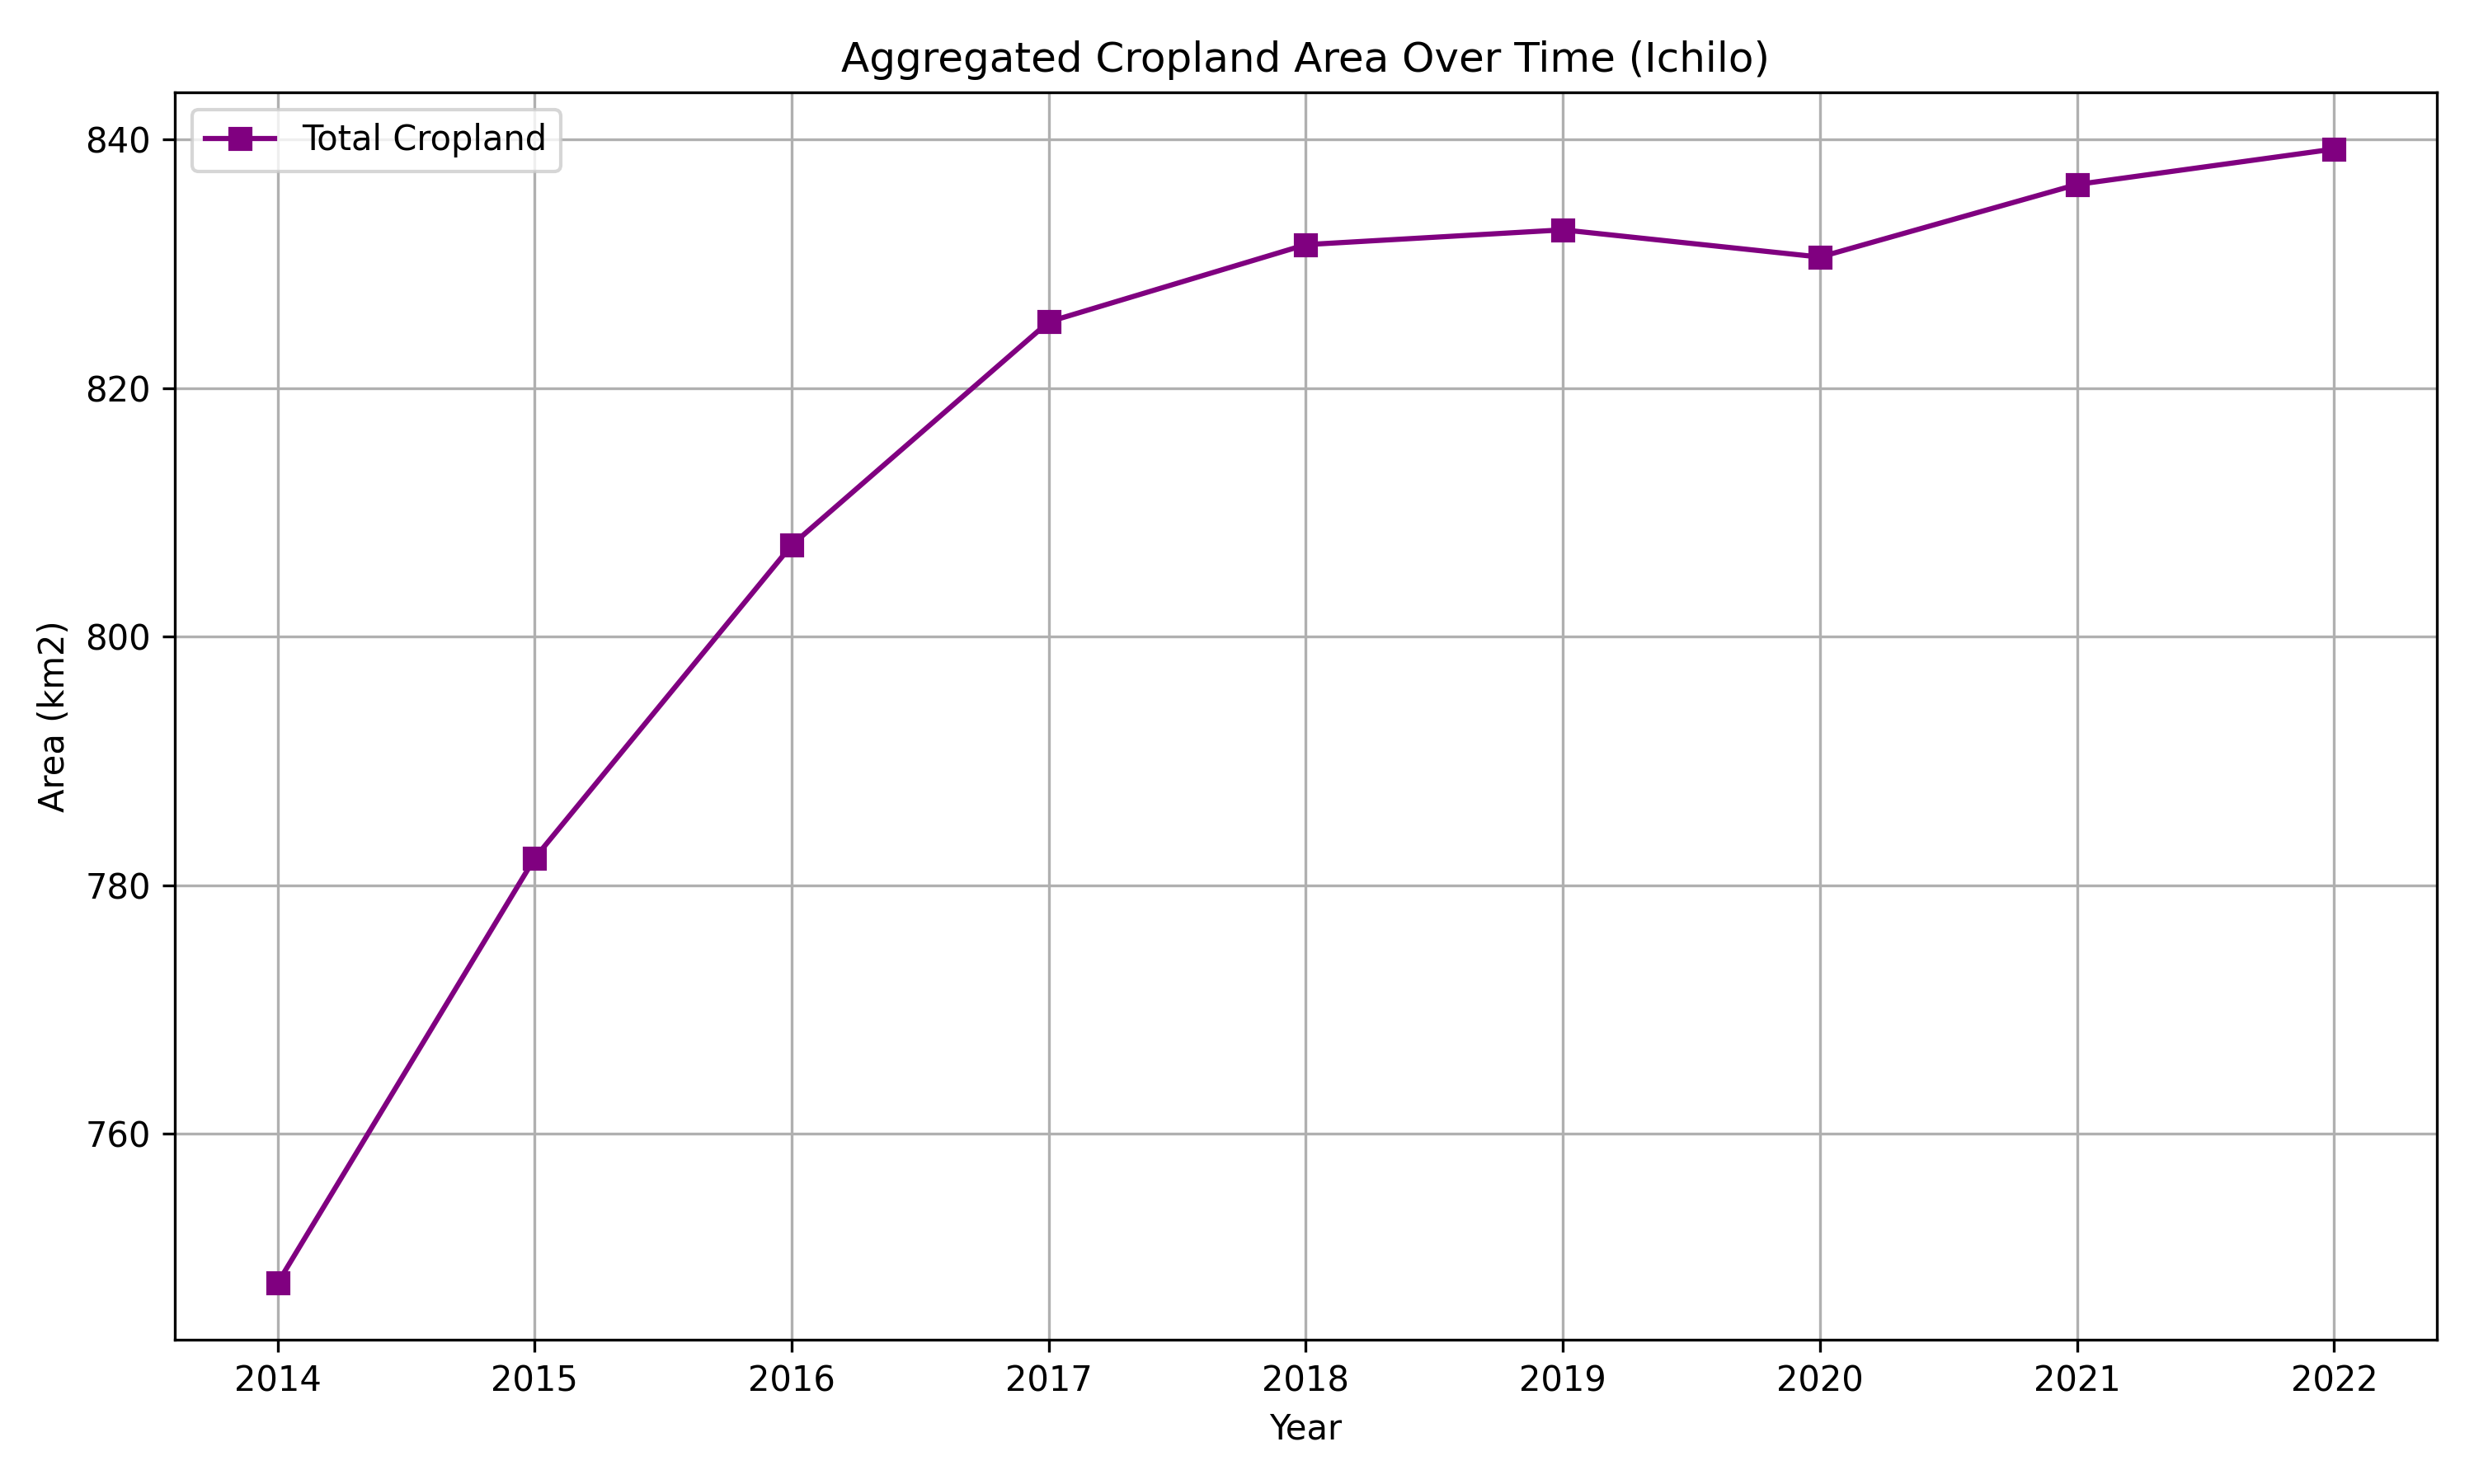
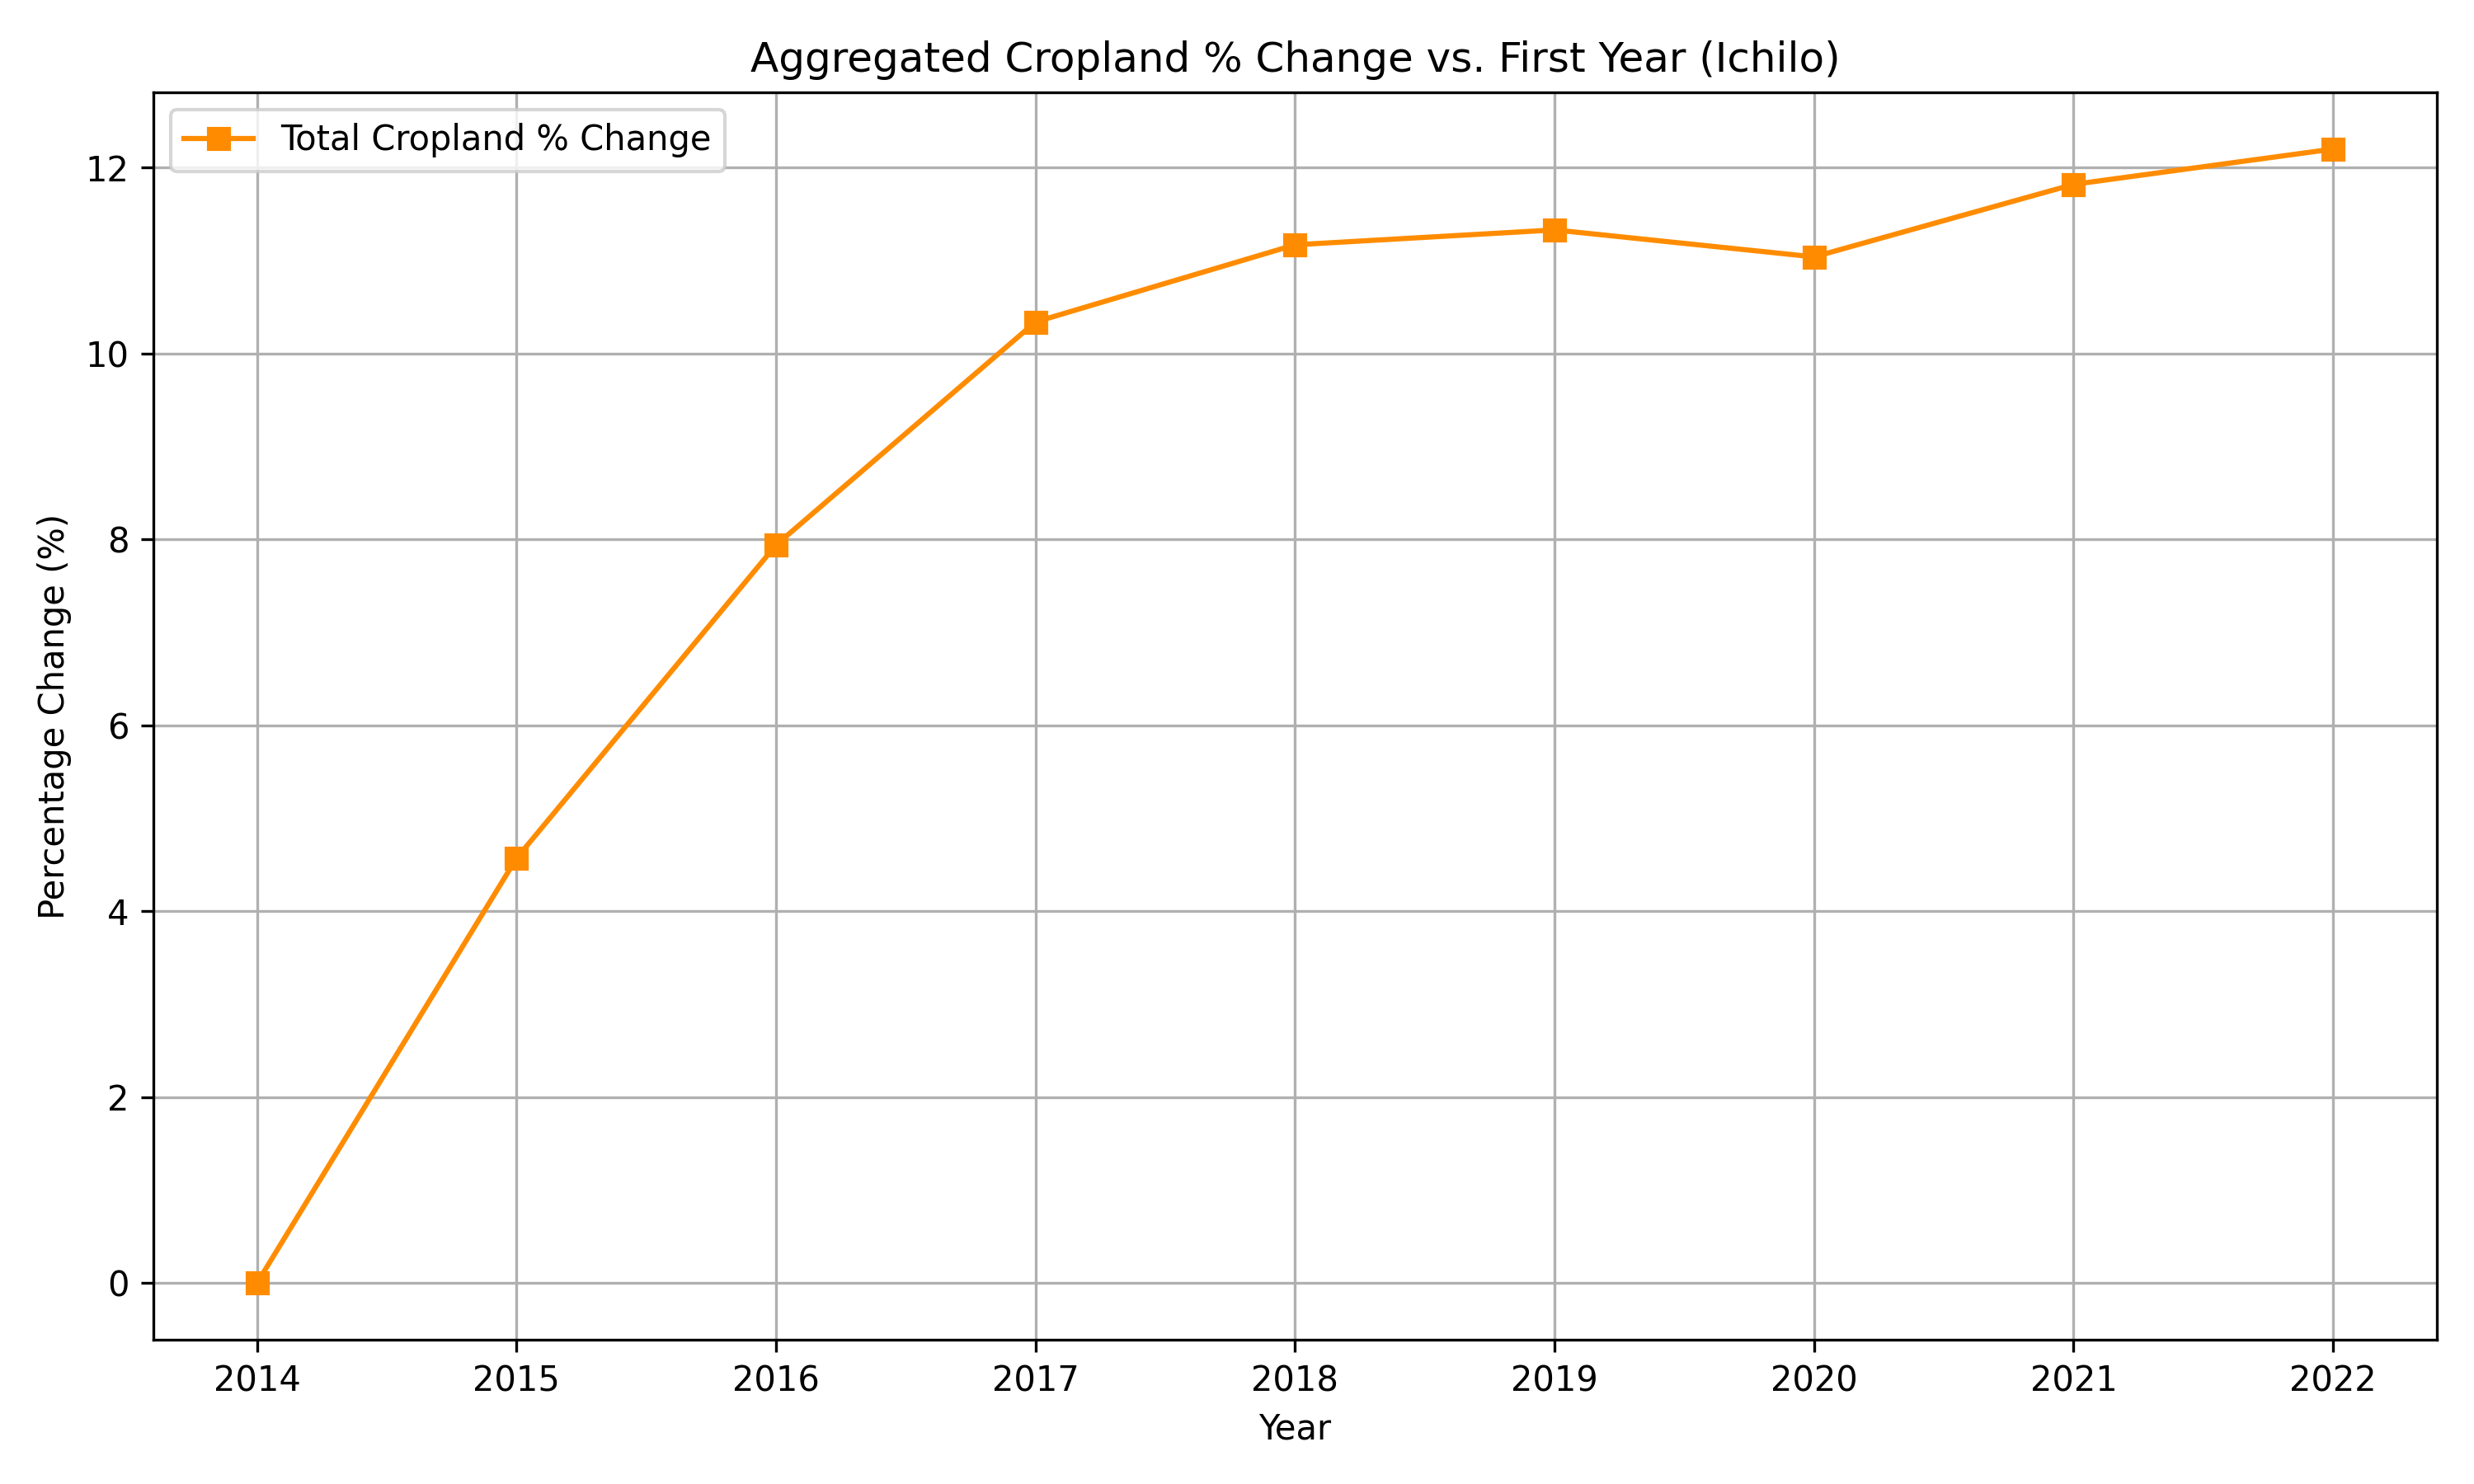
Aggregated Area % increase compared to 2014
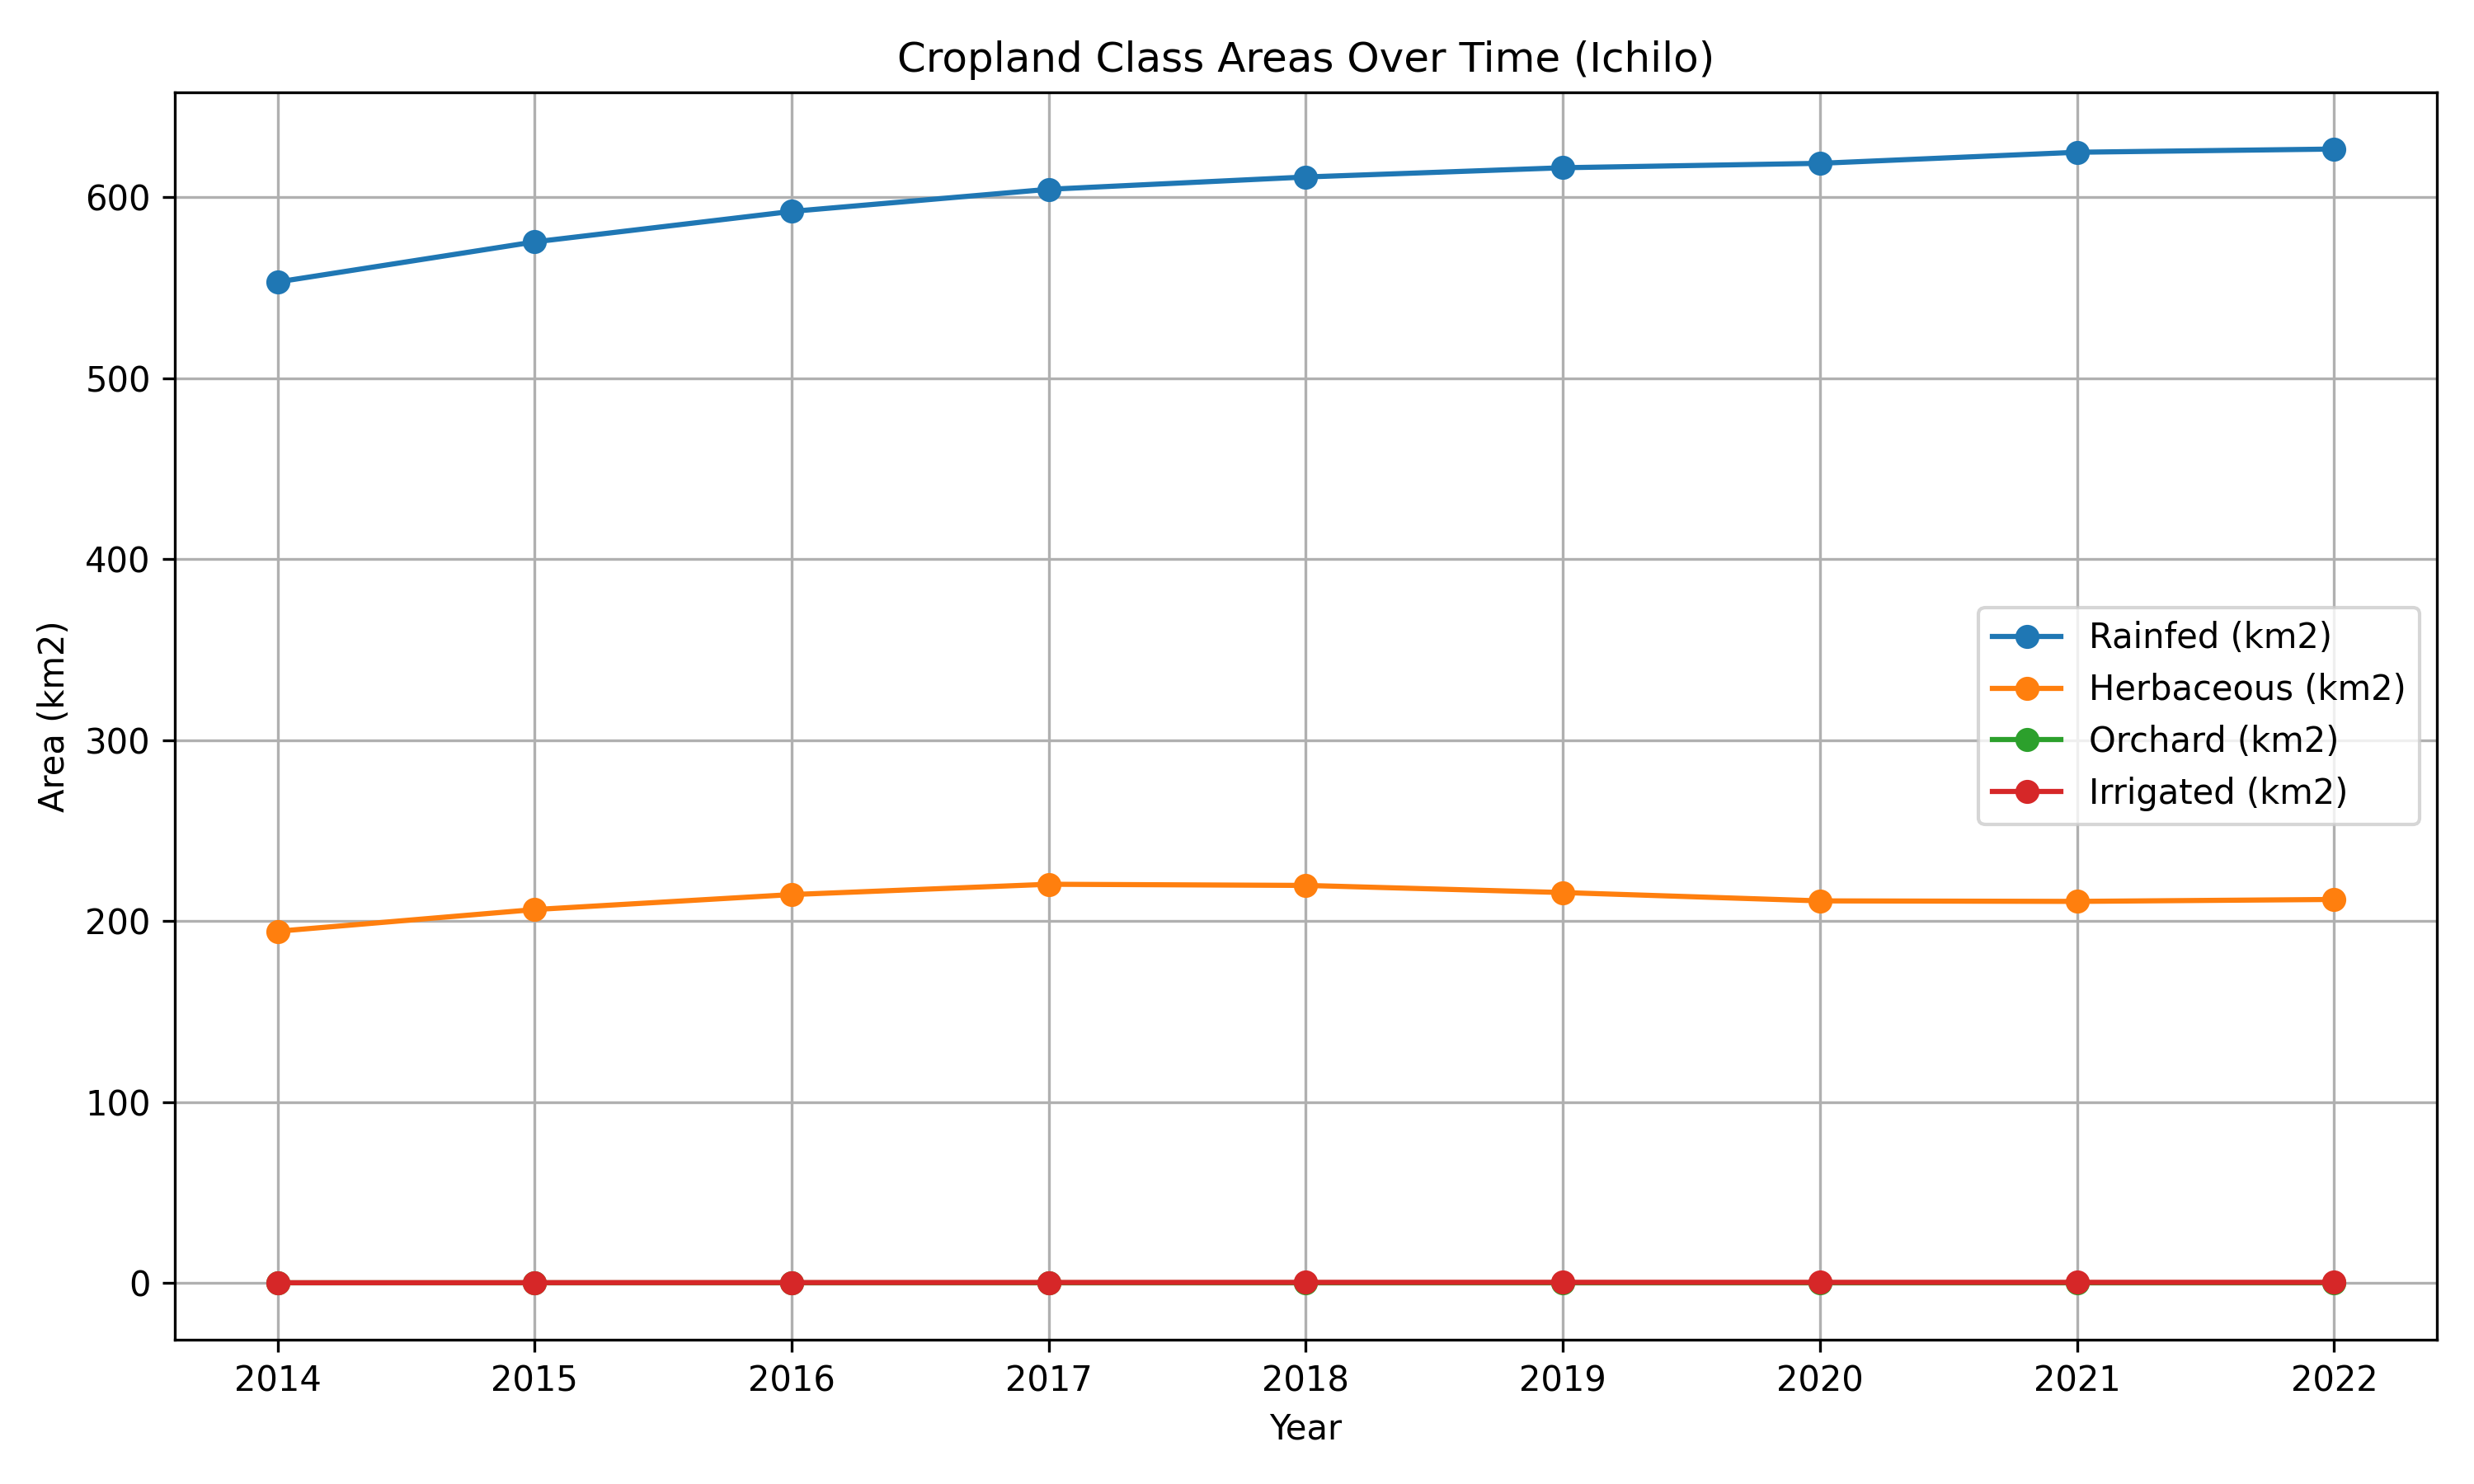
Aggregated Area plot for each cropland type
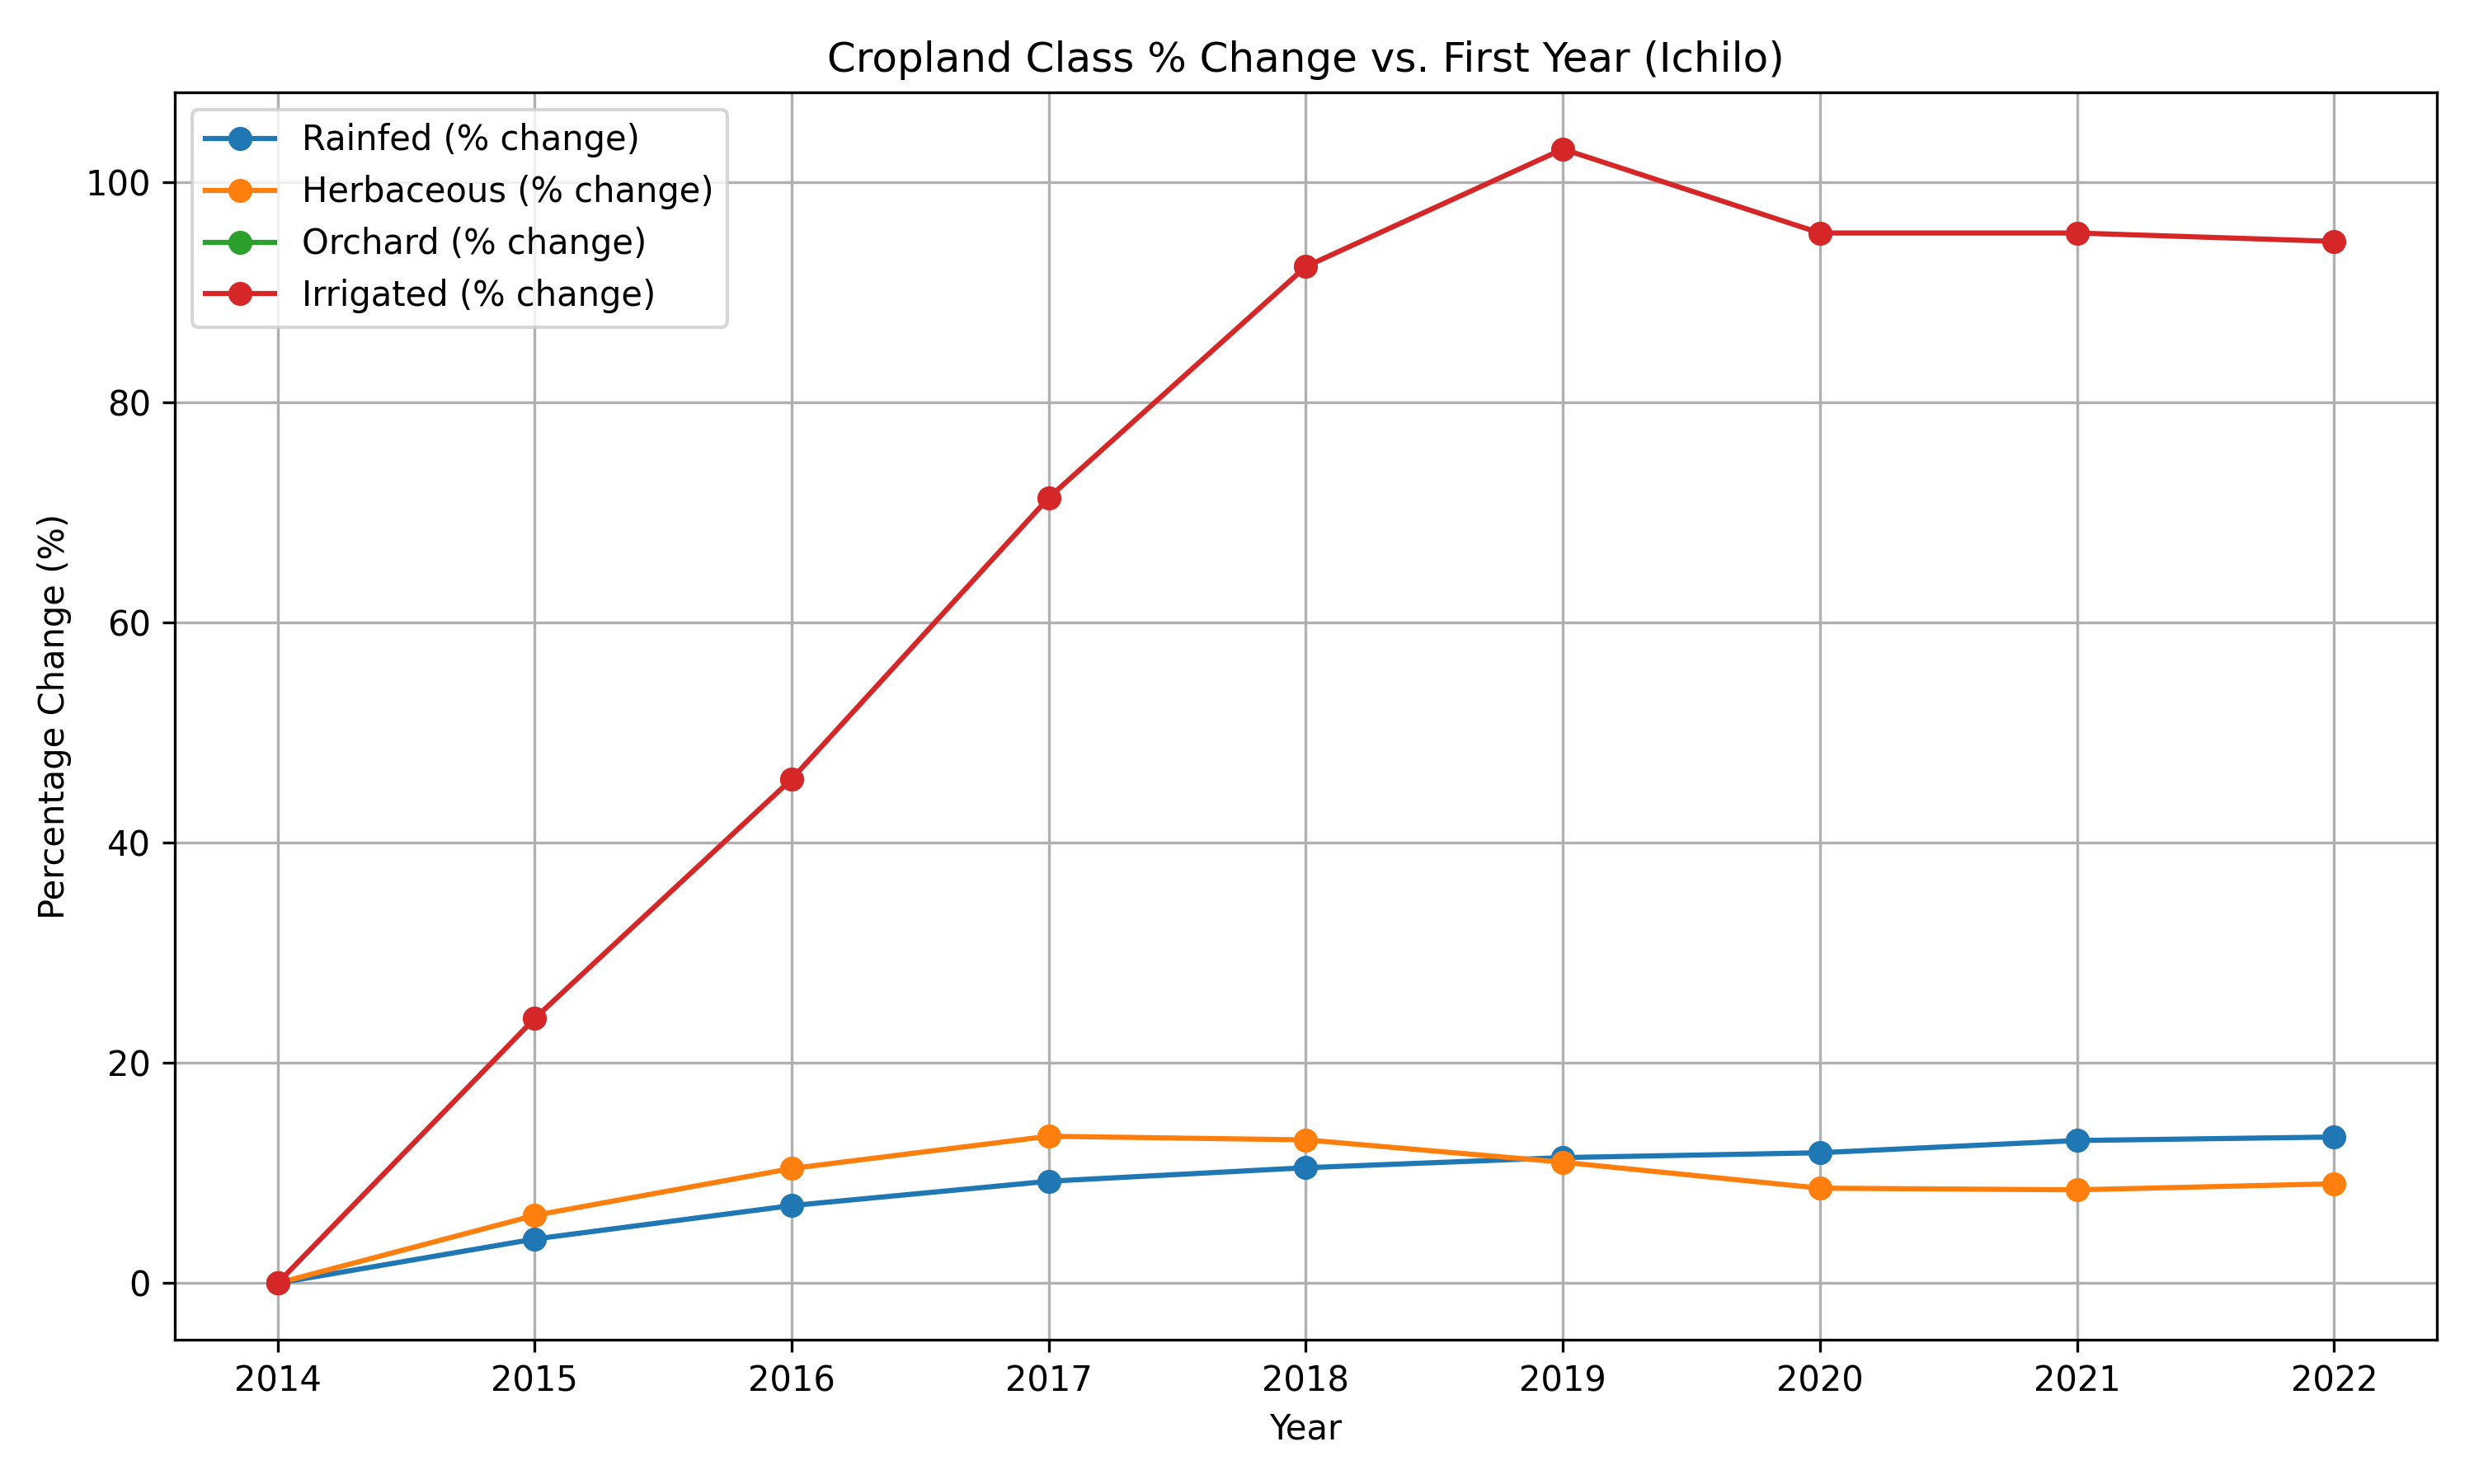
Aggregated Area % increase for each cropland type compared to 2014
Ñuflo_De_Chávez
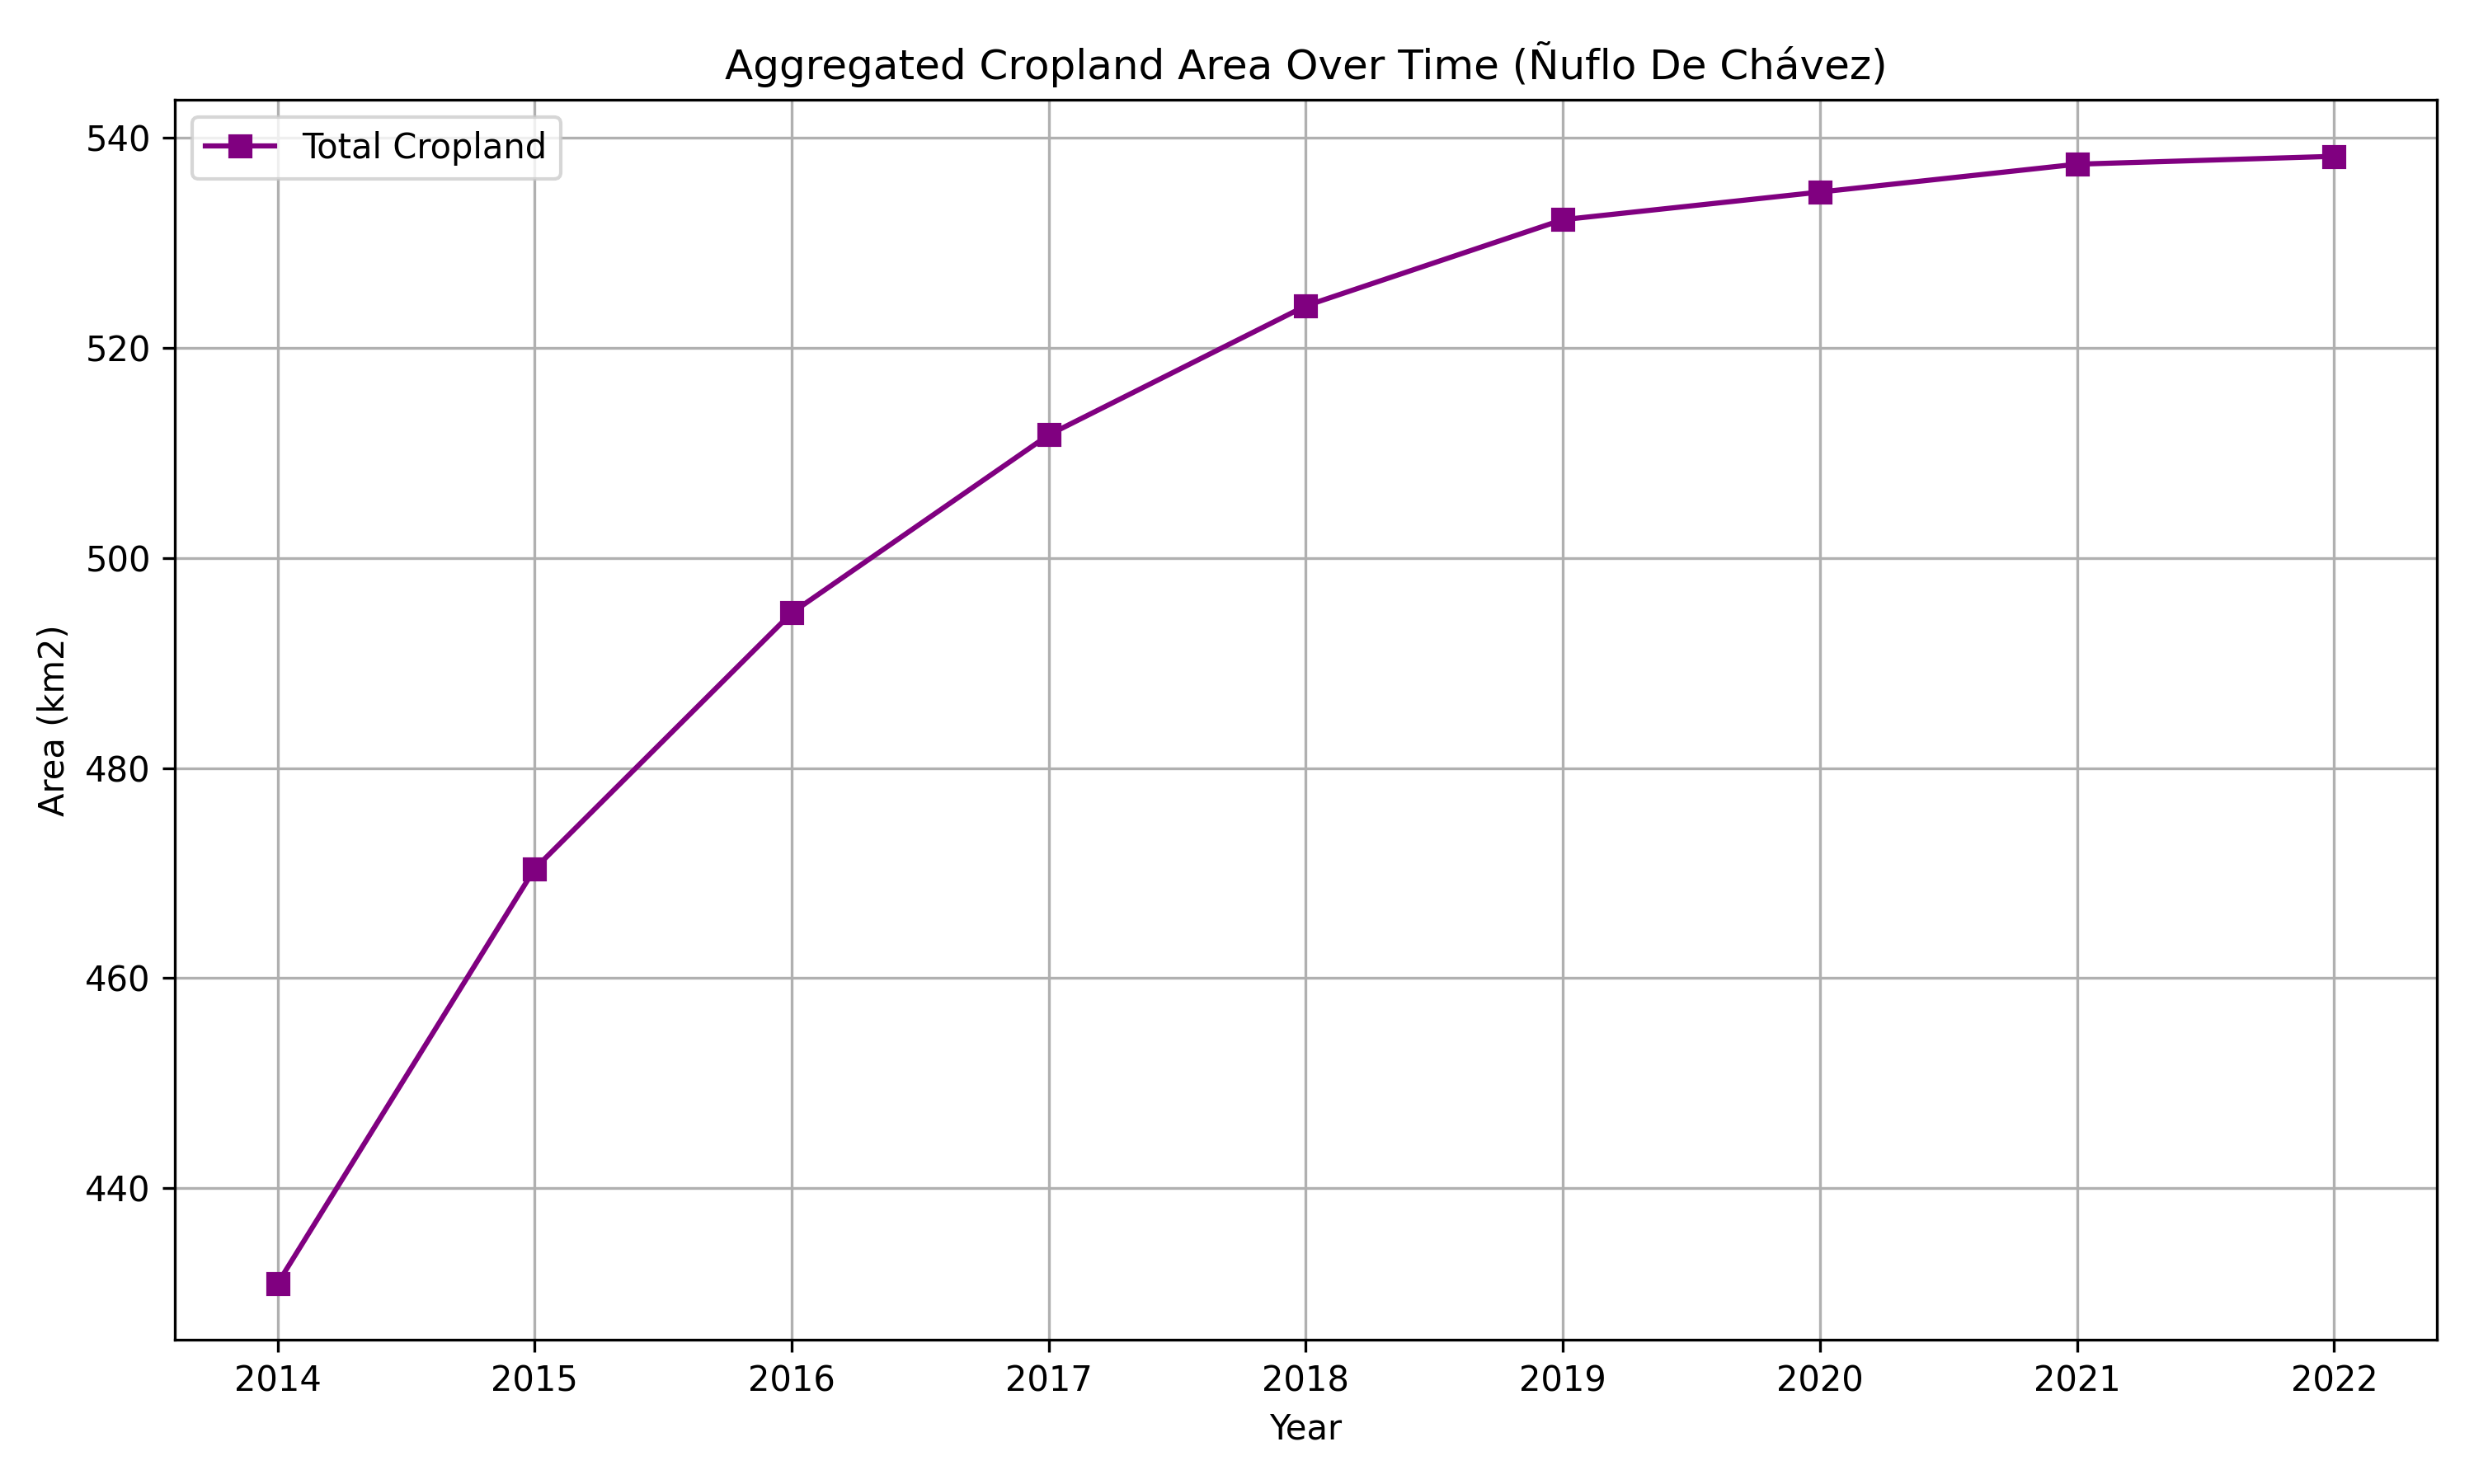
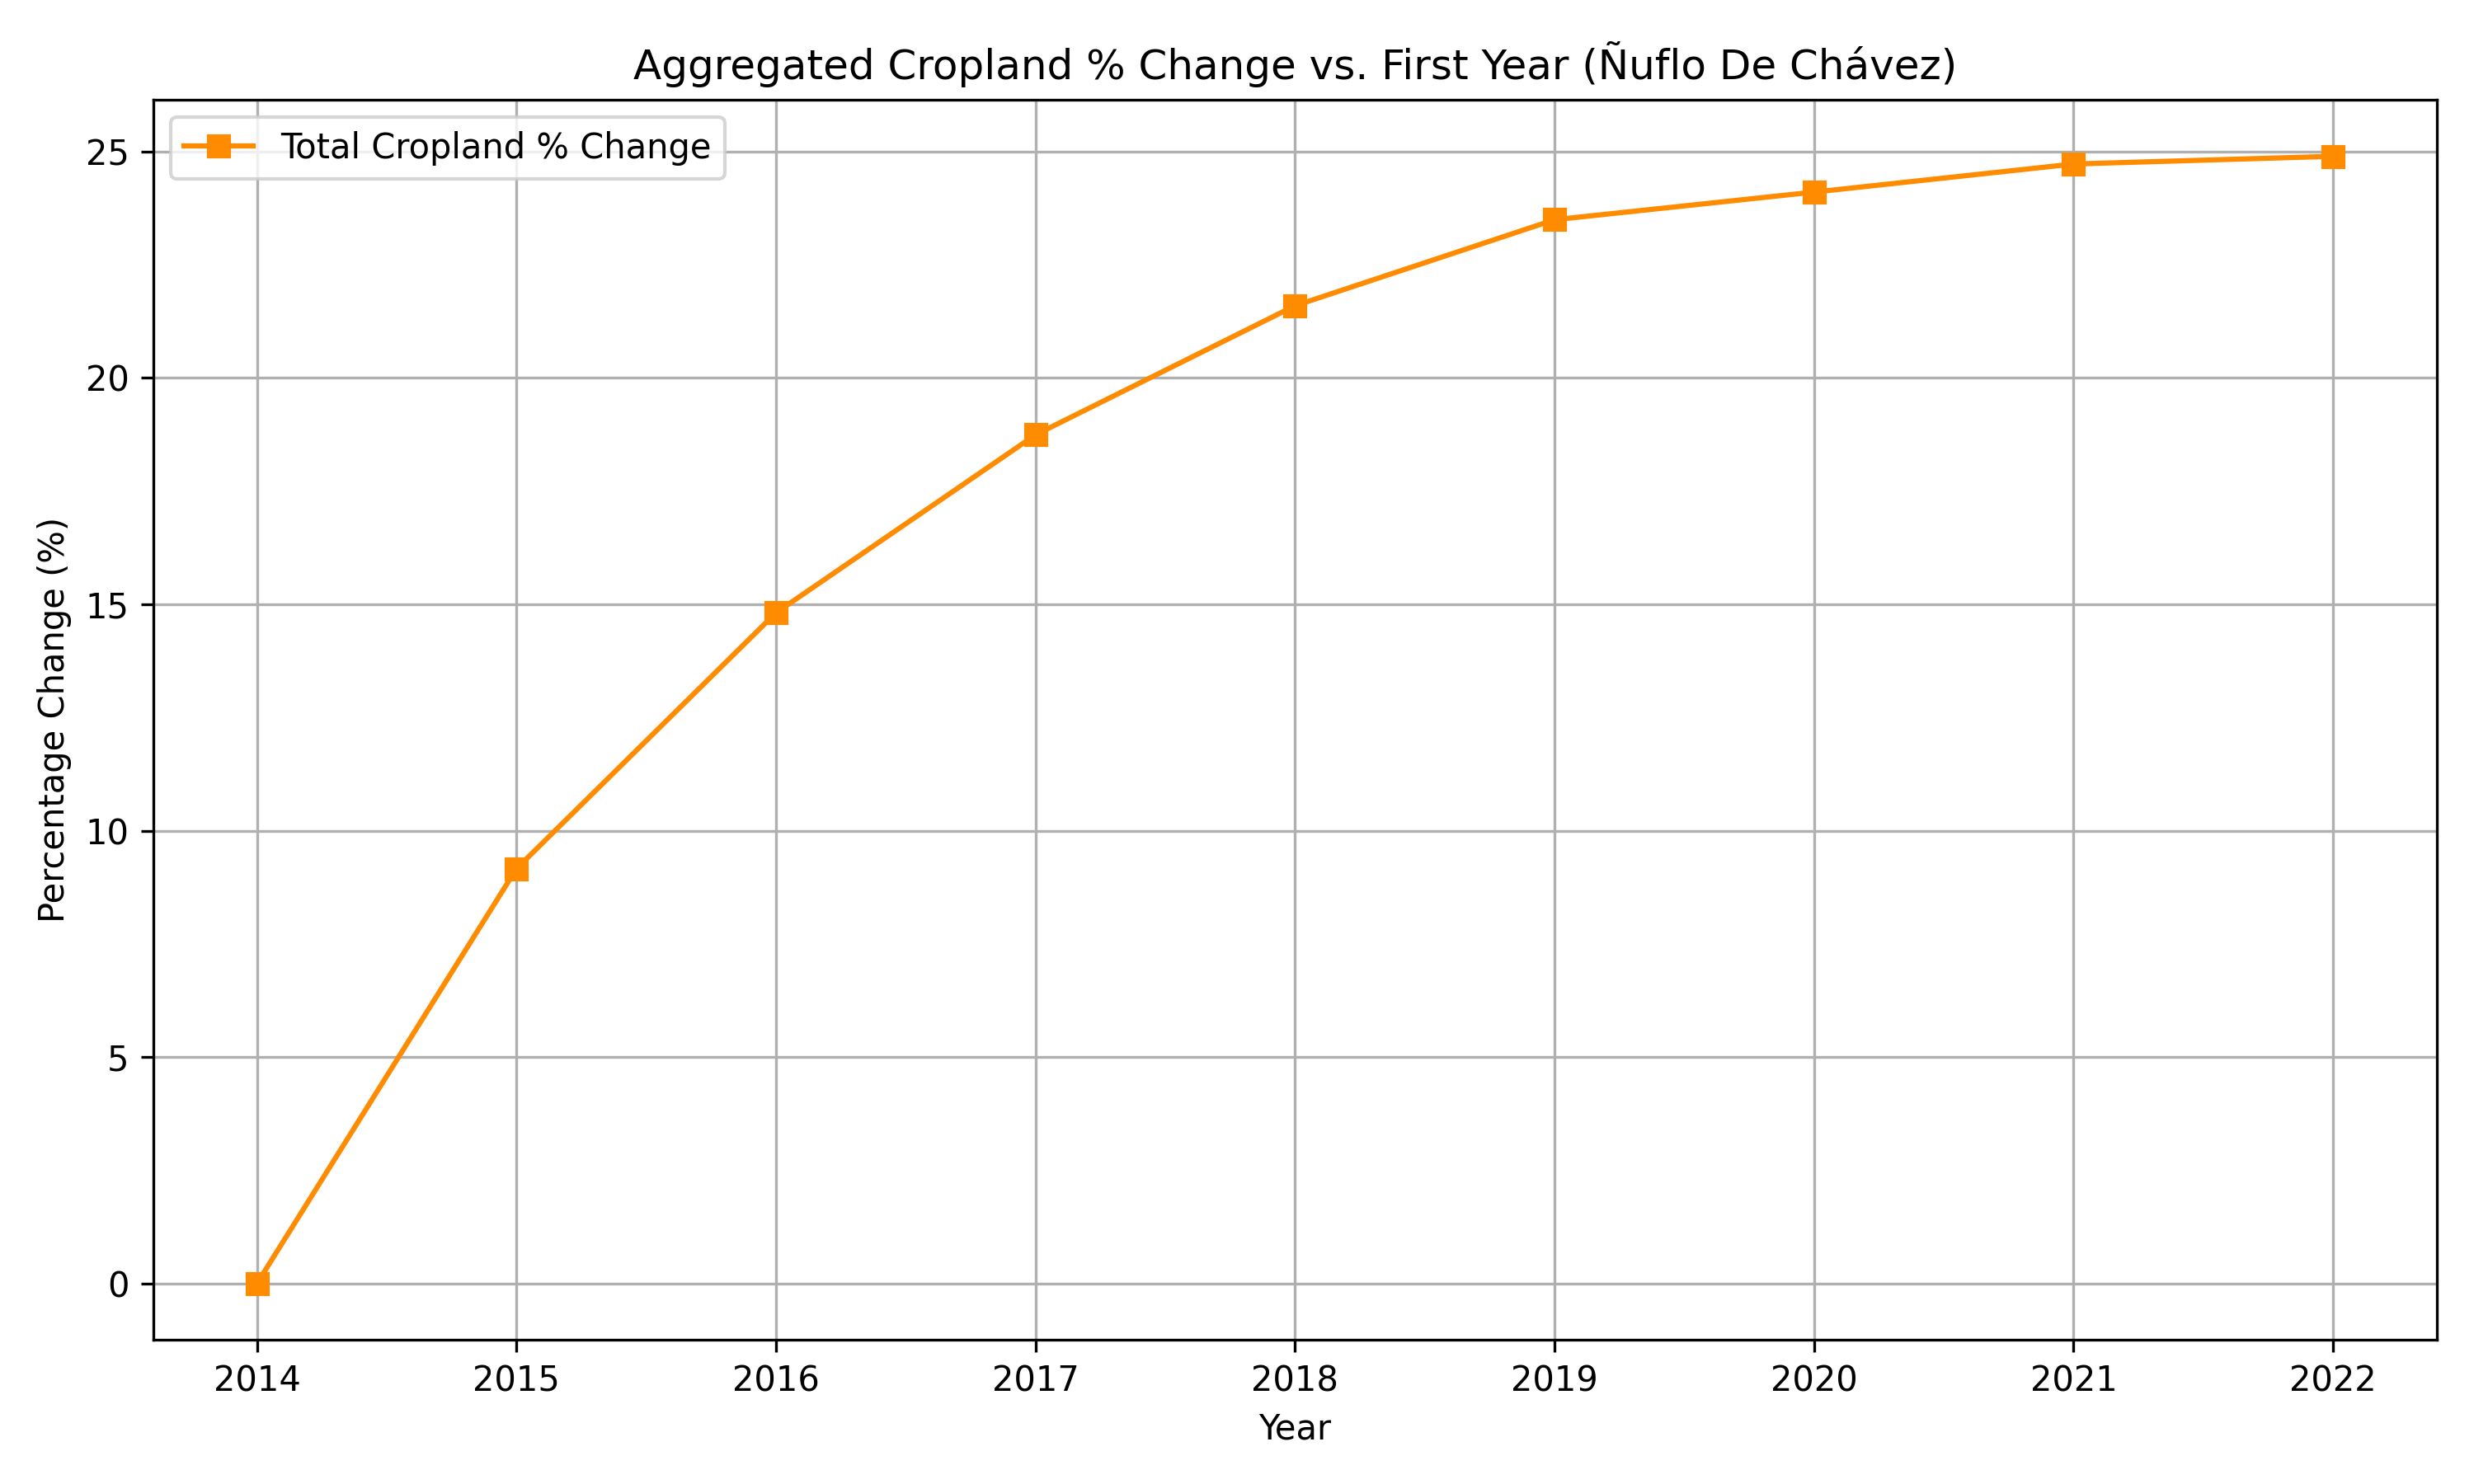
Aggregated Area % increase compared to 2014
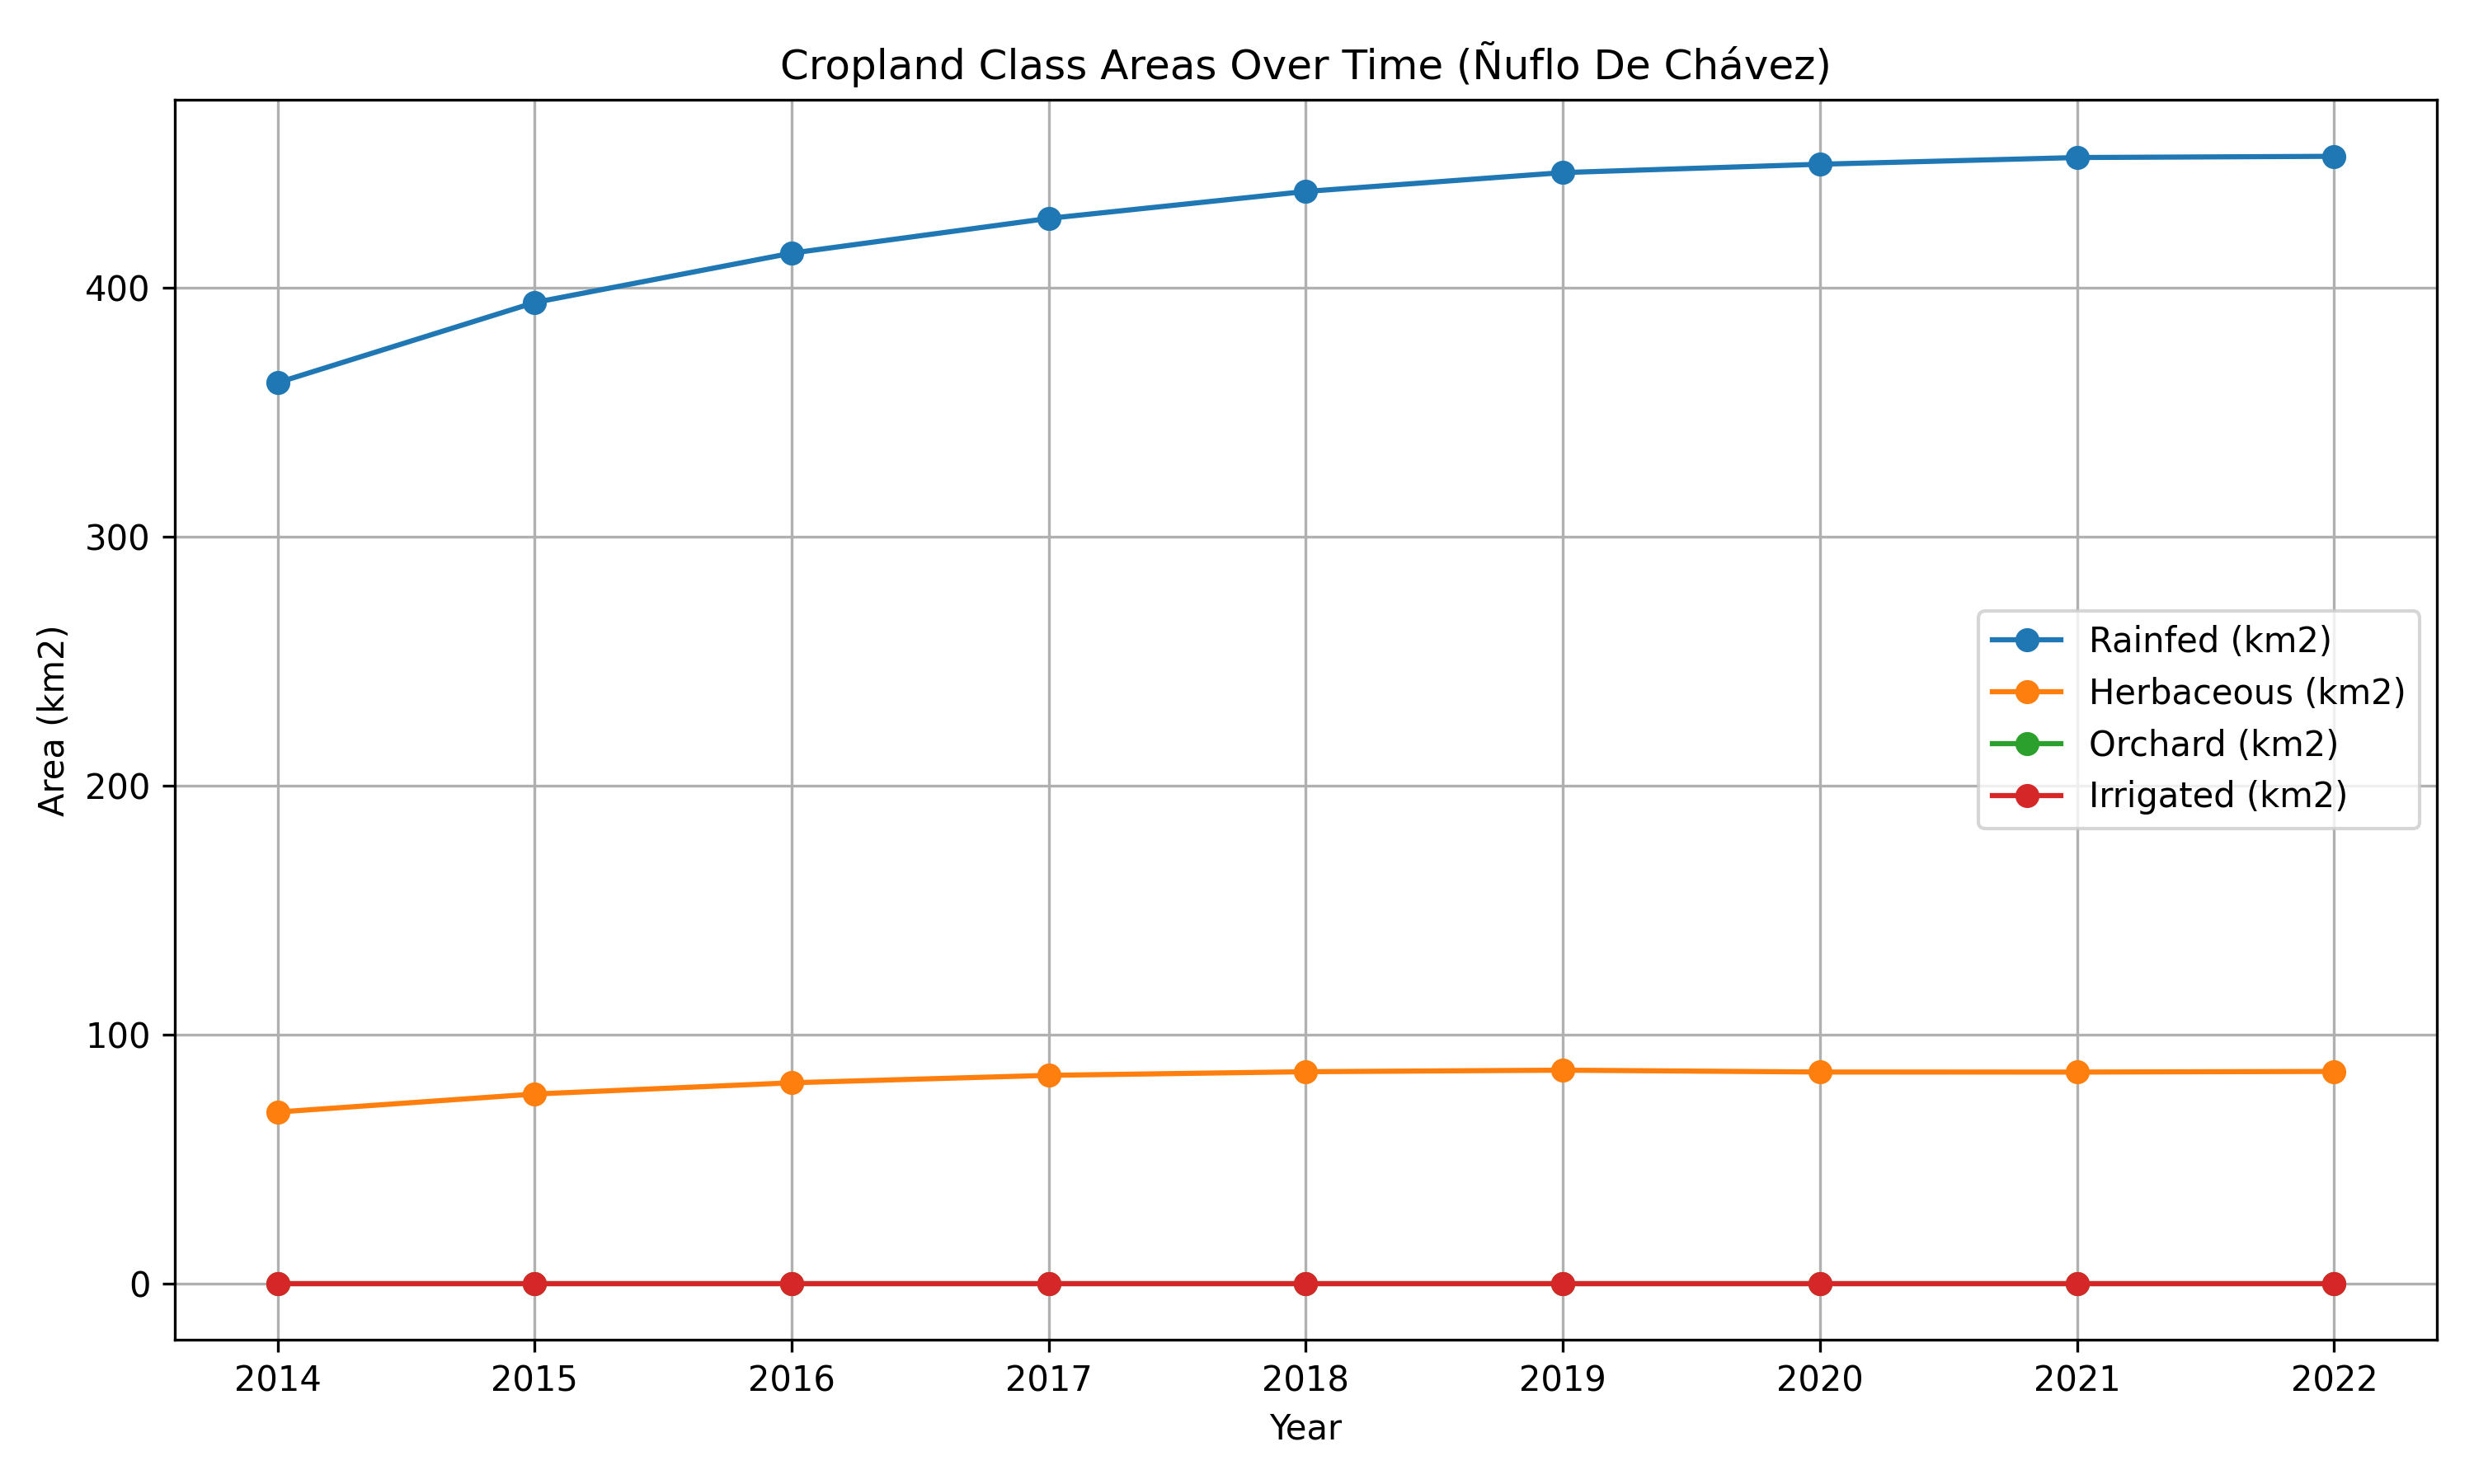
Aggregated Area plot for each cropland type
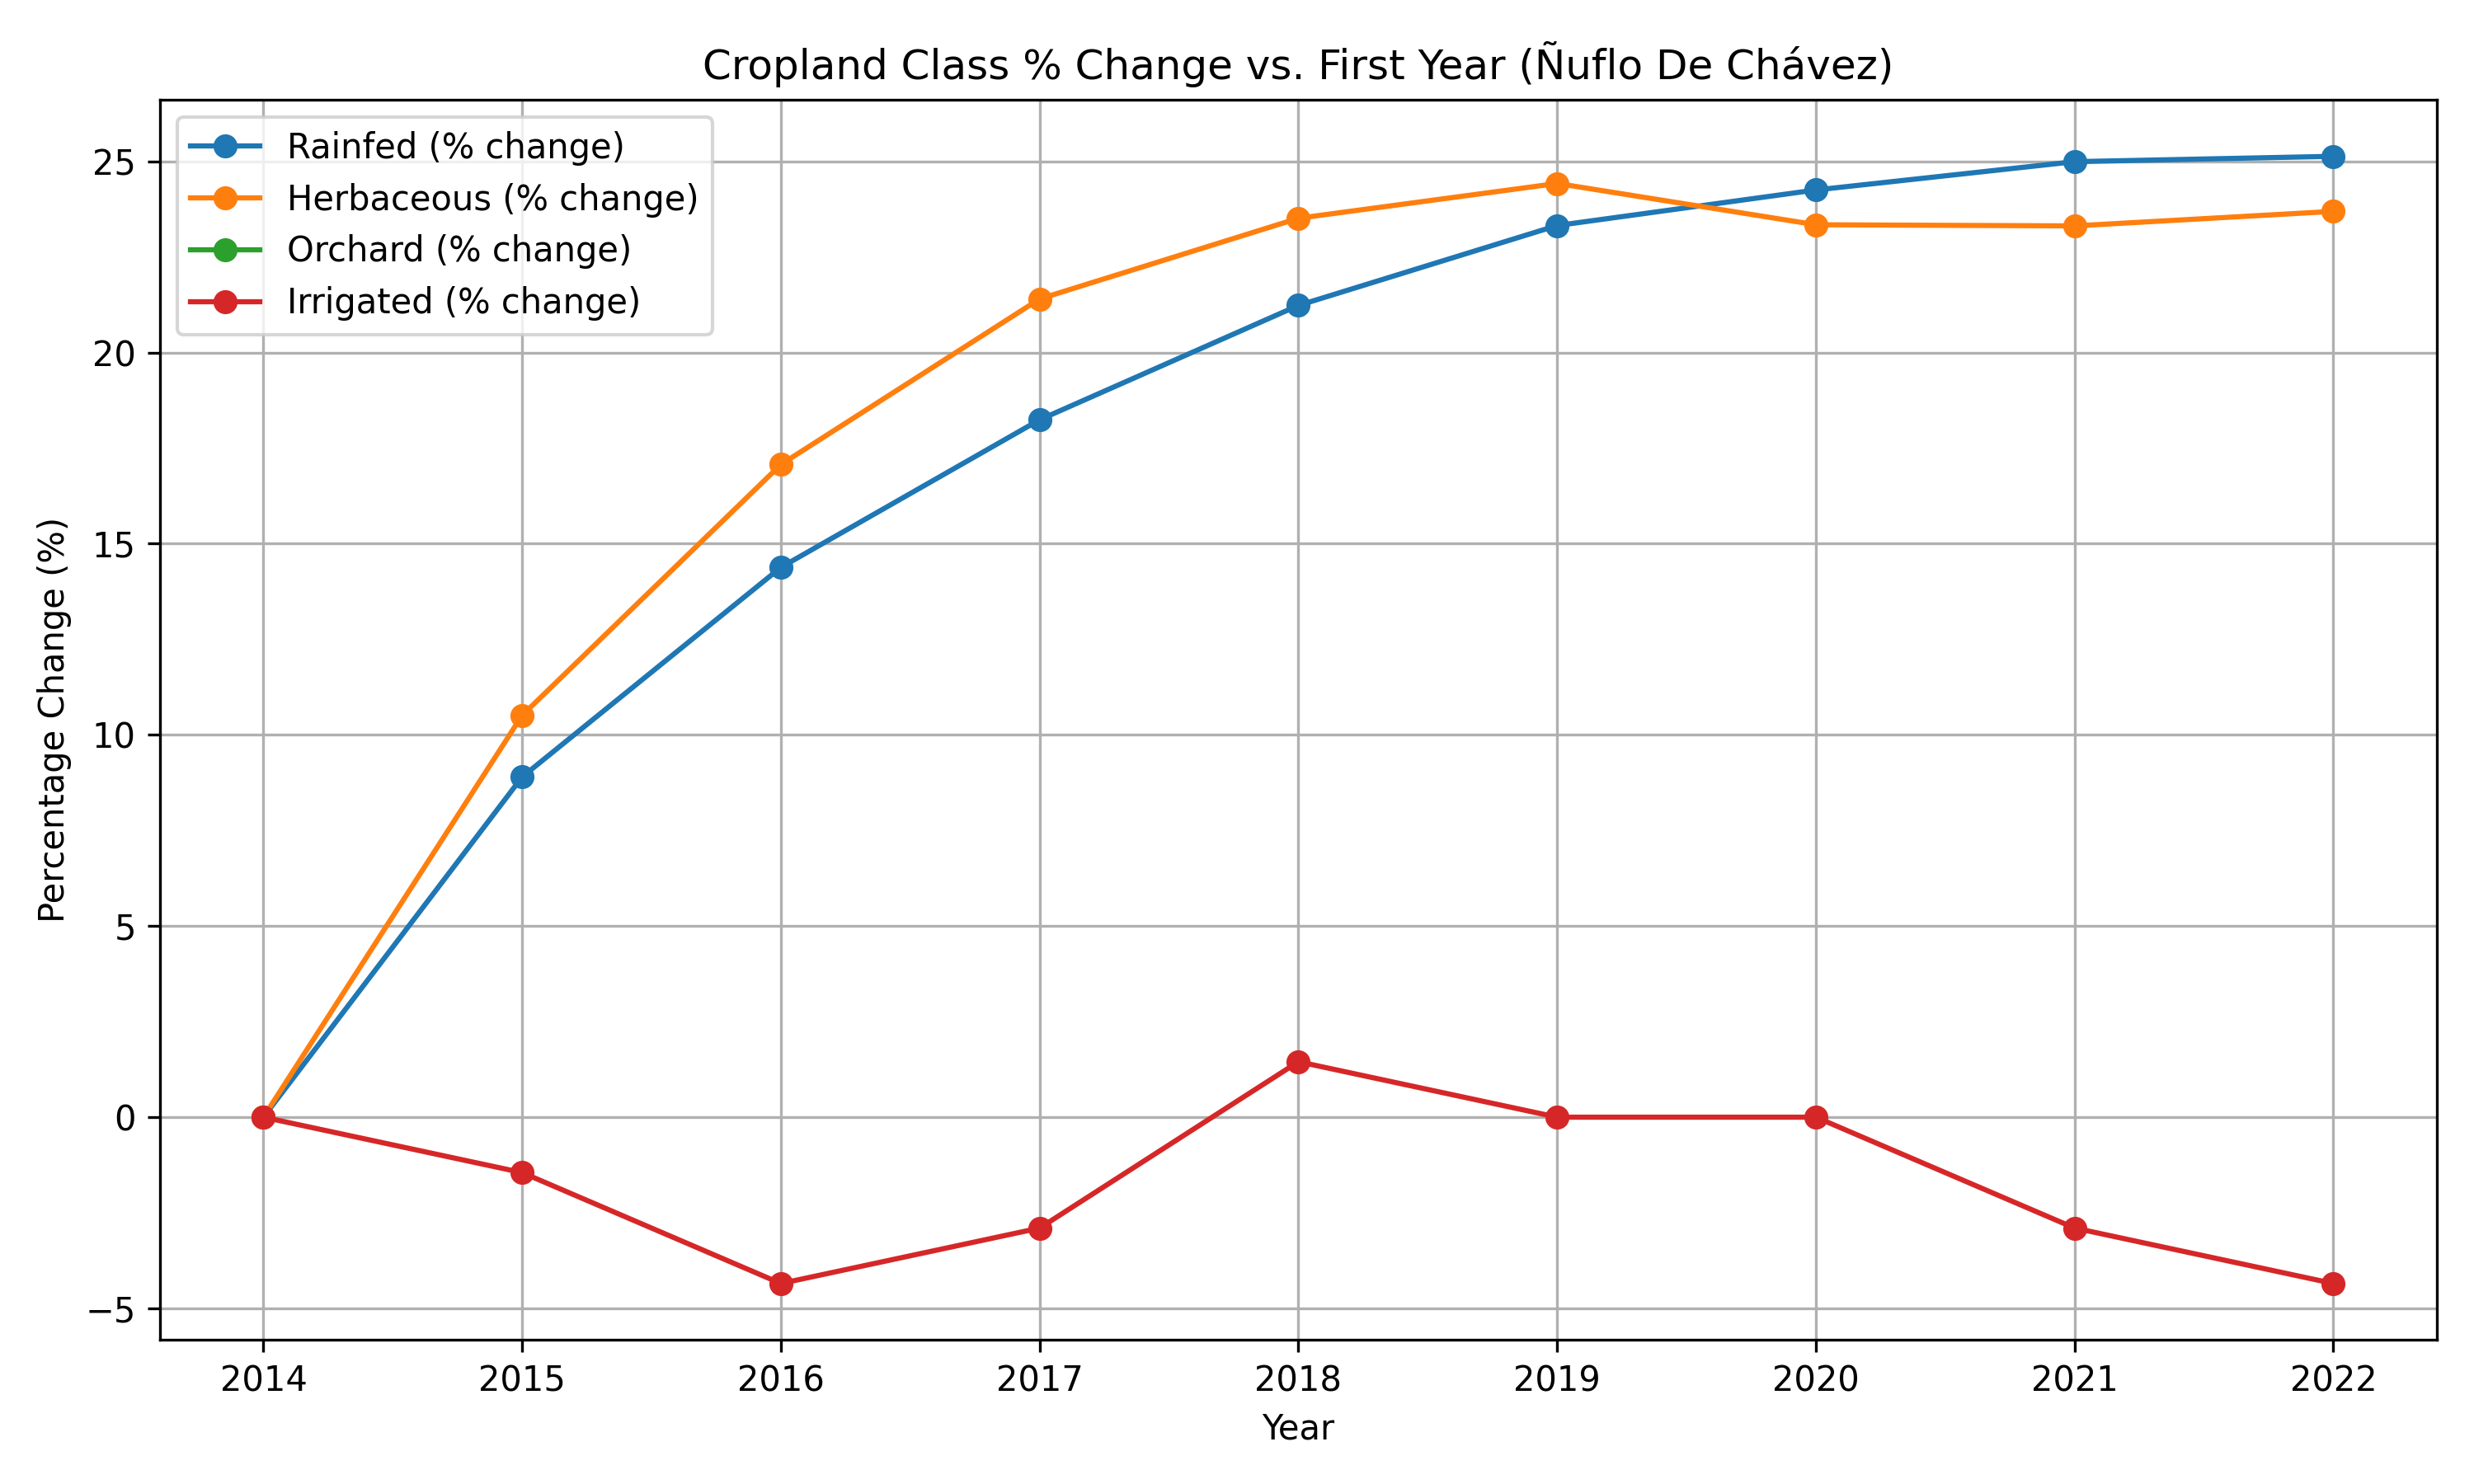
Aggregated Area % increase for each cropland type compared to 2014
Marbán
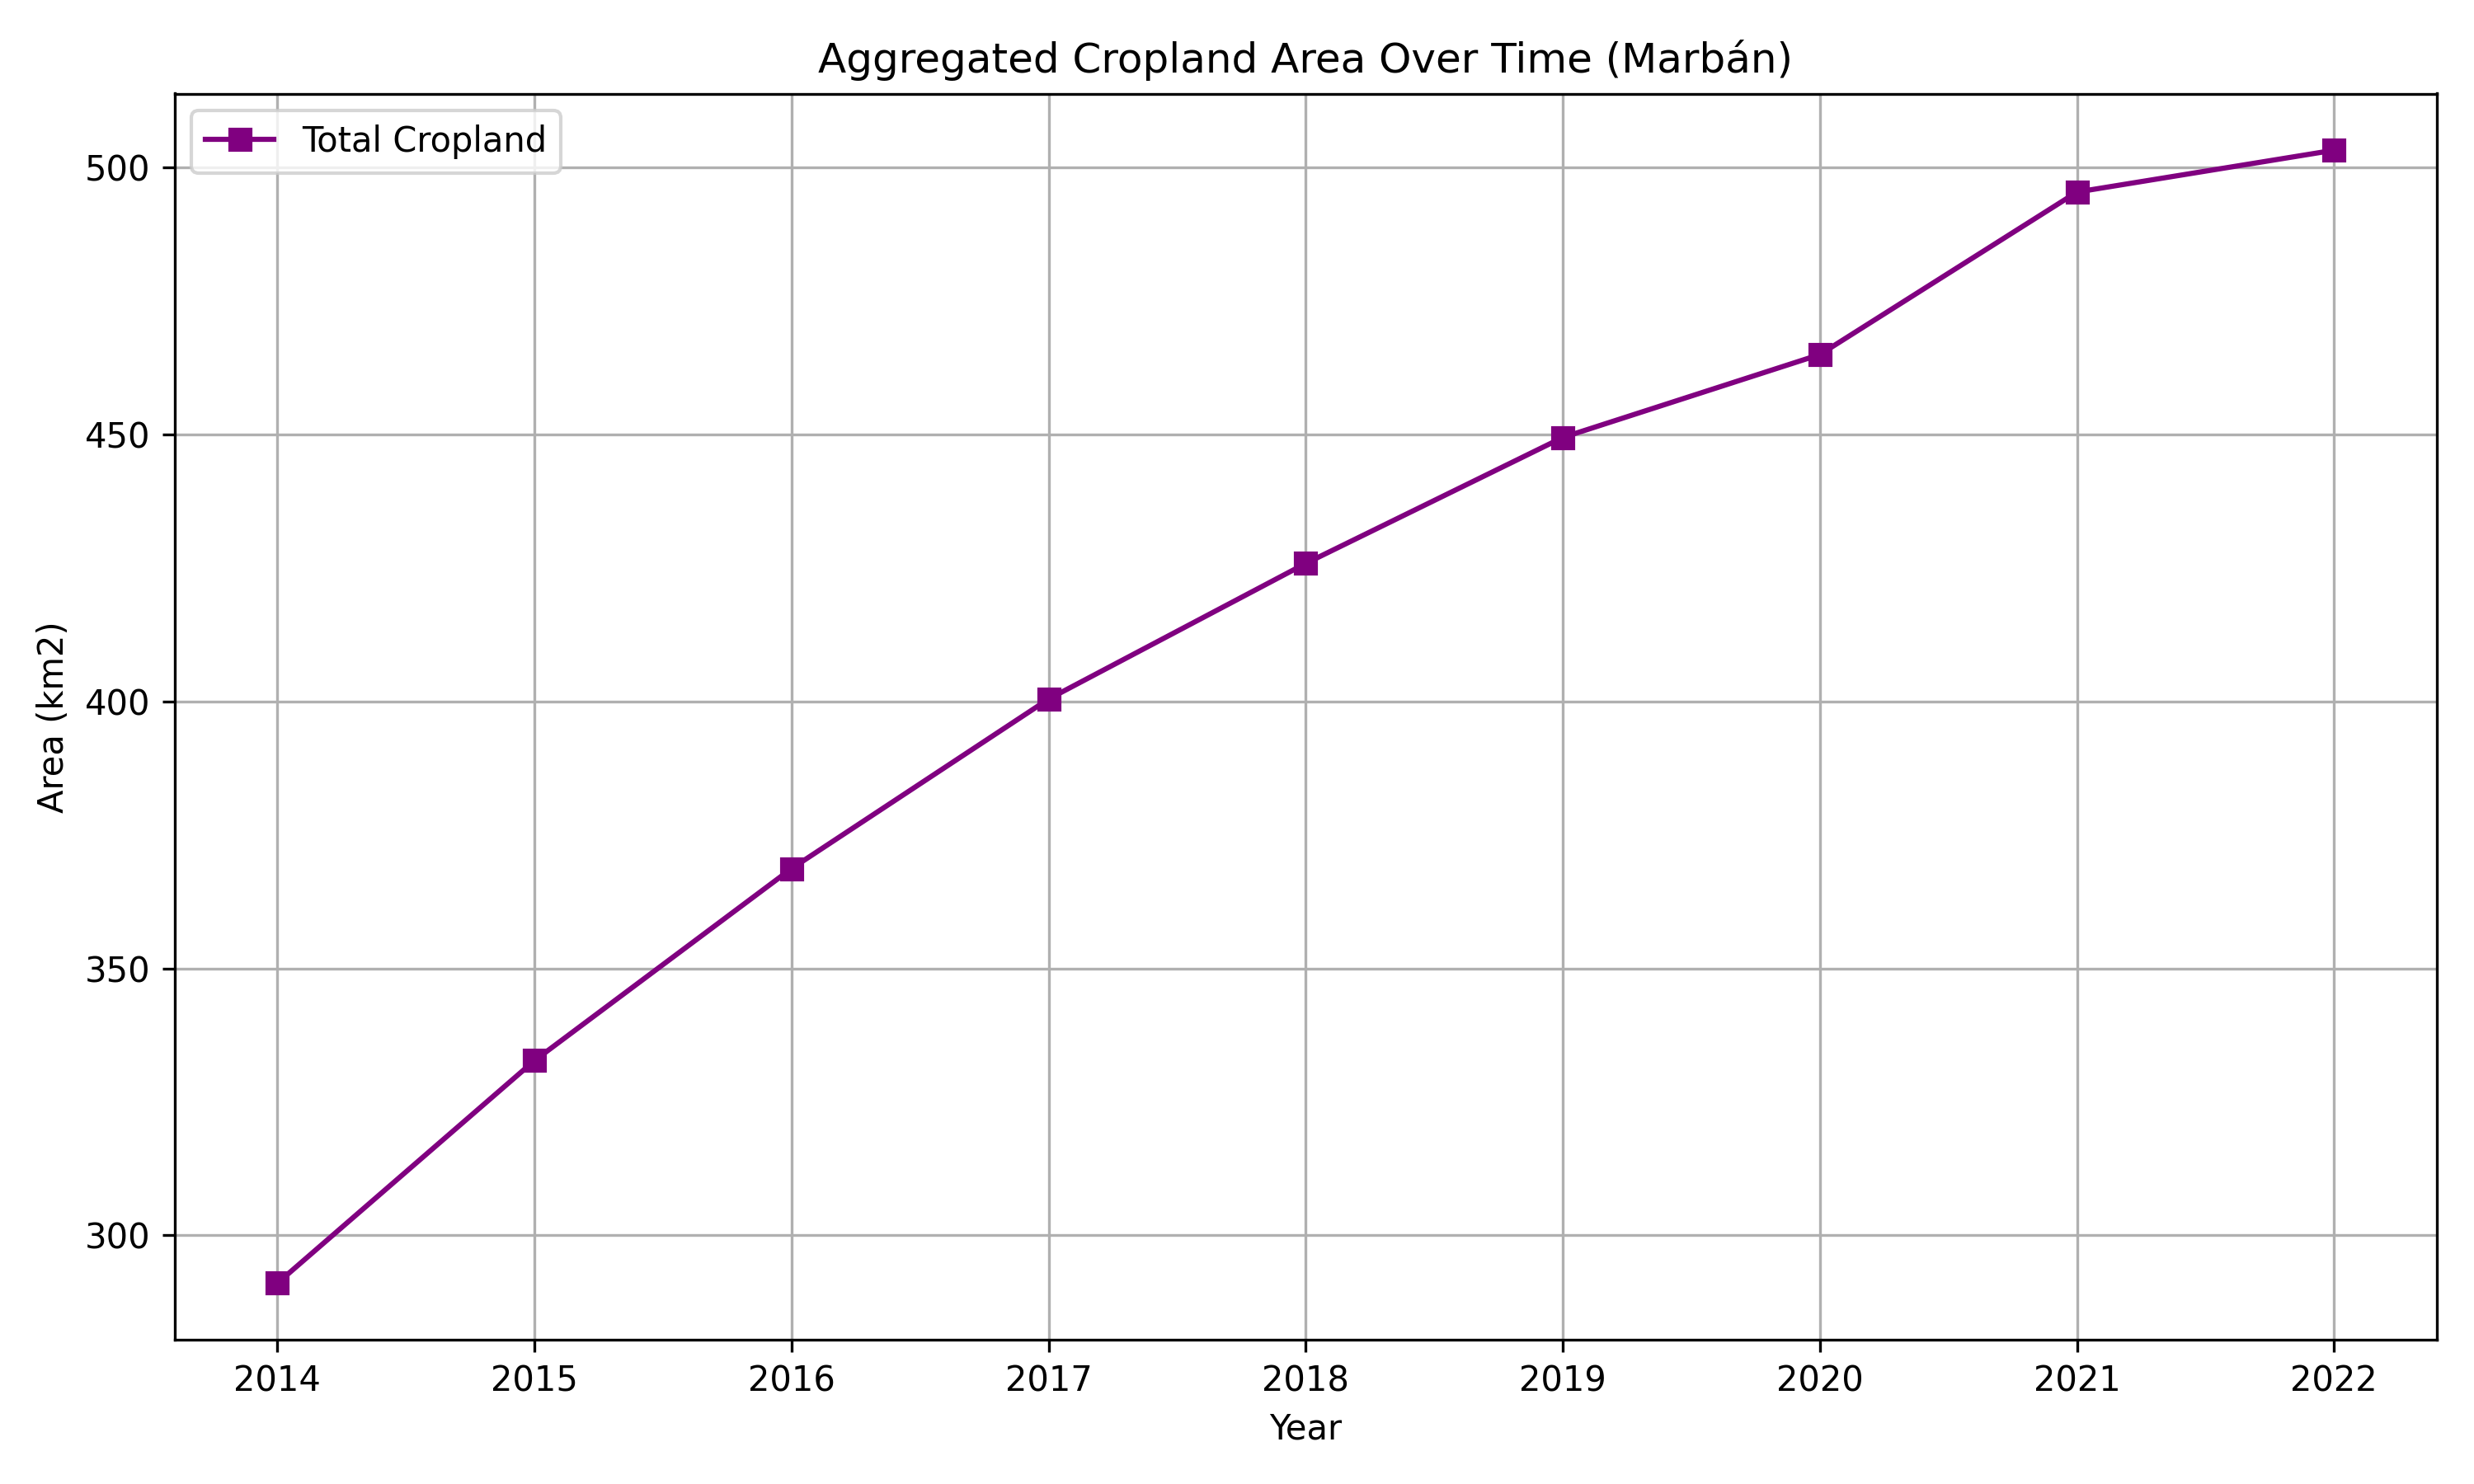
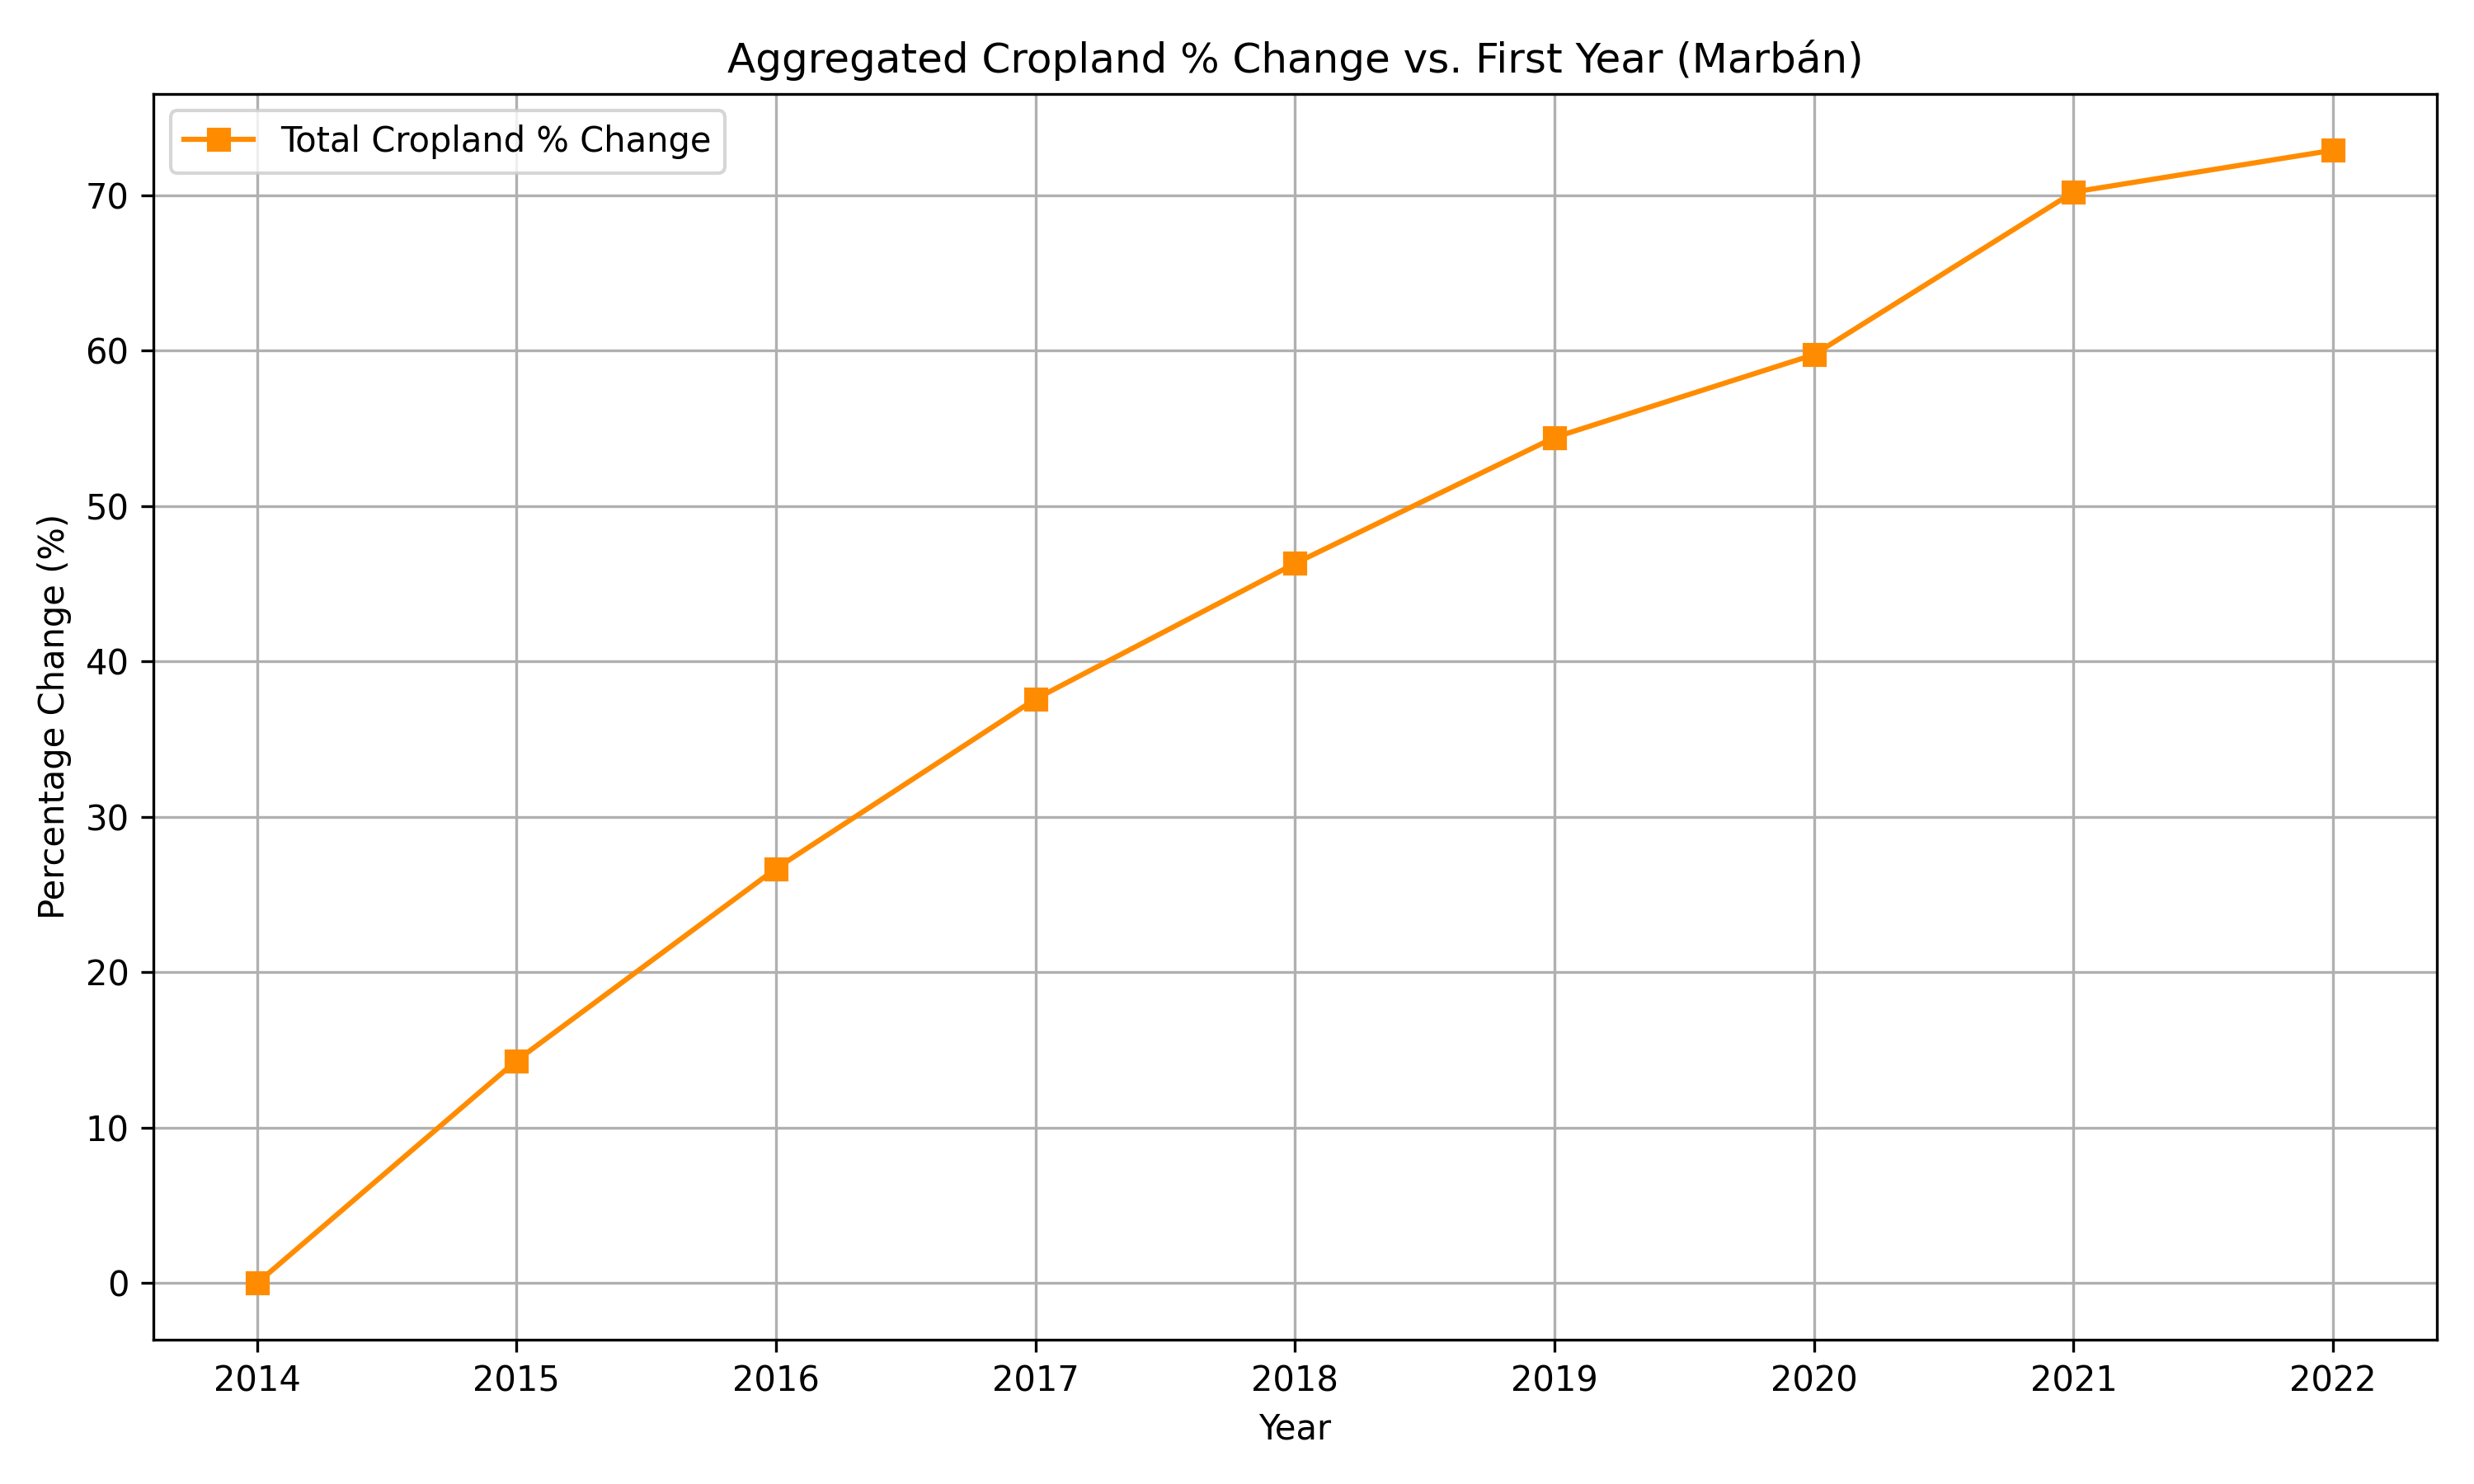
Aggregated Area % increase compared to 2014
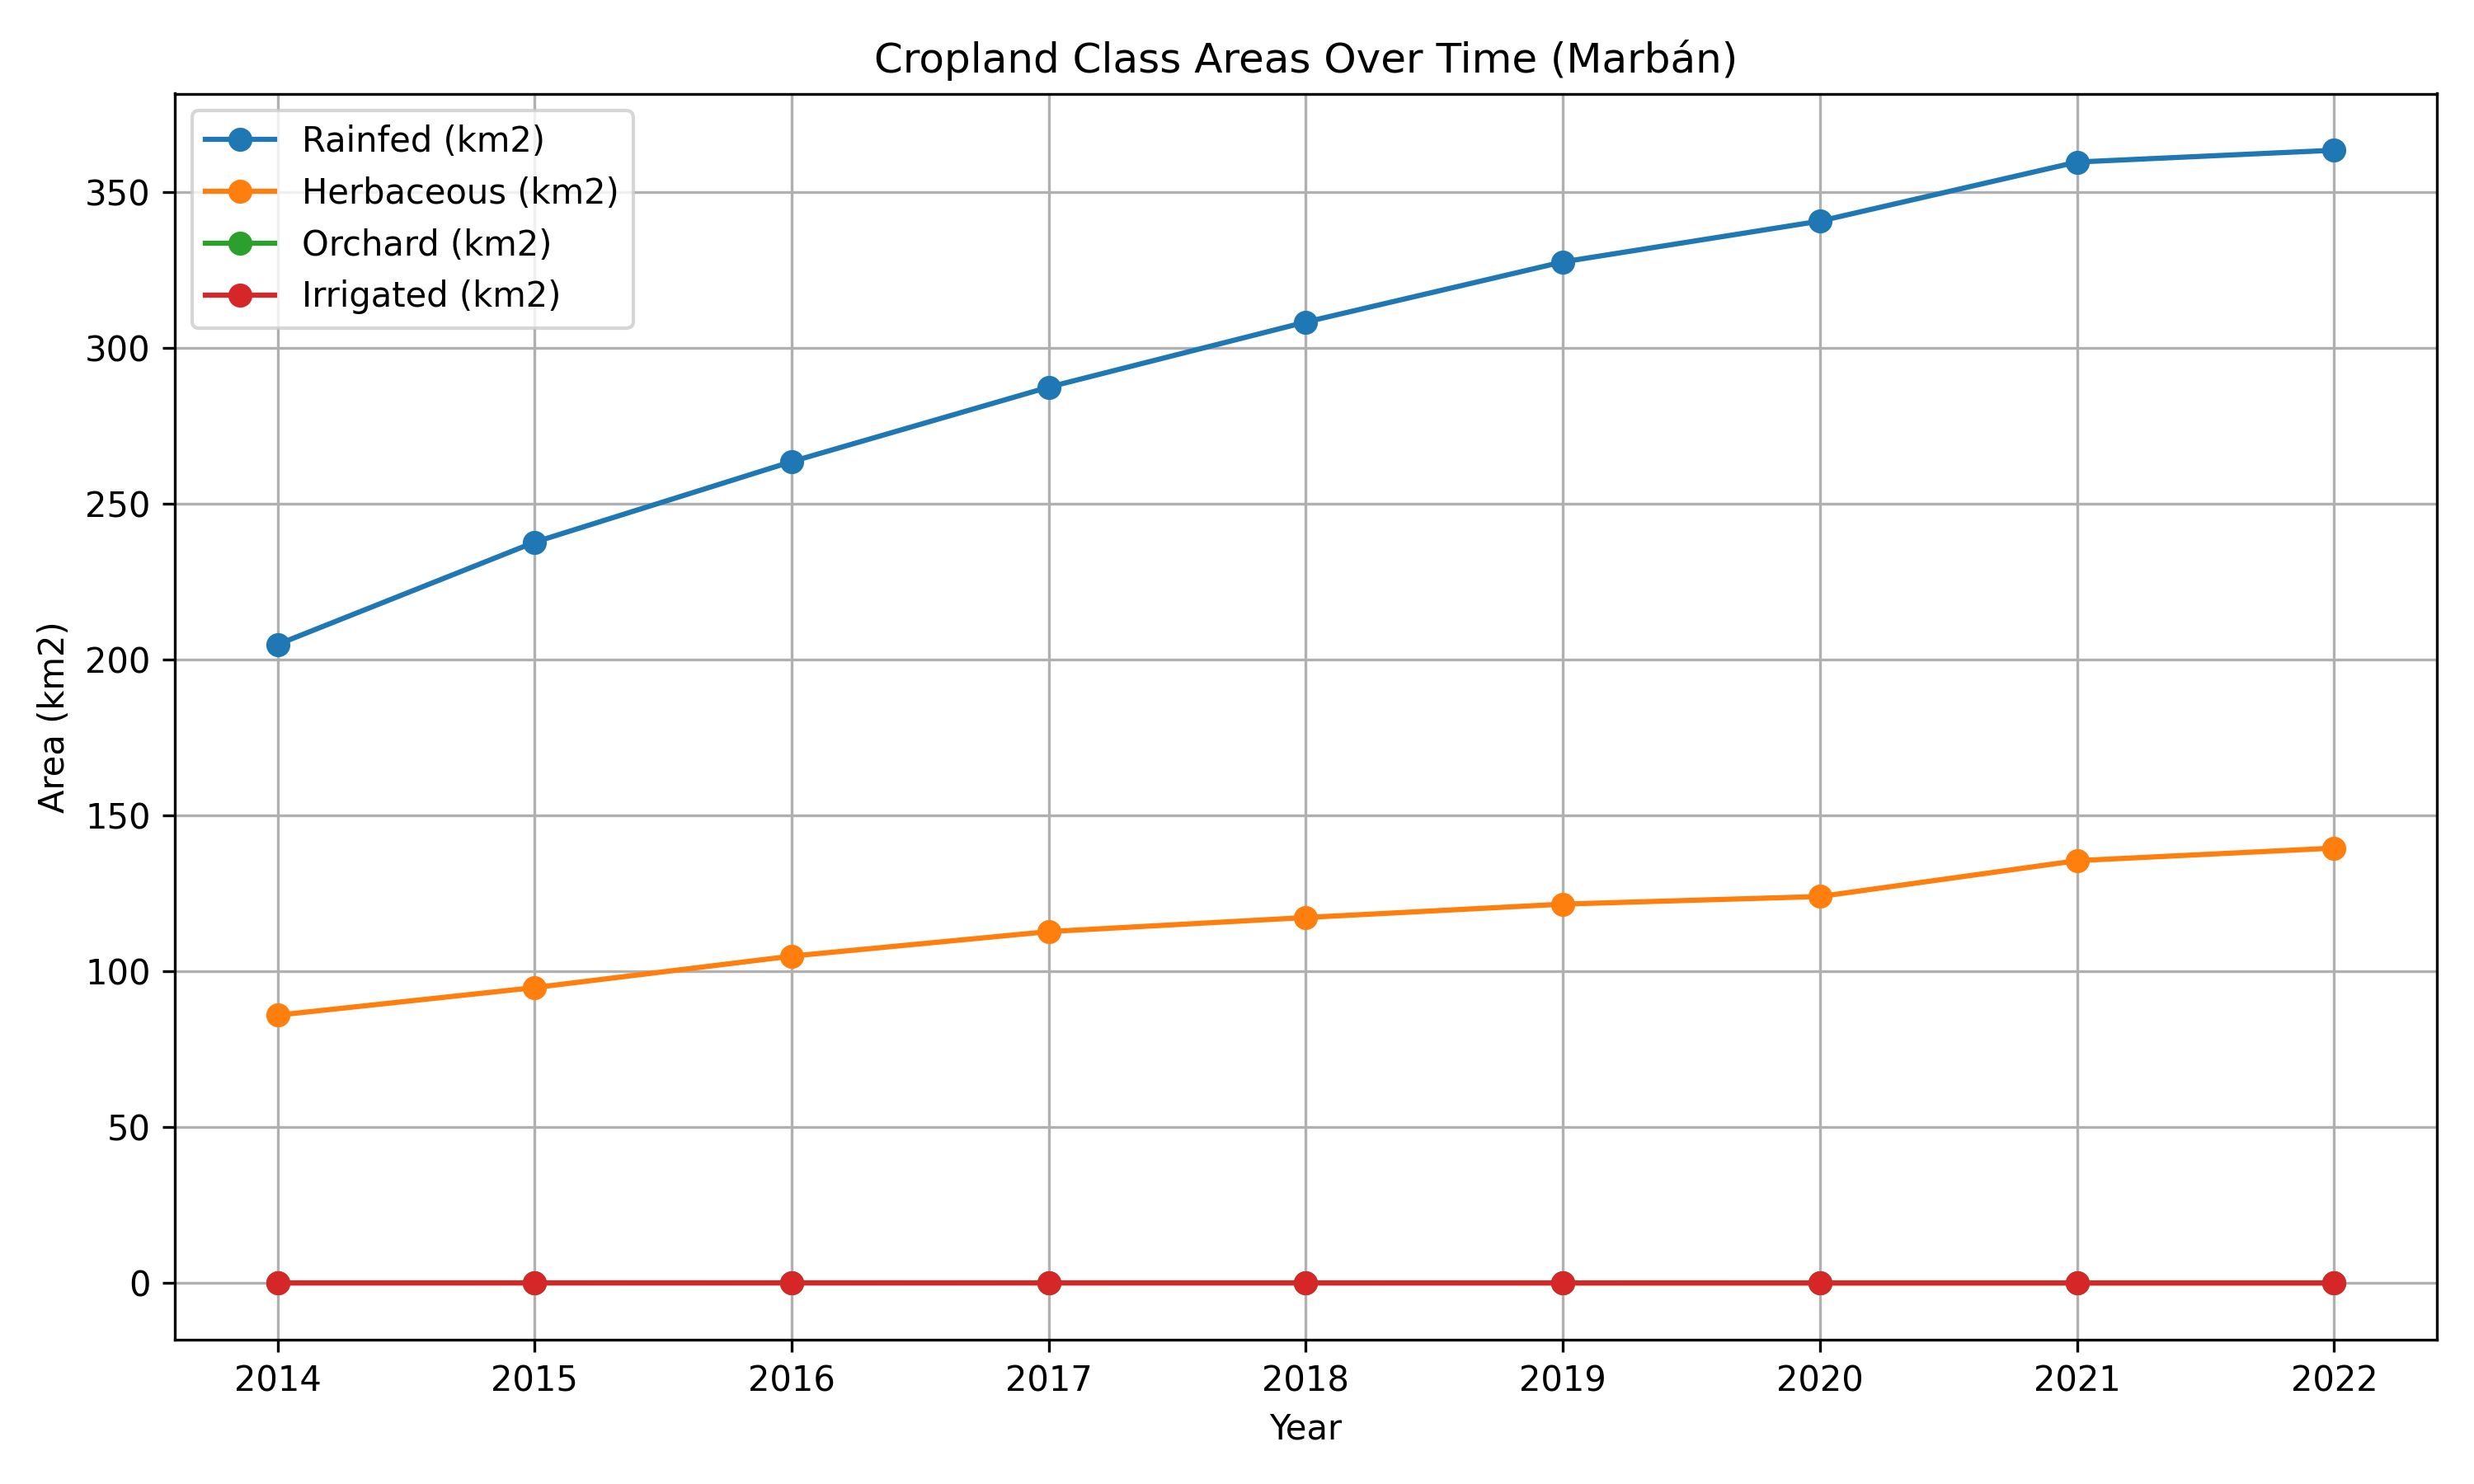
Aggregated Area plot for each cropland type
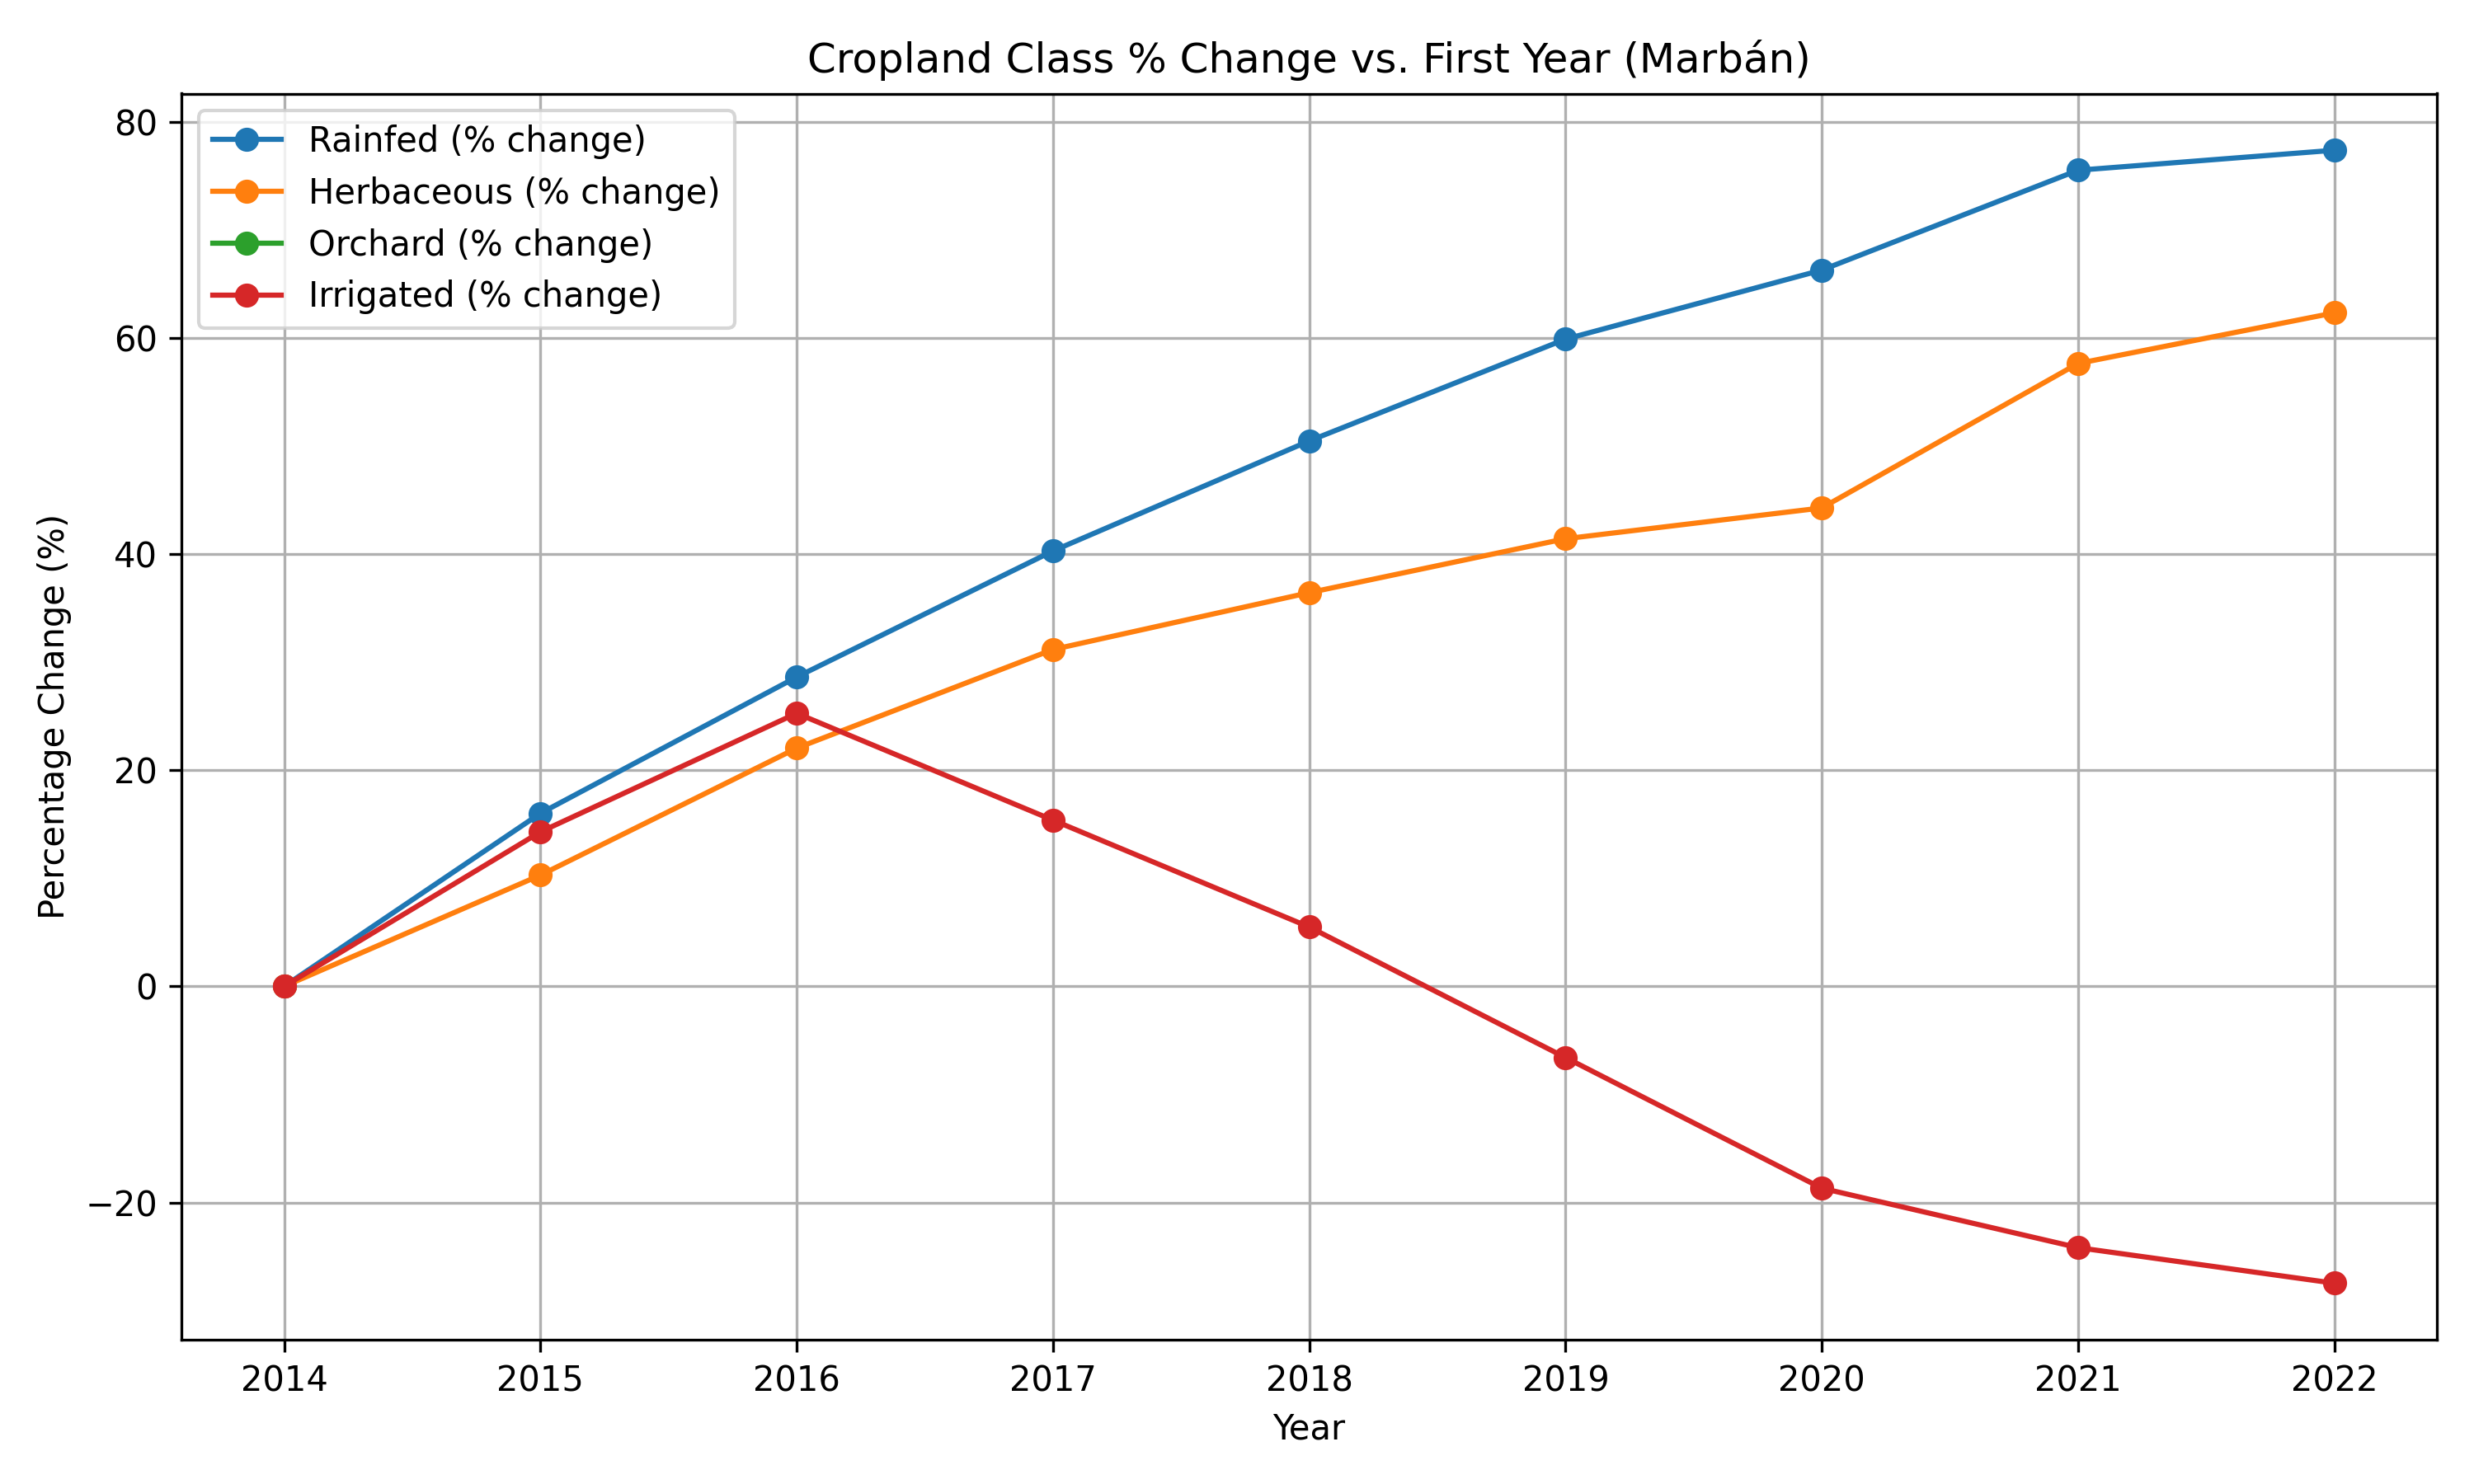
Aggregated Area % increase for each cropland type compared to 2014
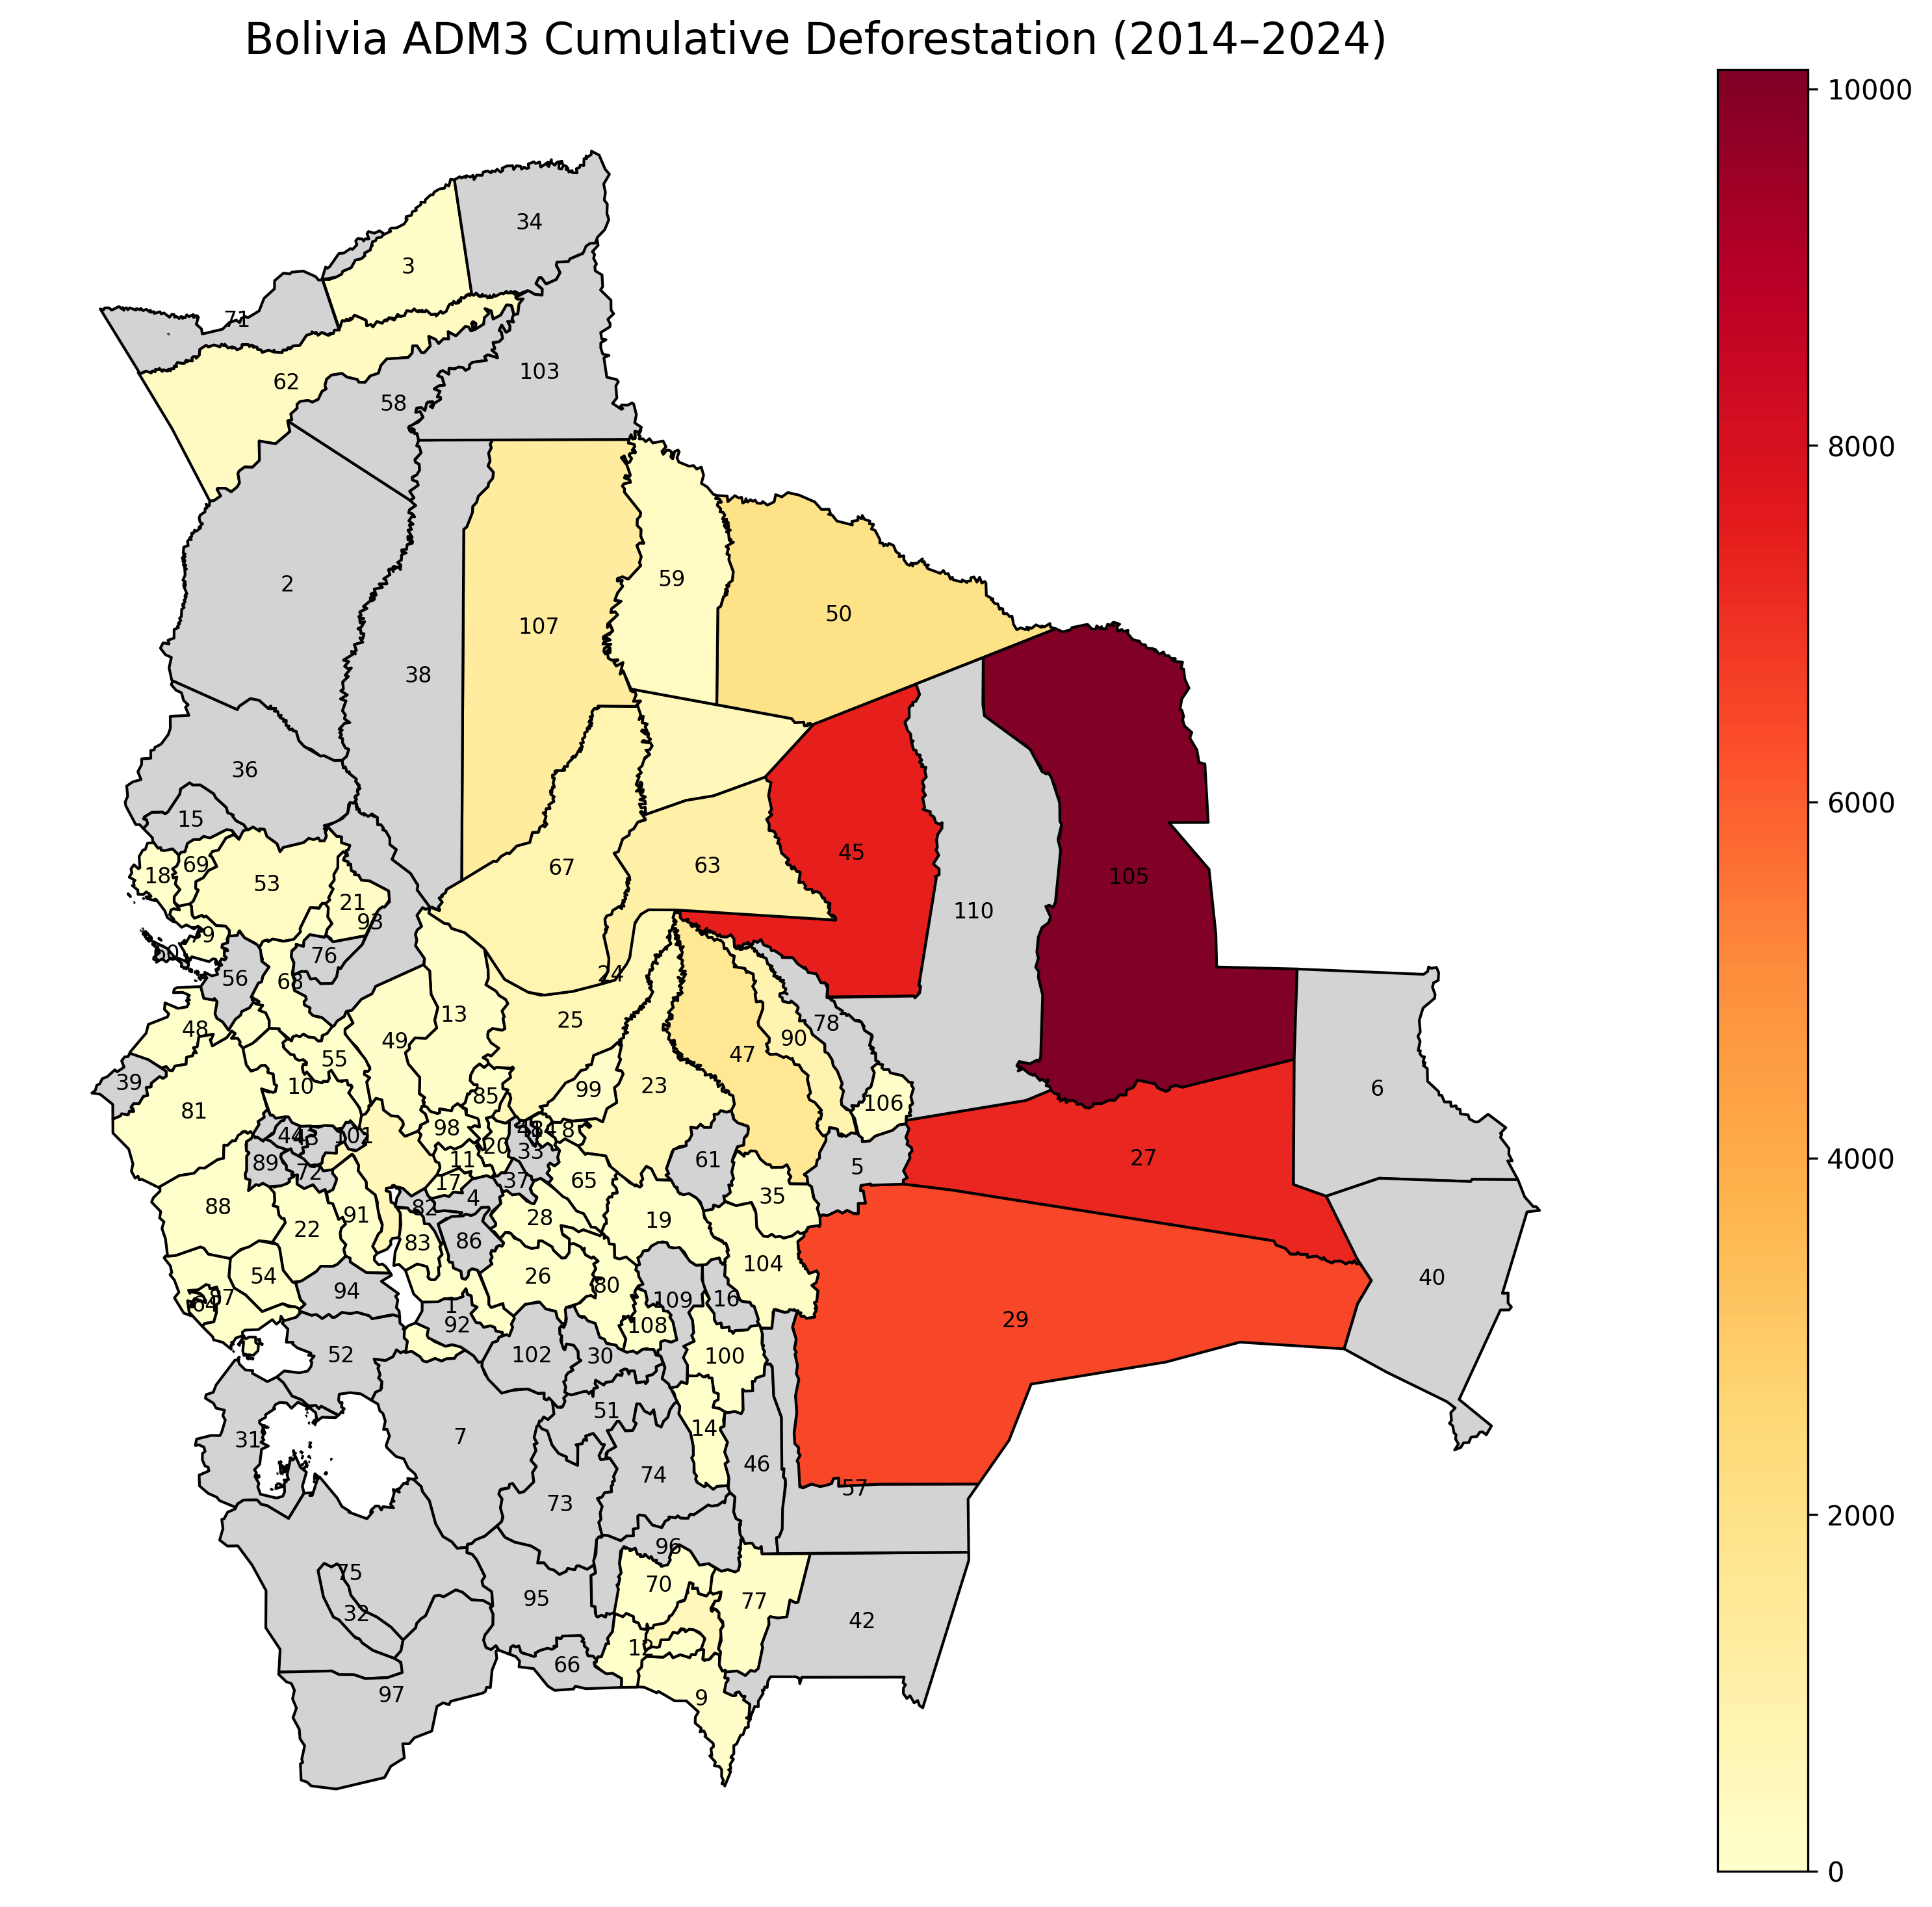
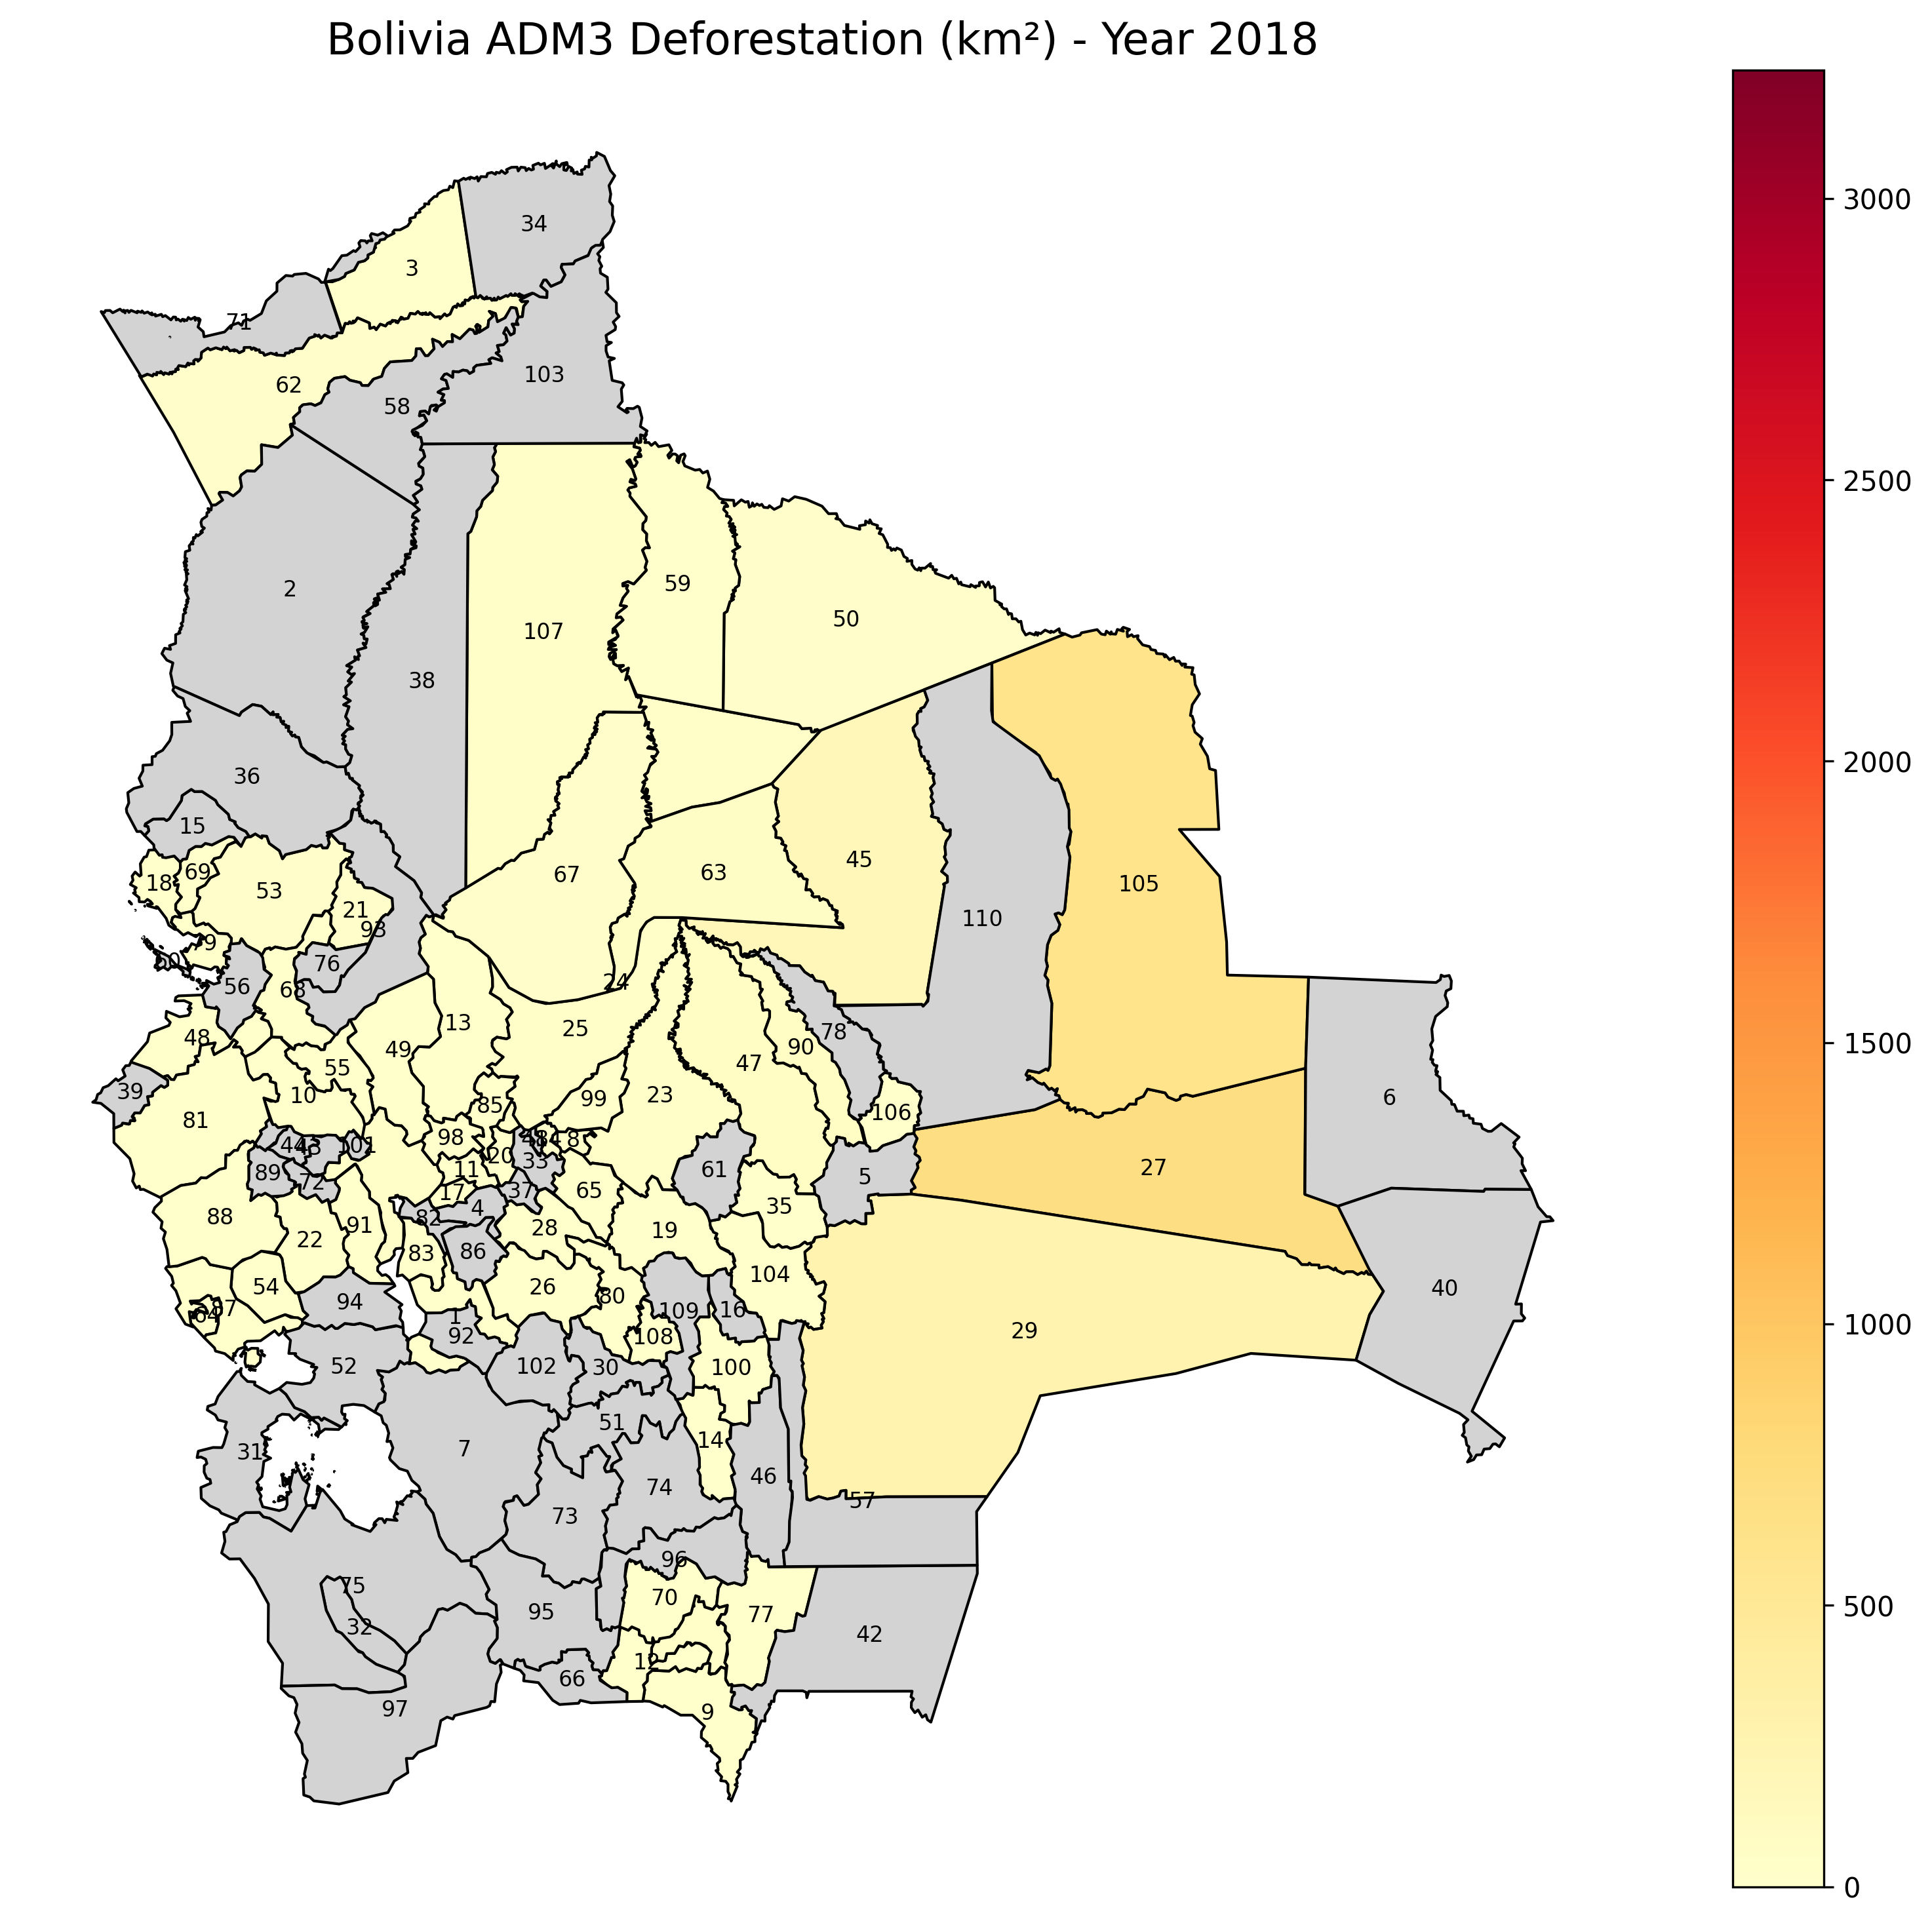
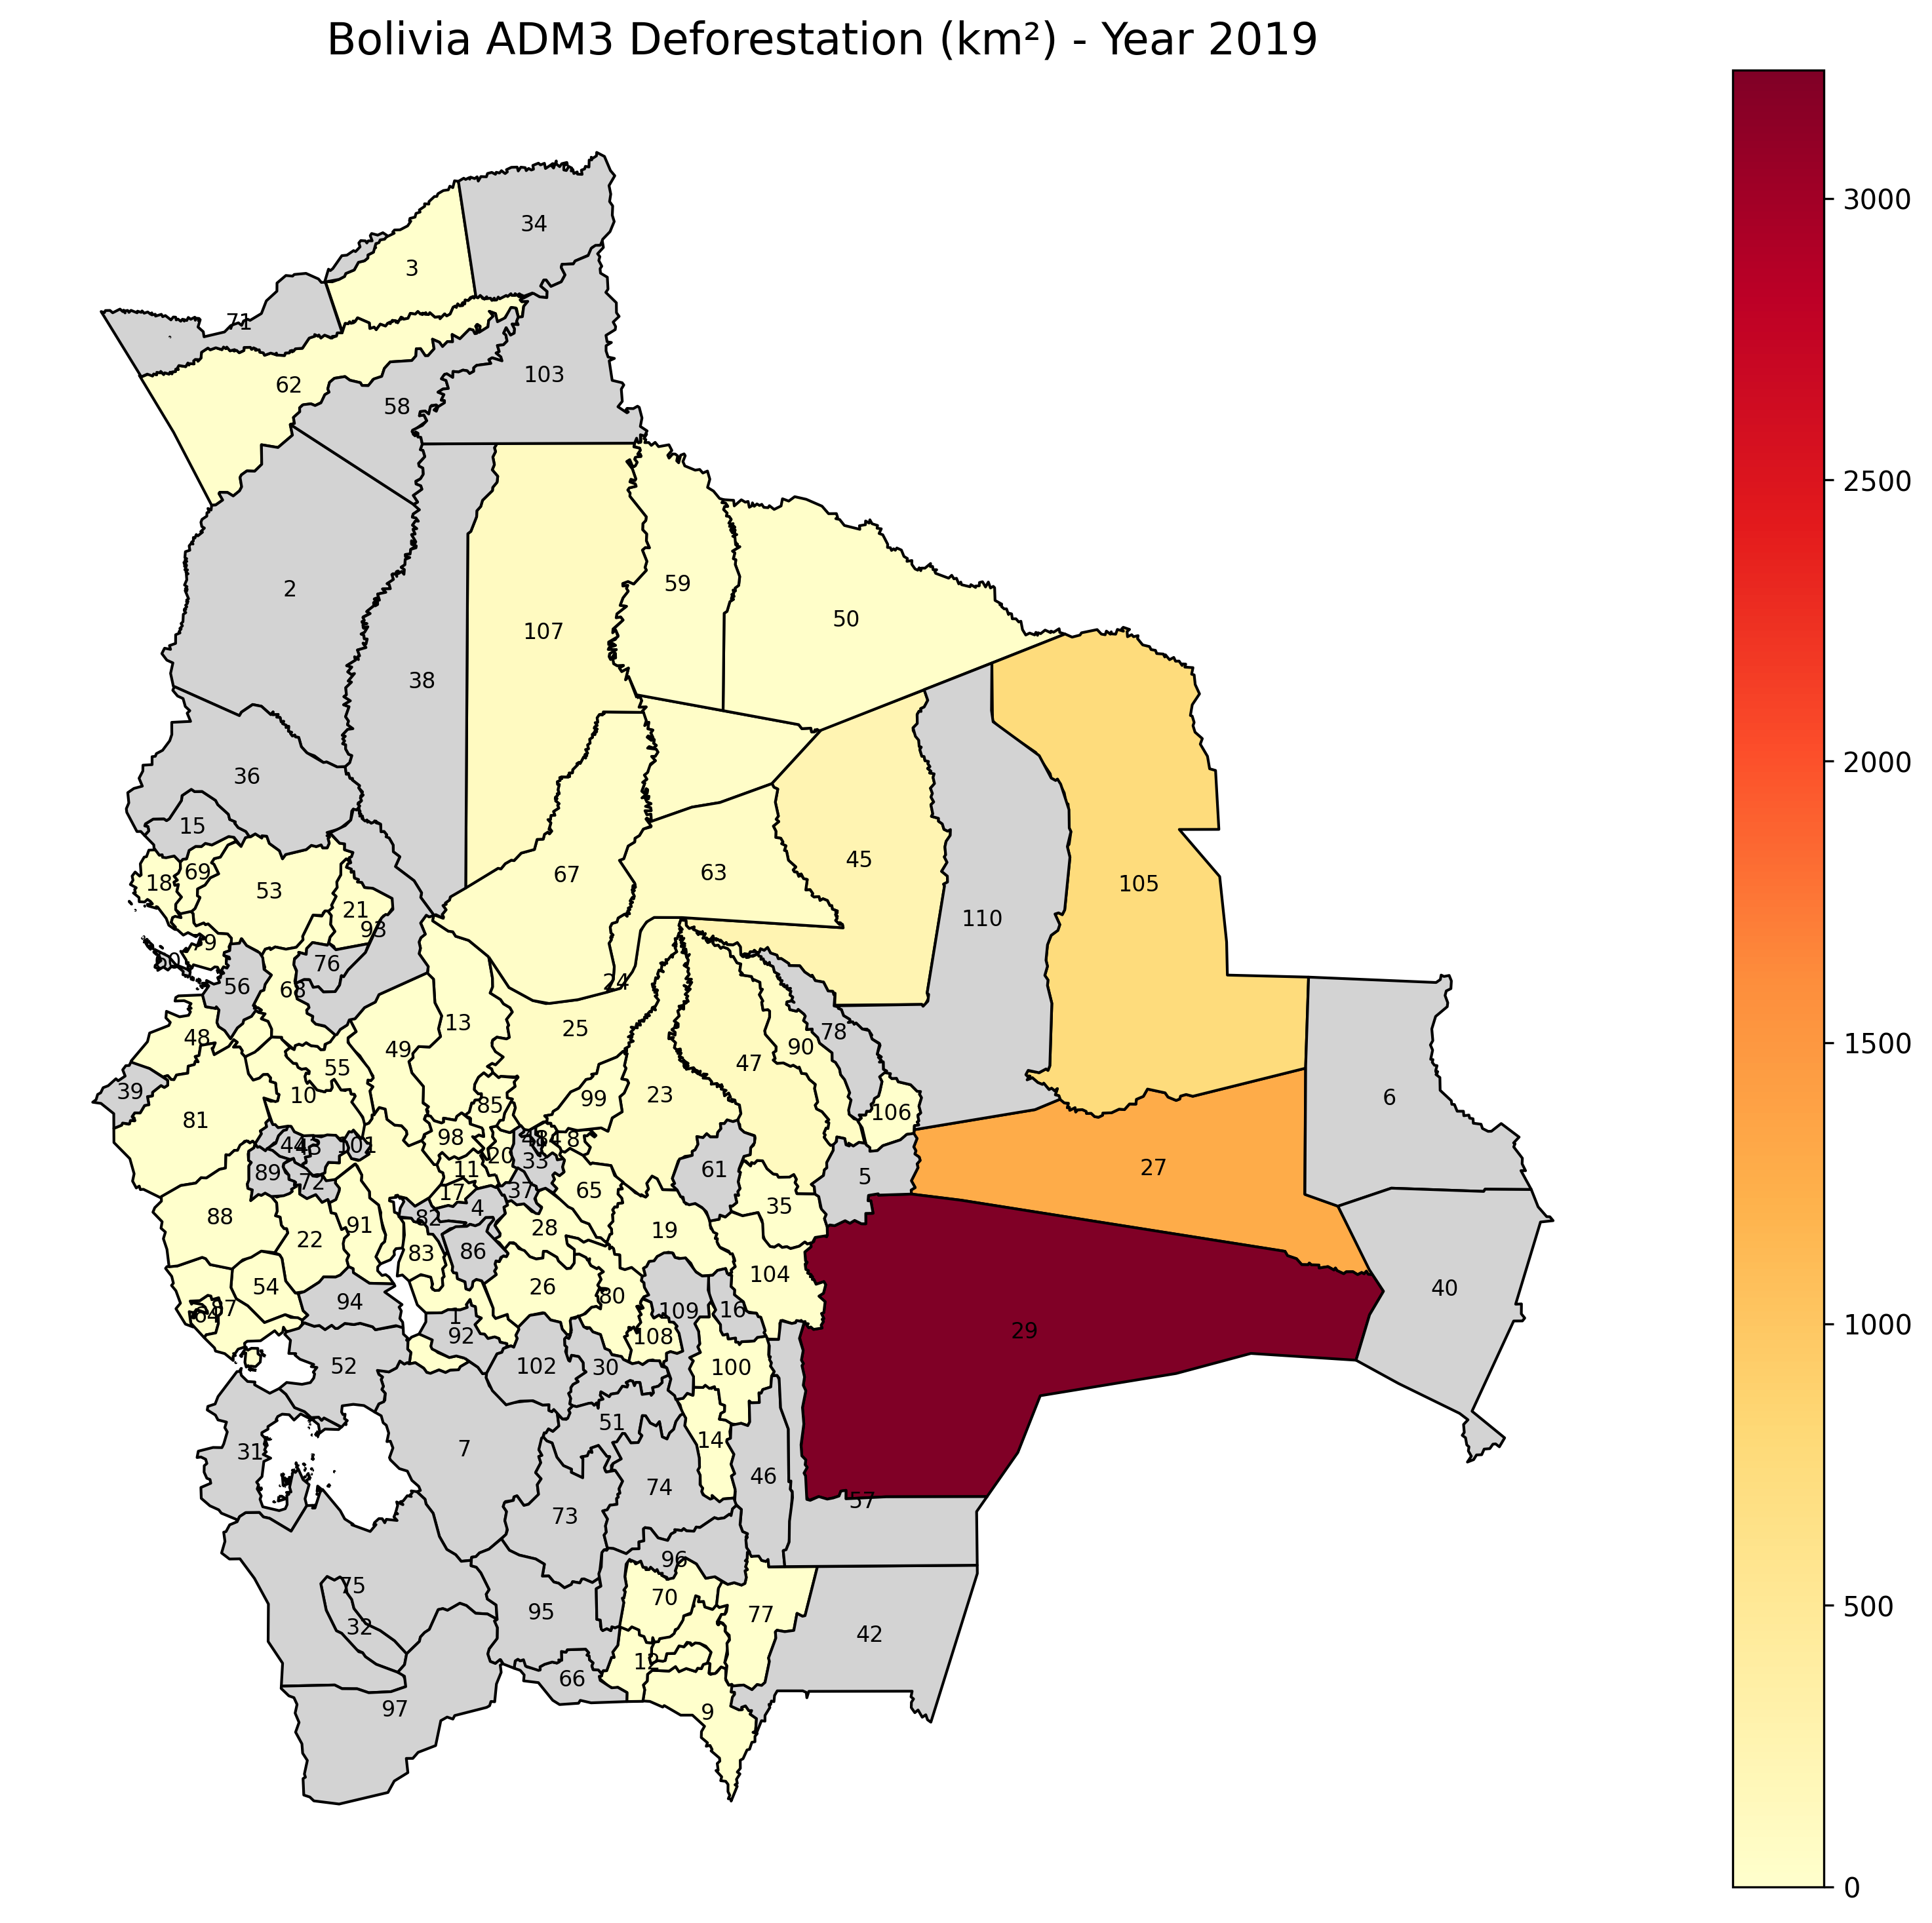
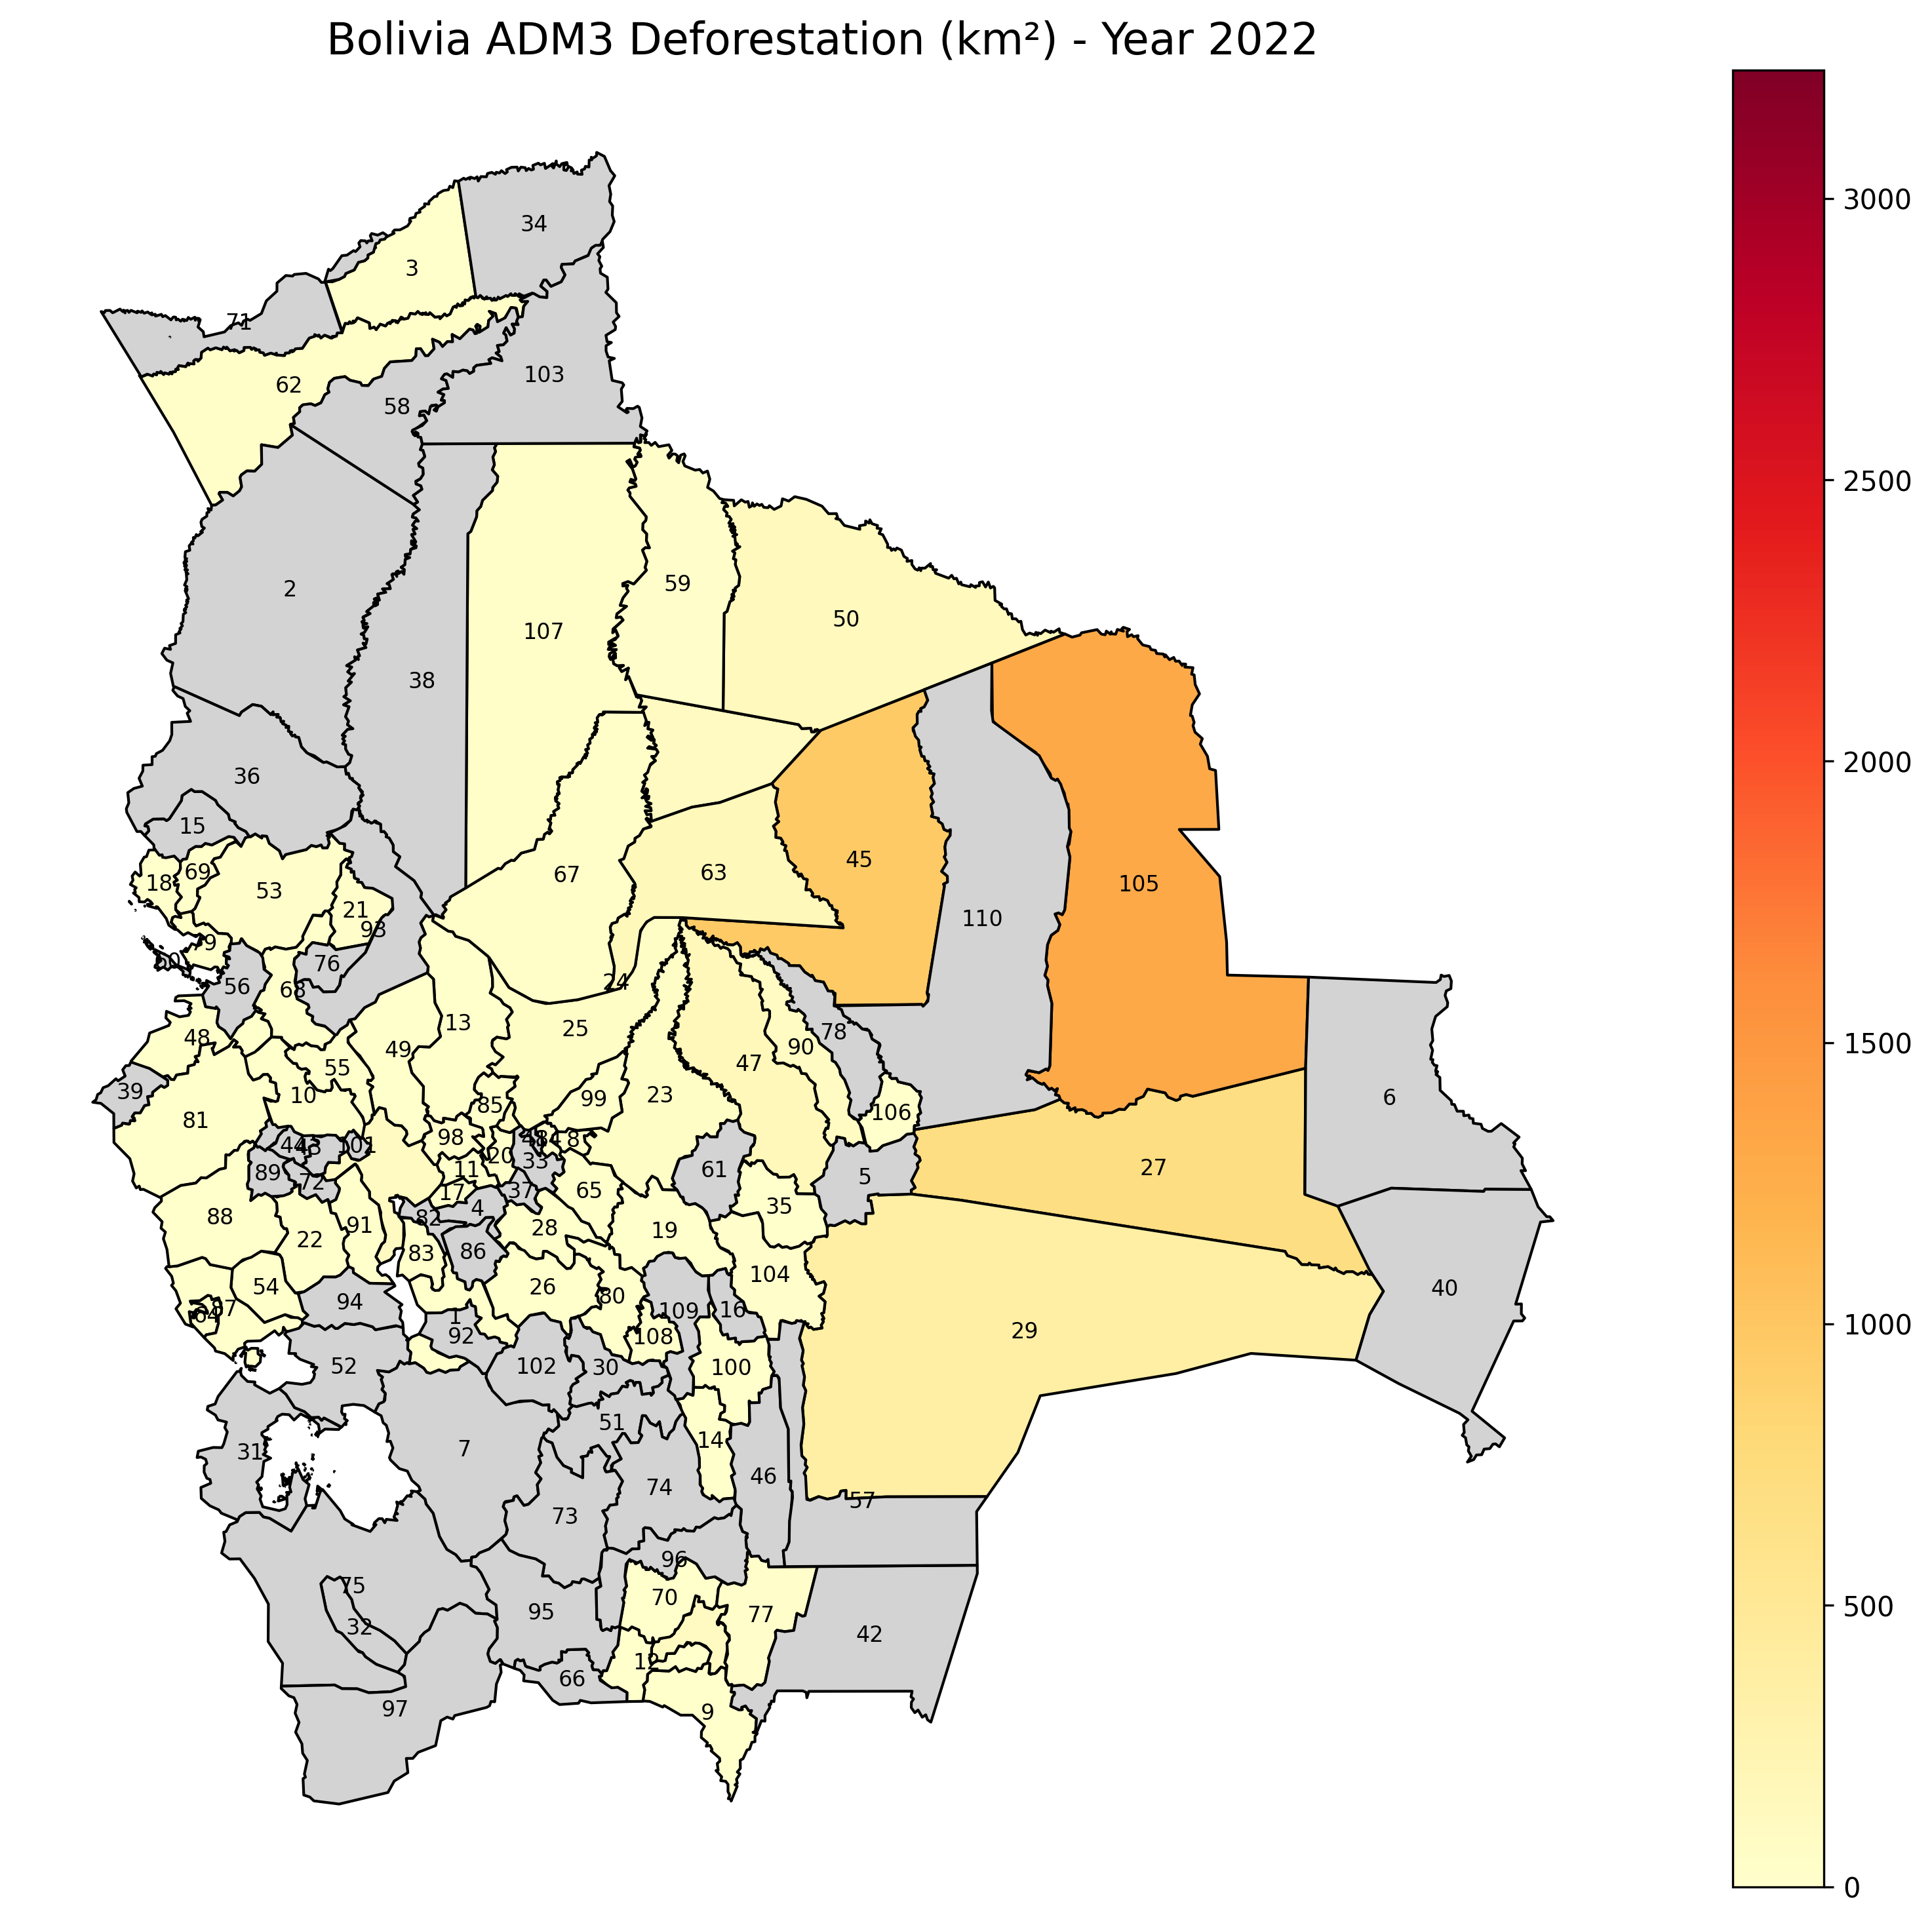
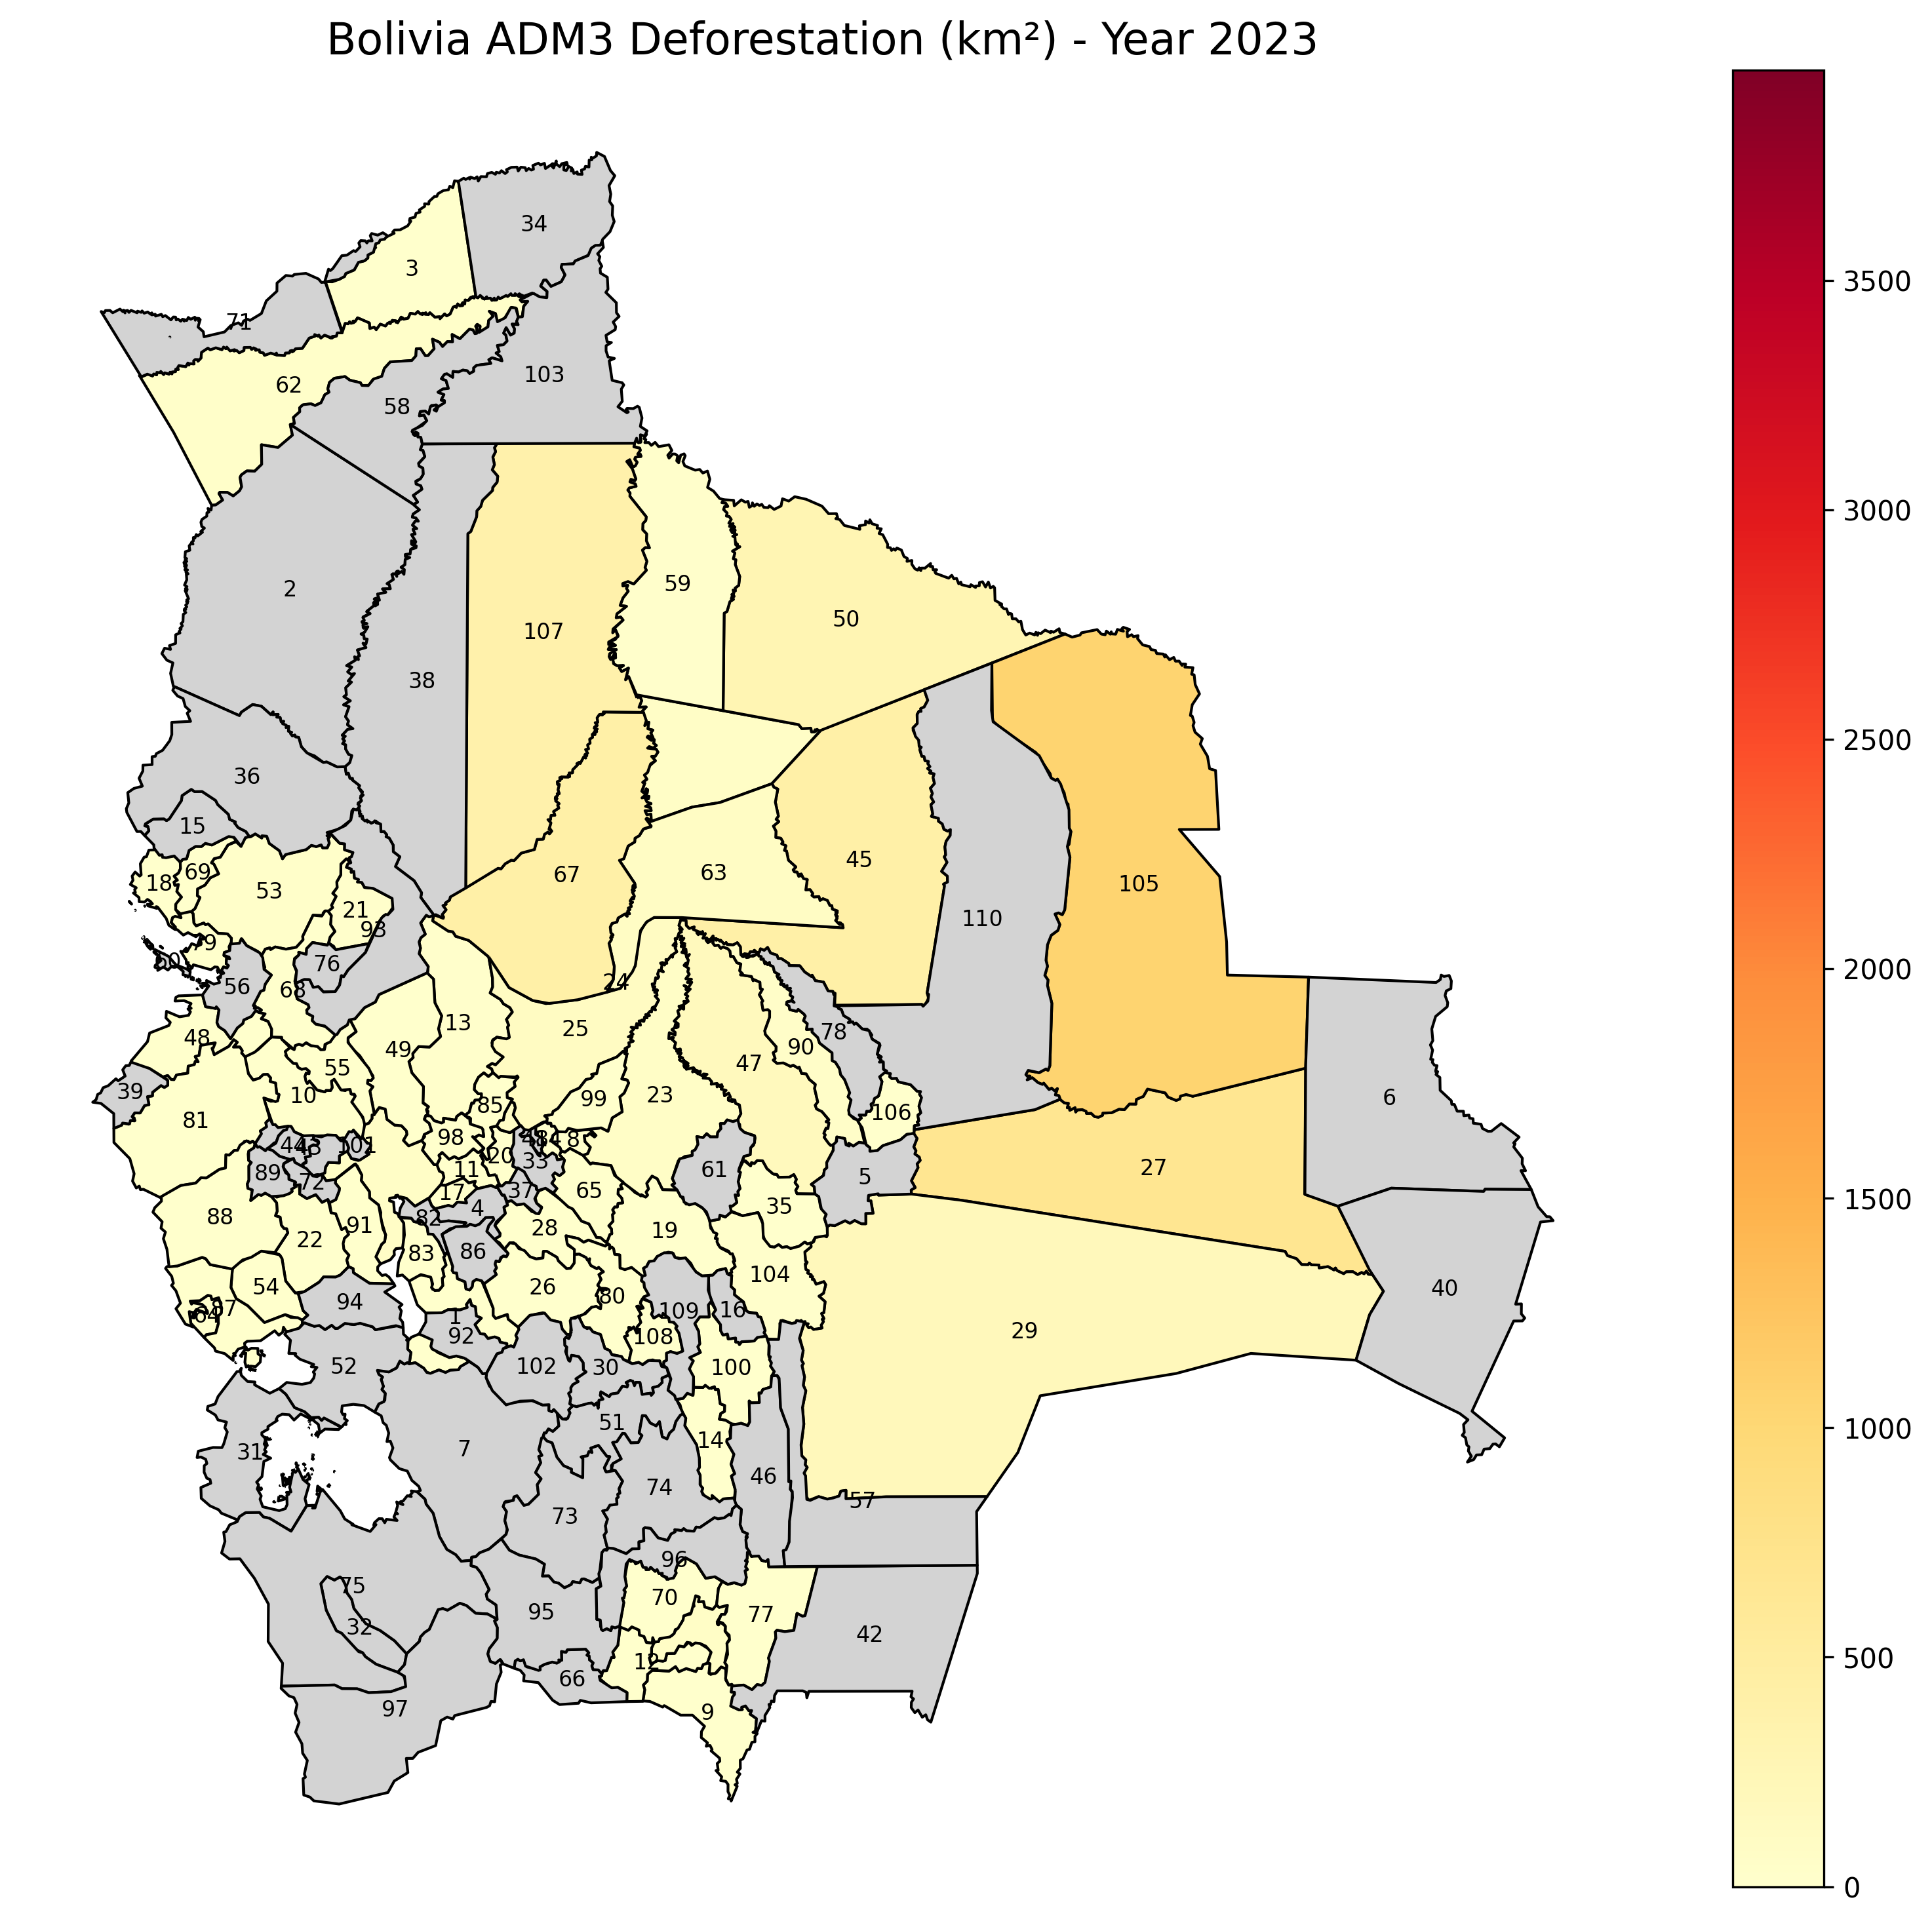
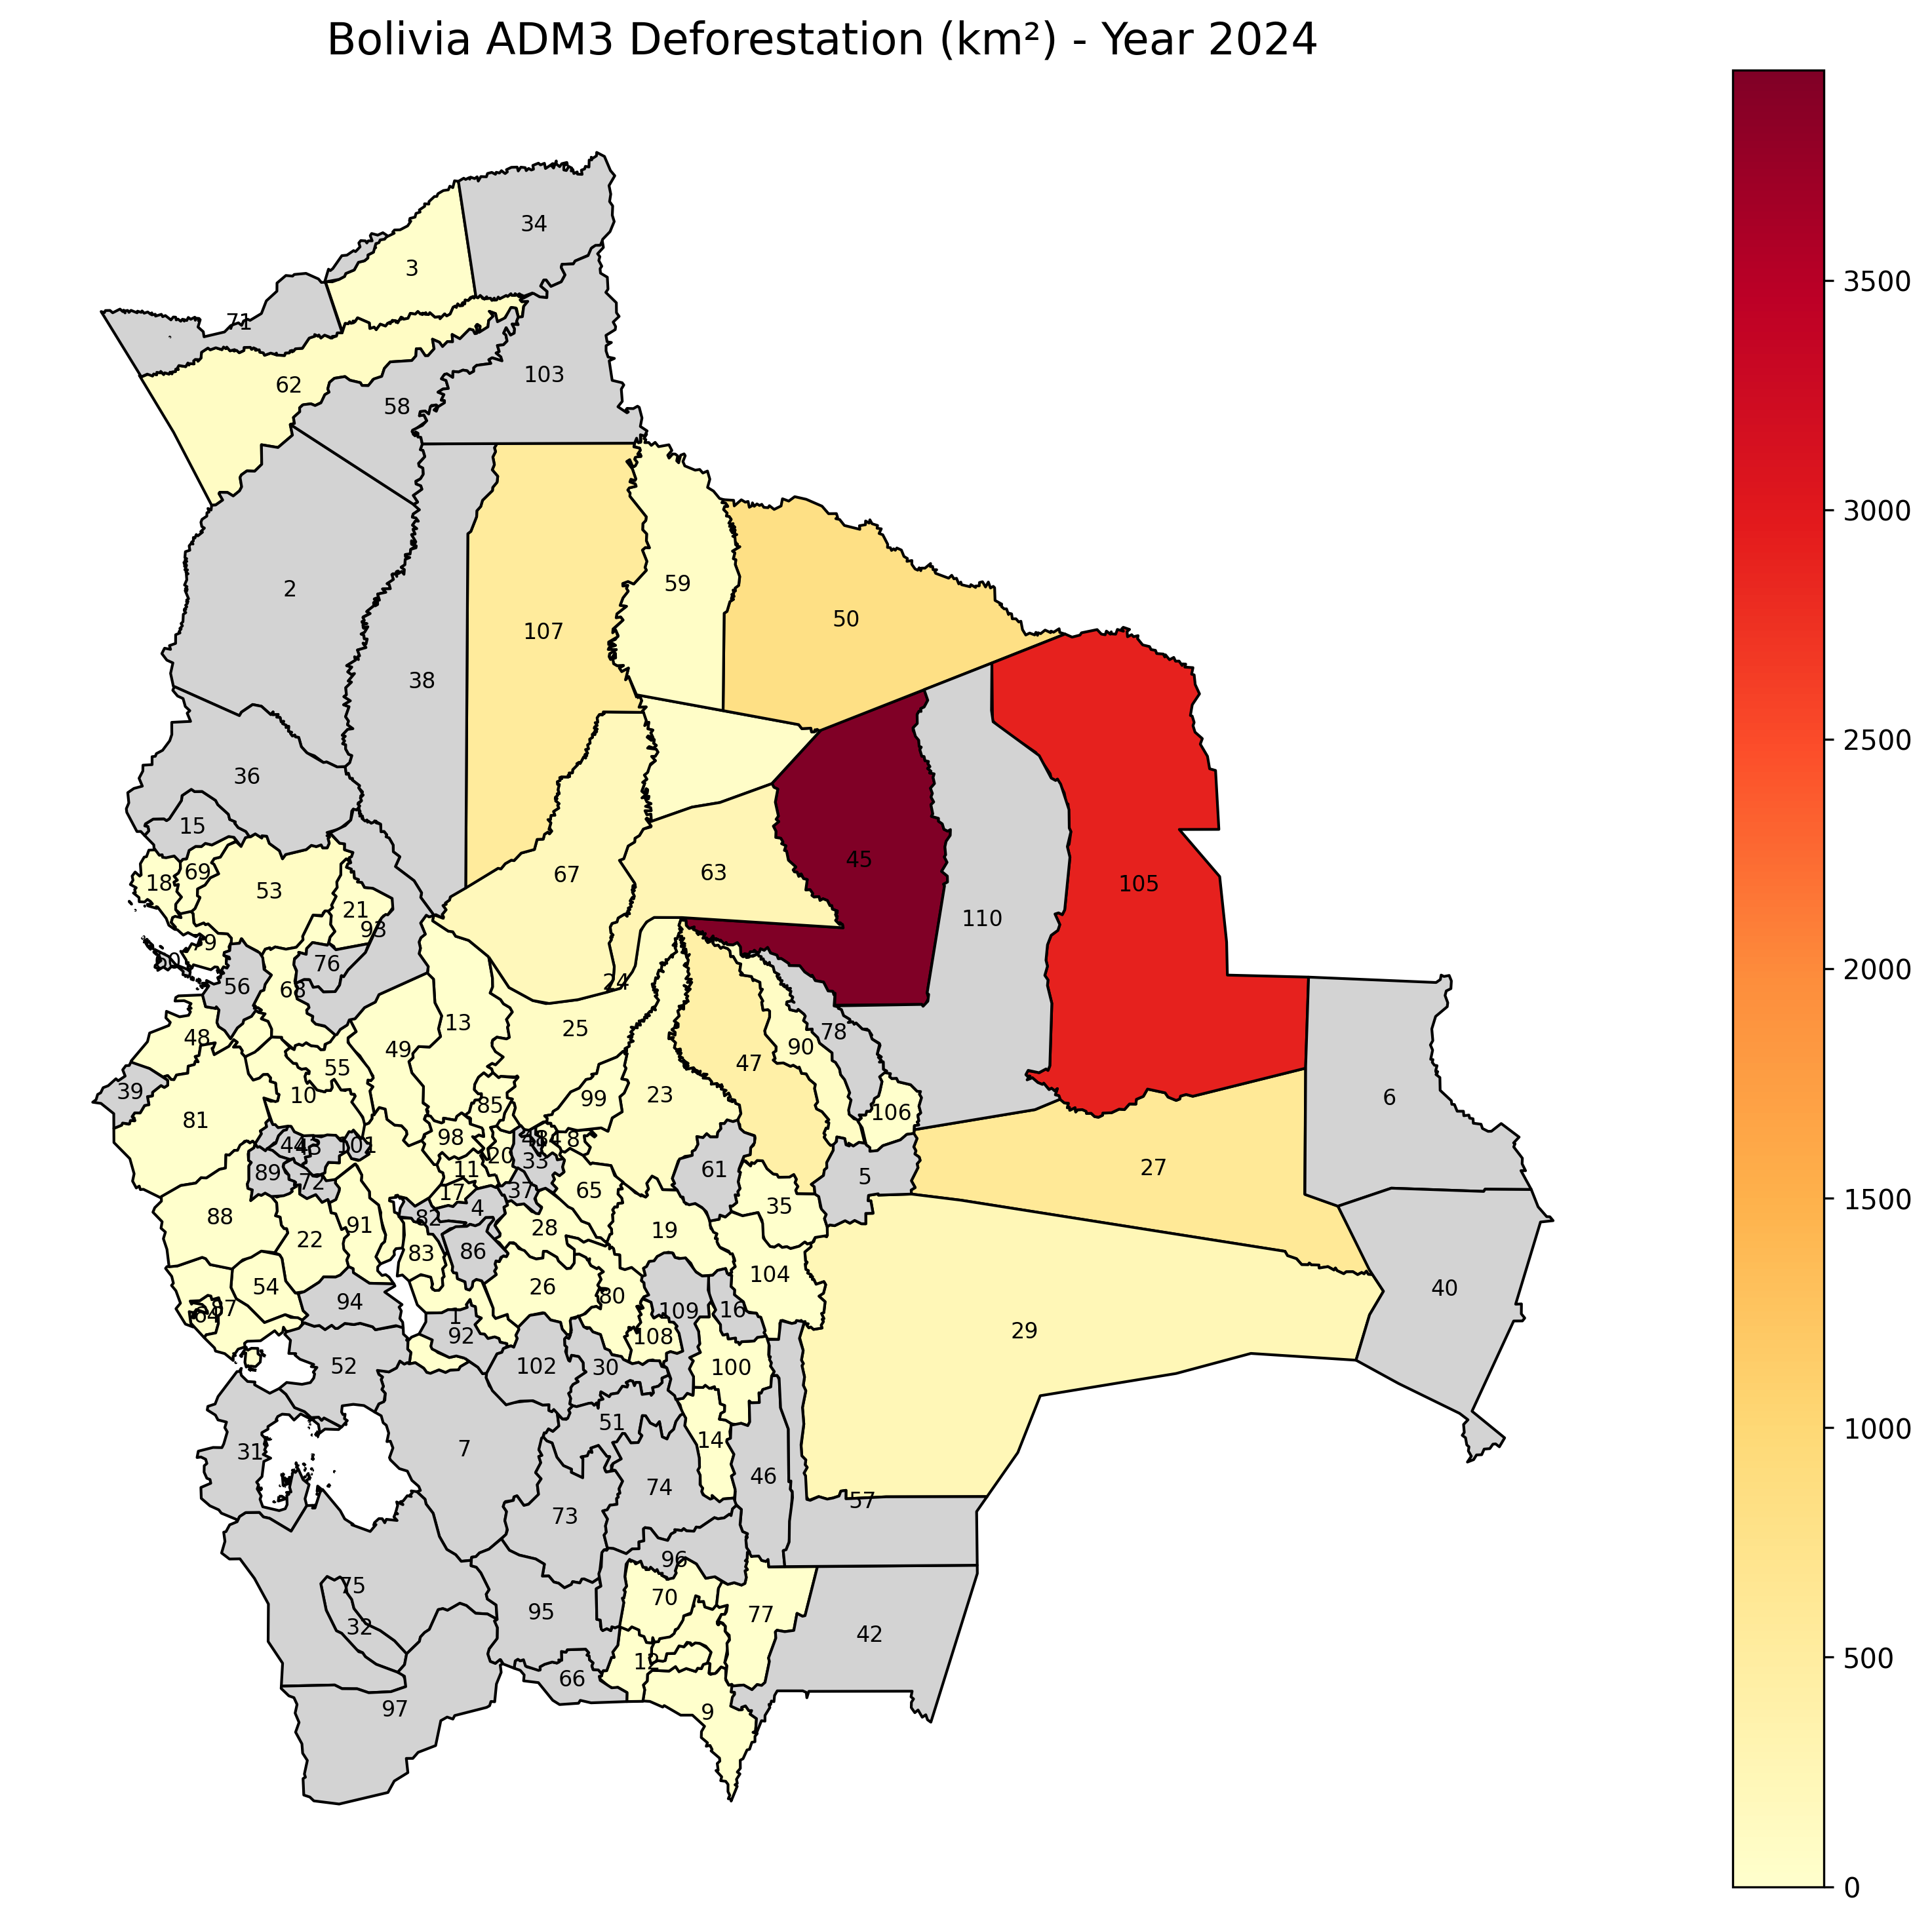
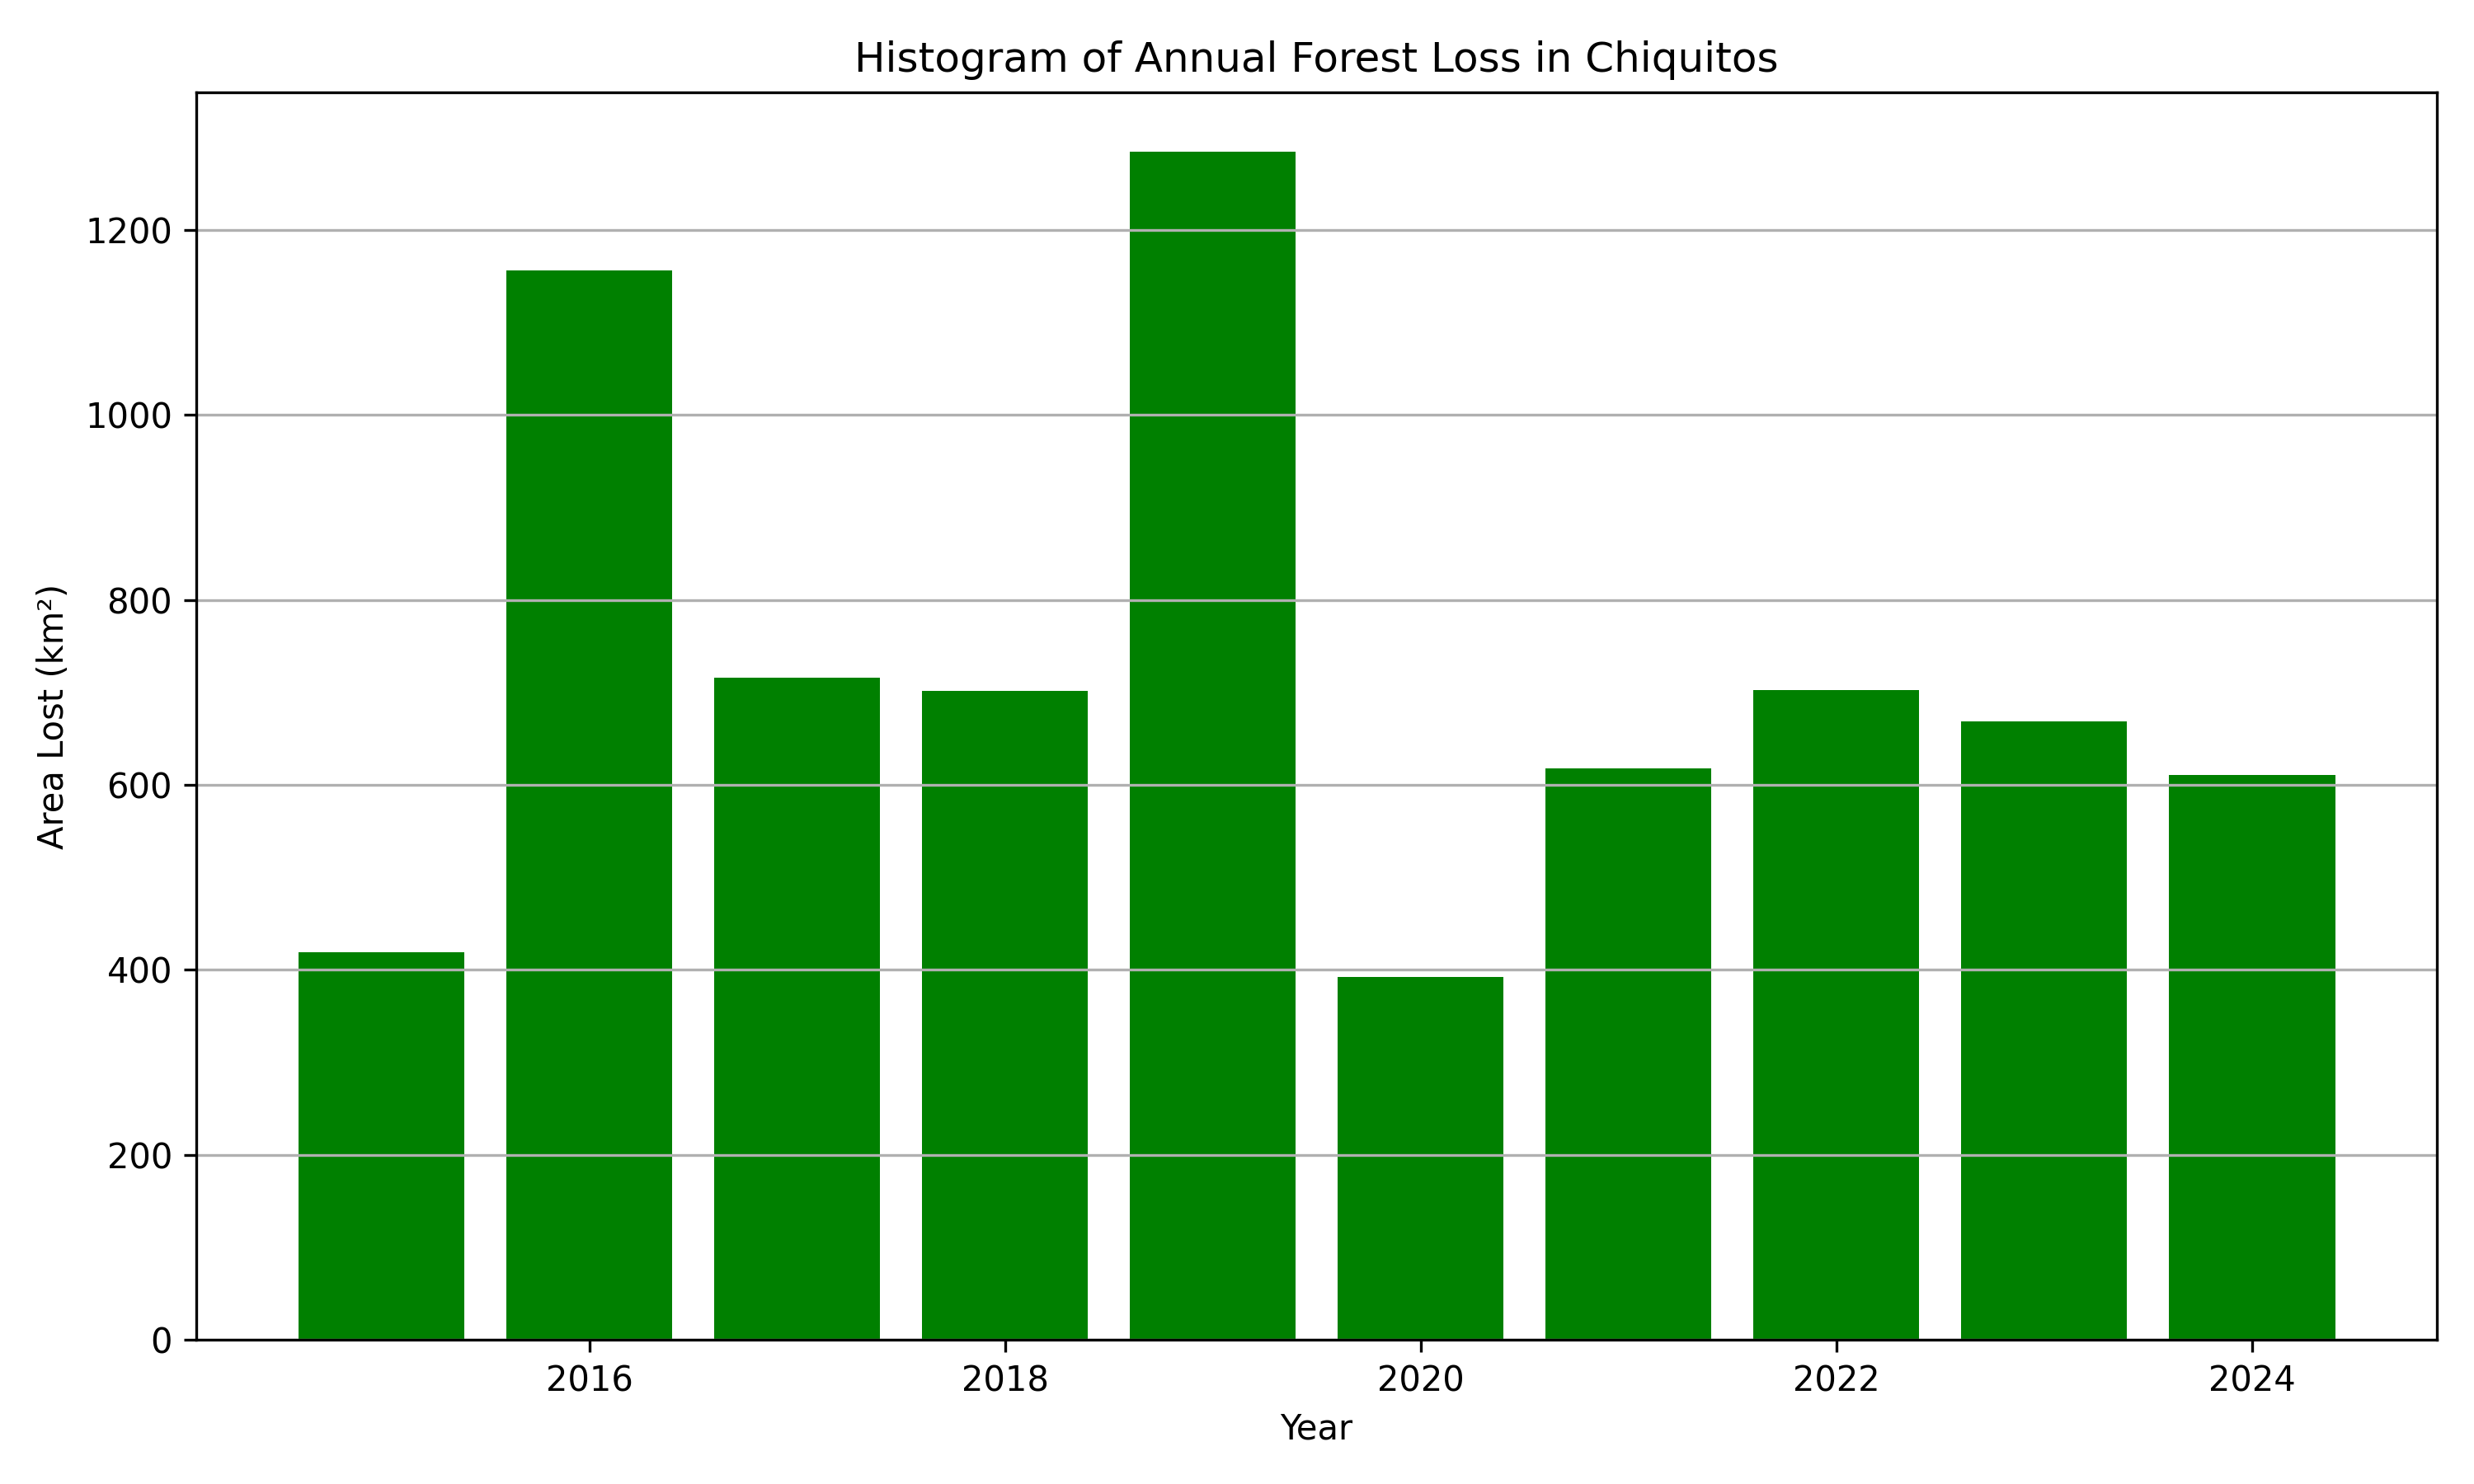
e. Deforestation#
#### e. Deforestation

import pandas as pd

df_gainers = pd.read_csv('my_deforestation_outputs/deforestation_top_ADM_rankings.csv')
df_gainers.head(10)
| Year | Rank | ADMName | area_km2 | Deforestation_pct_of_ADM | |
|---|---|---|---|---|---|
| 0 | 2015 | 1 | Chiquitos | 418.8 | 1.05 |
| 1 | 2015 | 2 | Velasco | 226.2 | 0.33 |
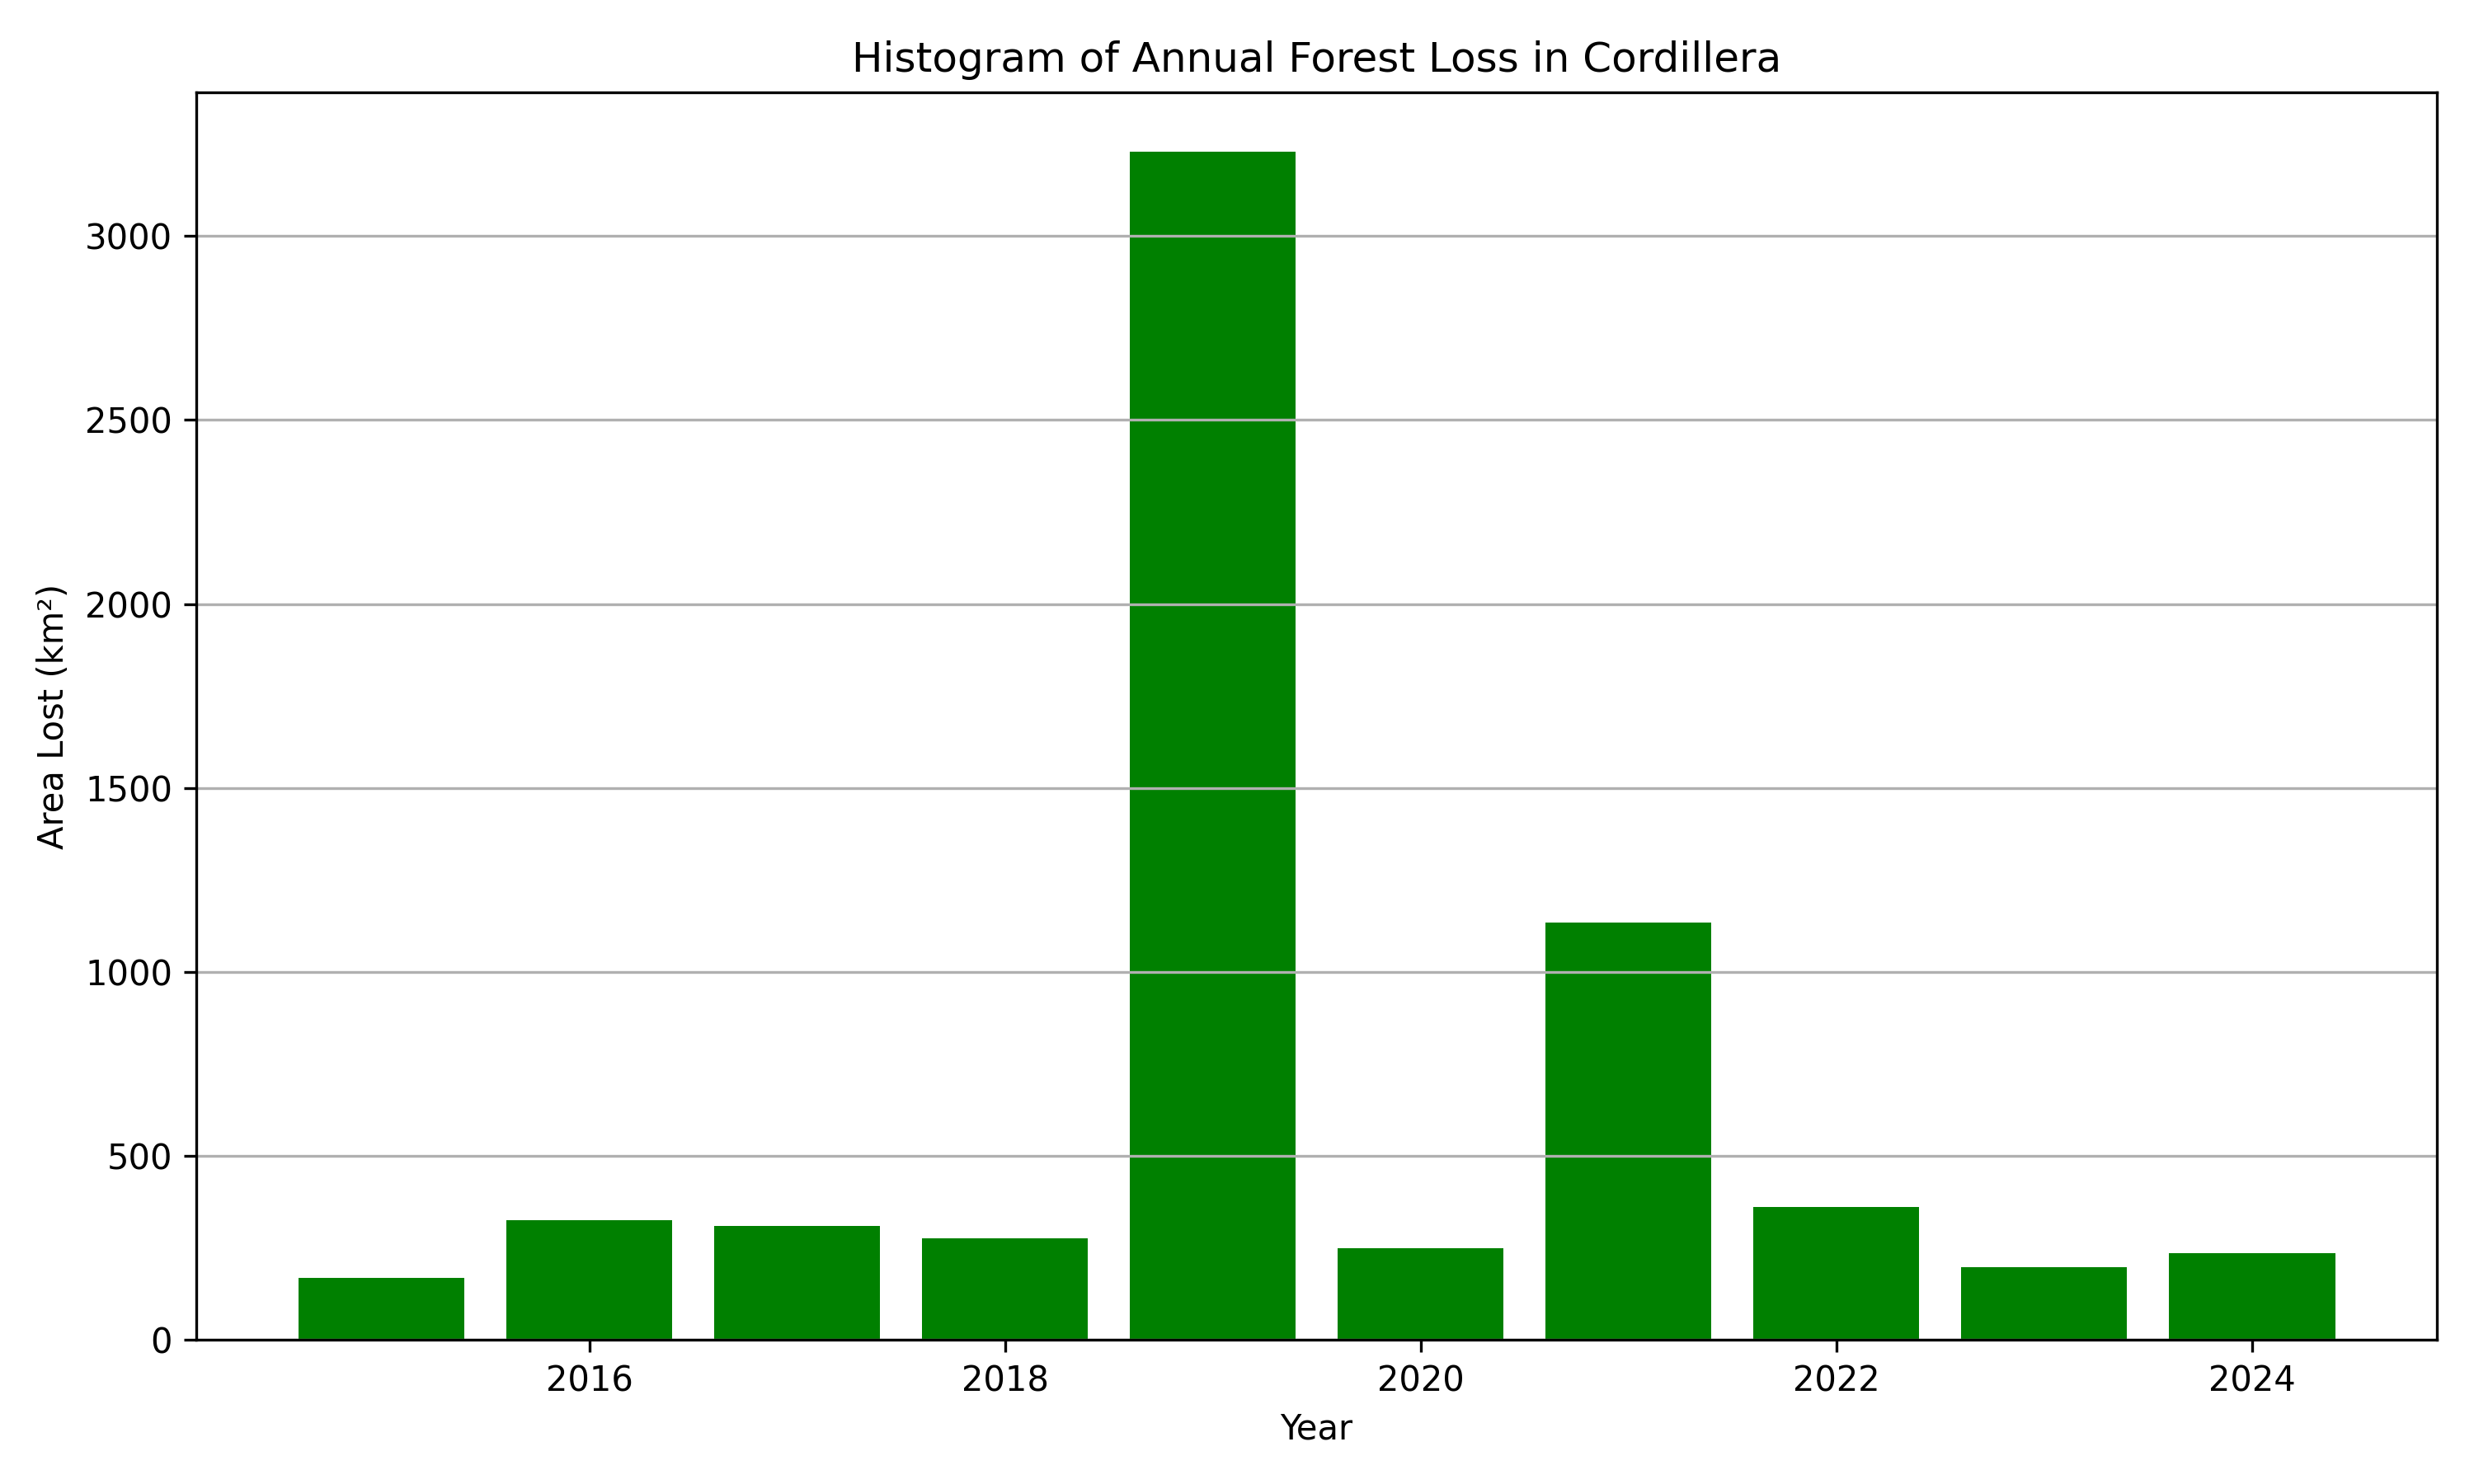
| 2 | 2015 | 3 | Cordillera | 167.9 | 0.20 |
| 3 | 2015 | 4 | Ñuflo_De_Chávez | 136.7 | NaN |
| 4 | 2015 | 5 | Guarayos | 121.3 | 0.36 |
| 5 | 2016 | 1 | Chiquitos | 1156.4 | 2.90 |
| 6 | 2016 | 2 | Velasco | 547.1 | 0.80 |
| 7 | 2016 | 3 | Ñuflo_De_Chávez | 471.1 | NaN |
| 8 | 2016 | 4 | Guarayos | 445.2 | 1.33 |
| 9 | 2016 | 5 | Cordillera | 325.7 | 0.39 |
a. 2014 - 2024 Cumulative Deforestation in km2#
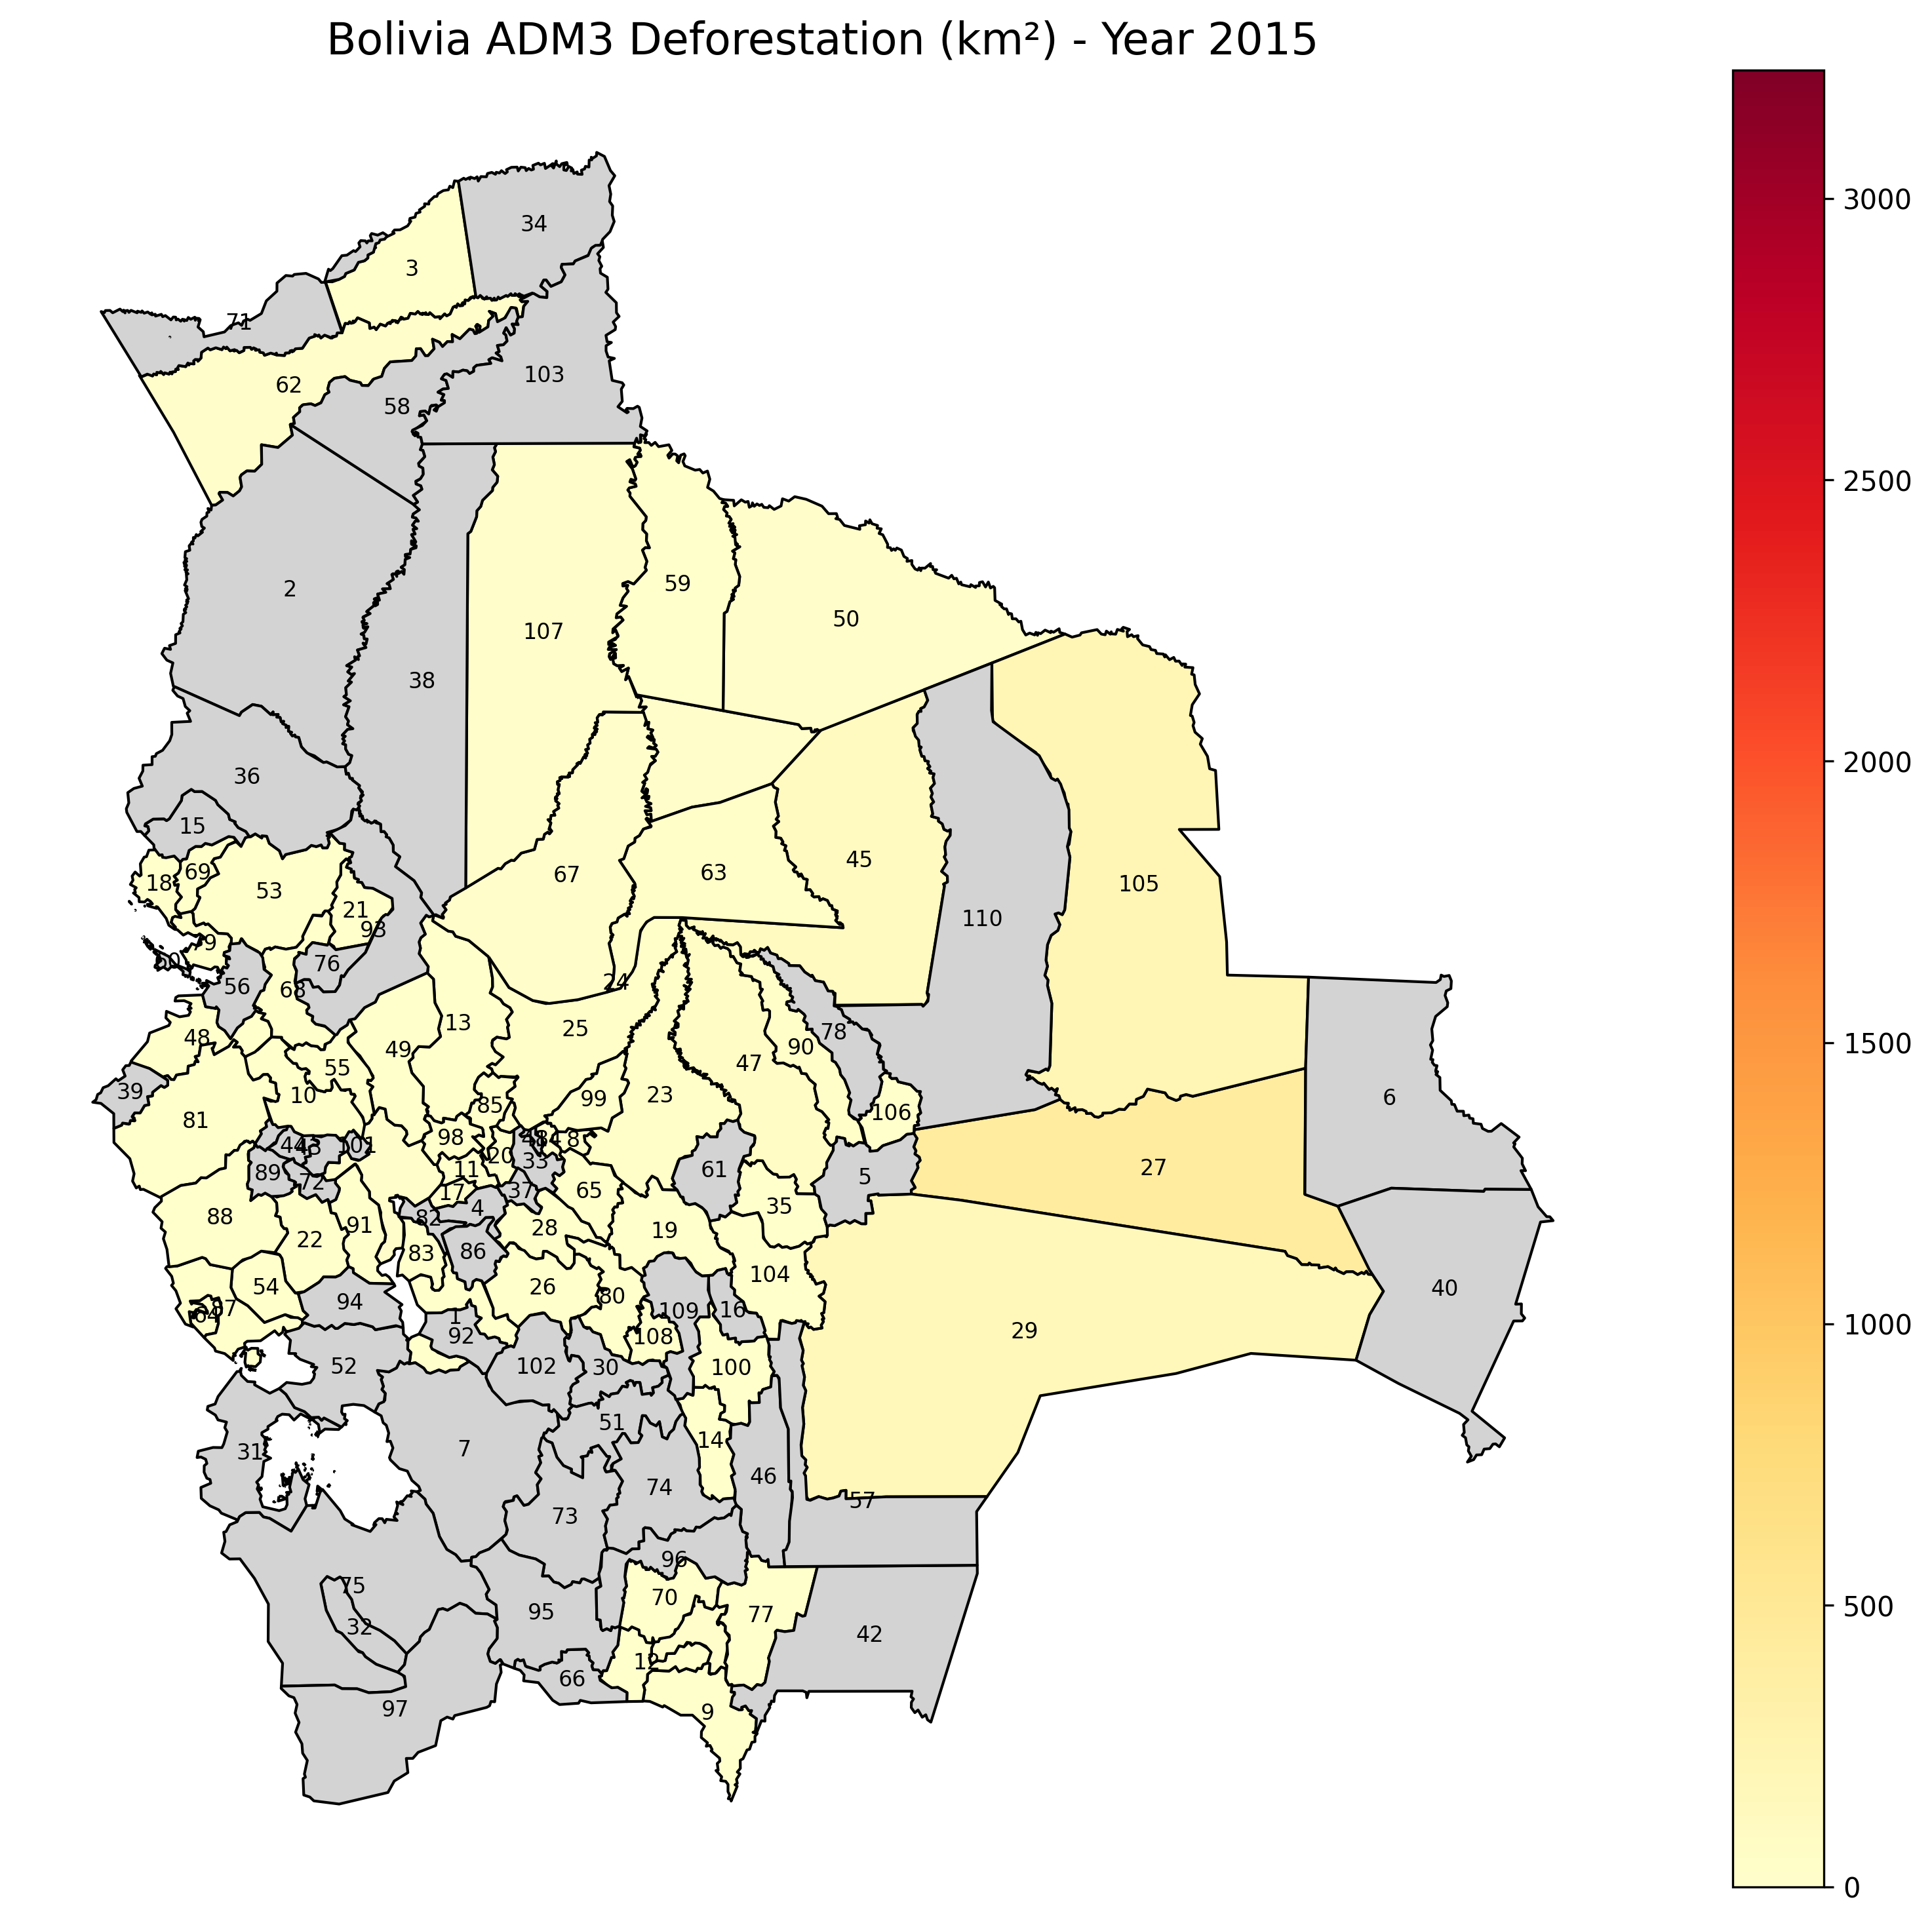
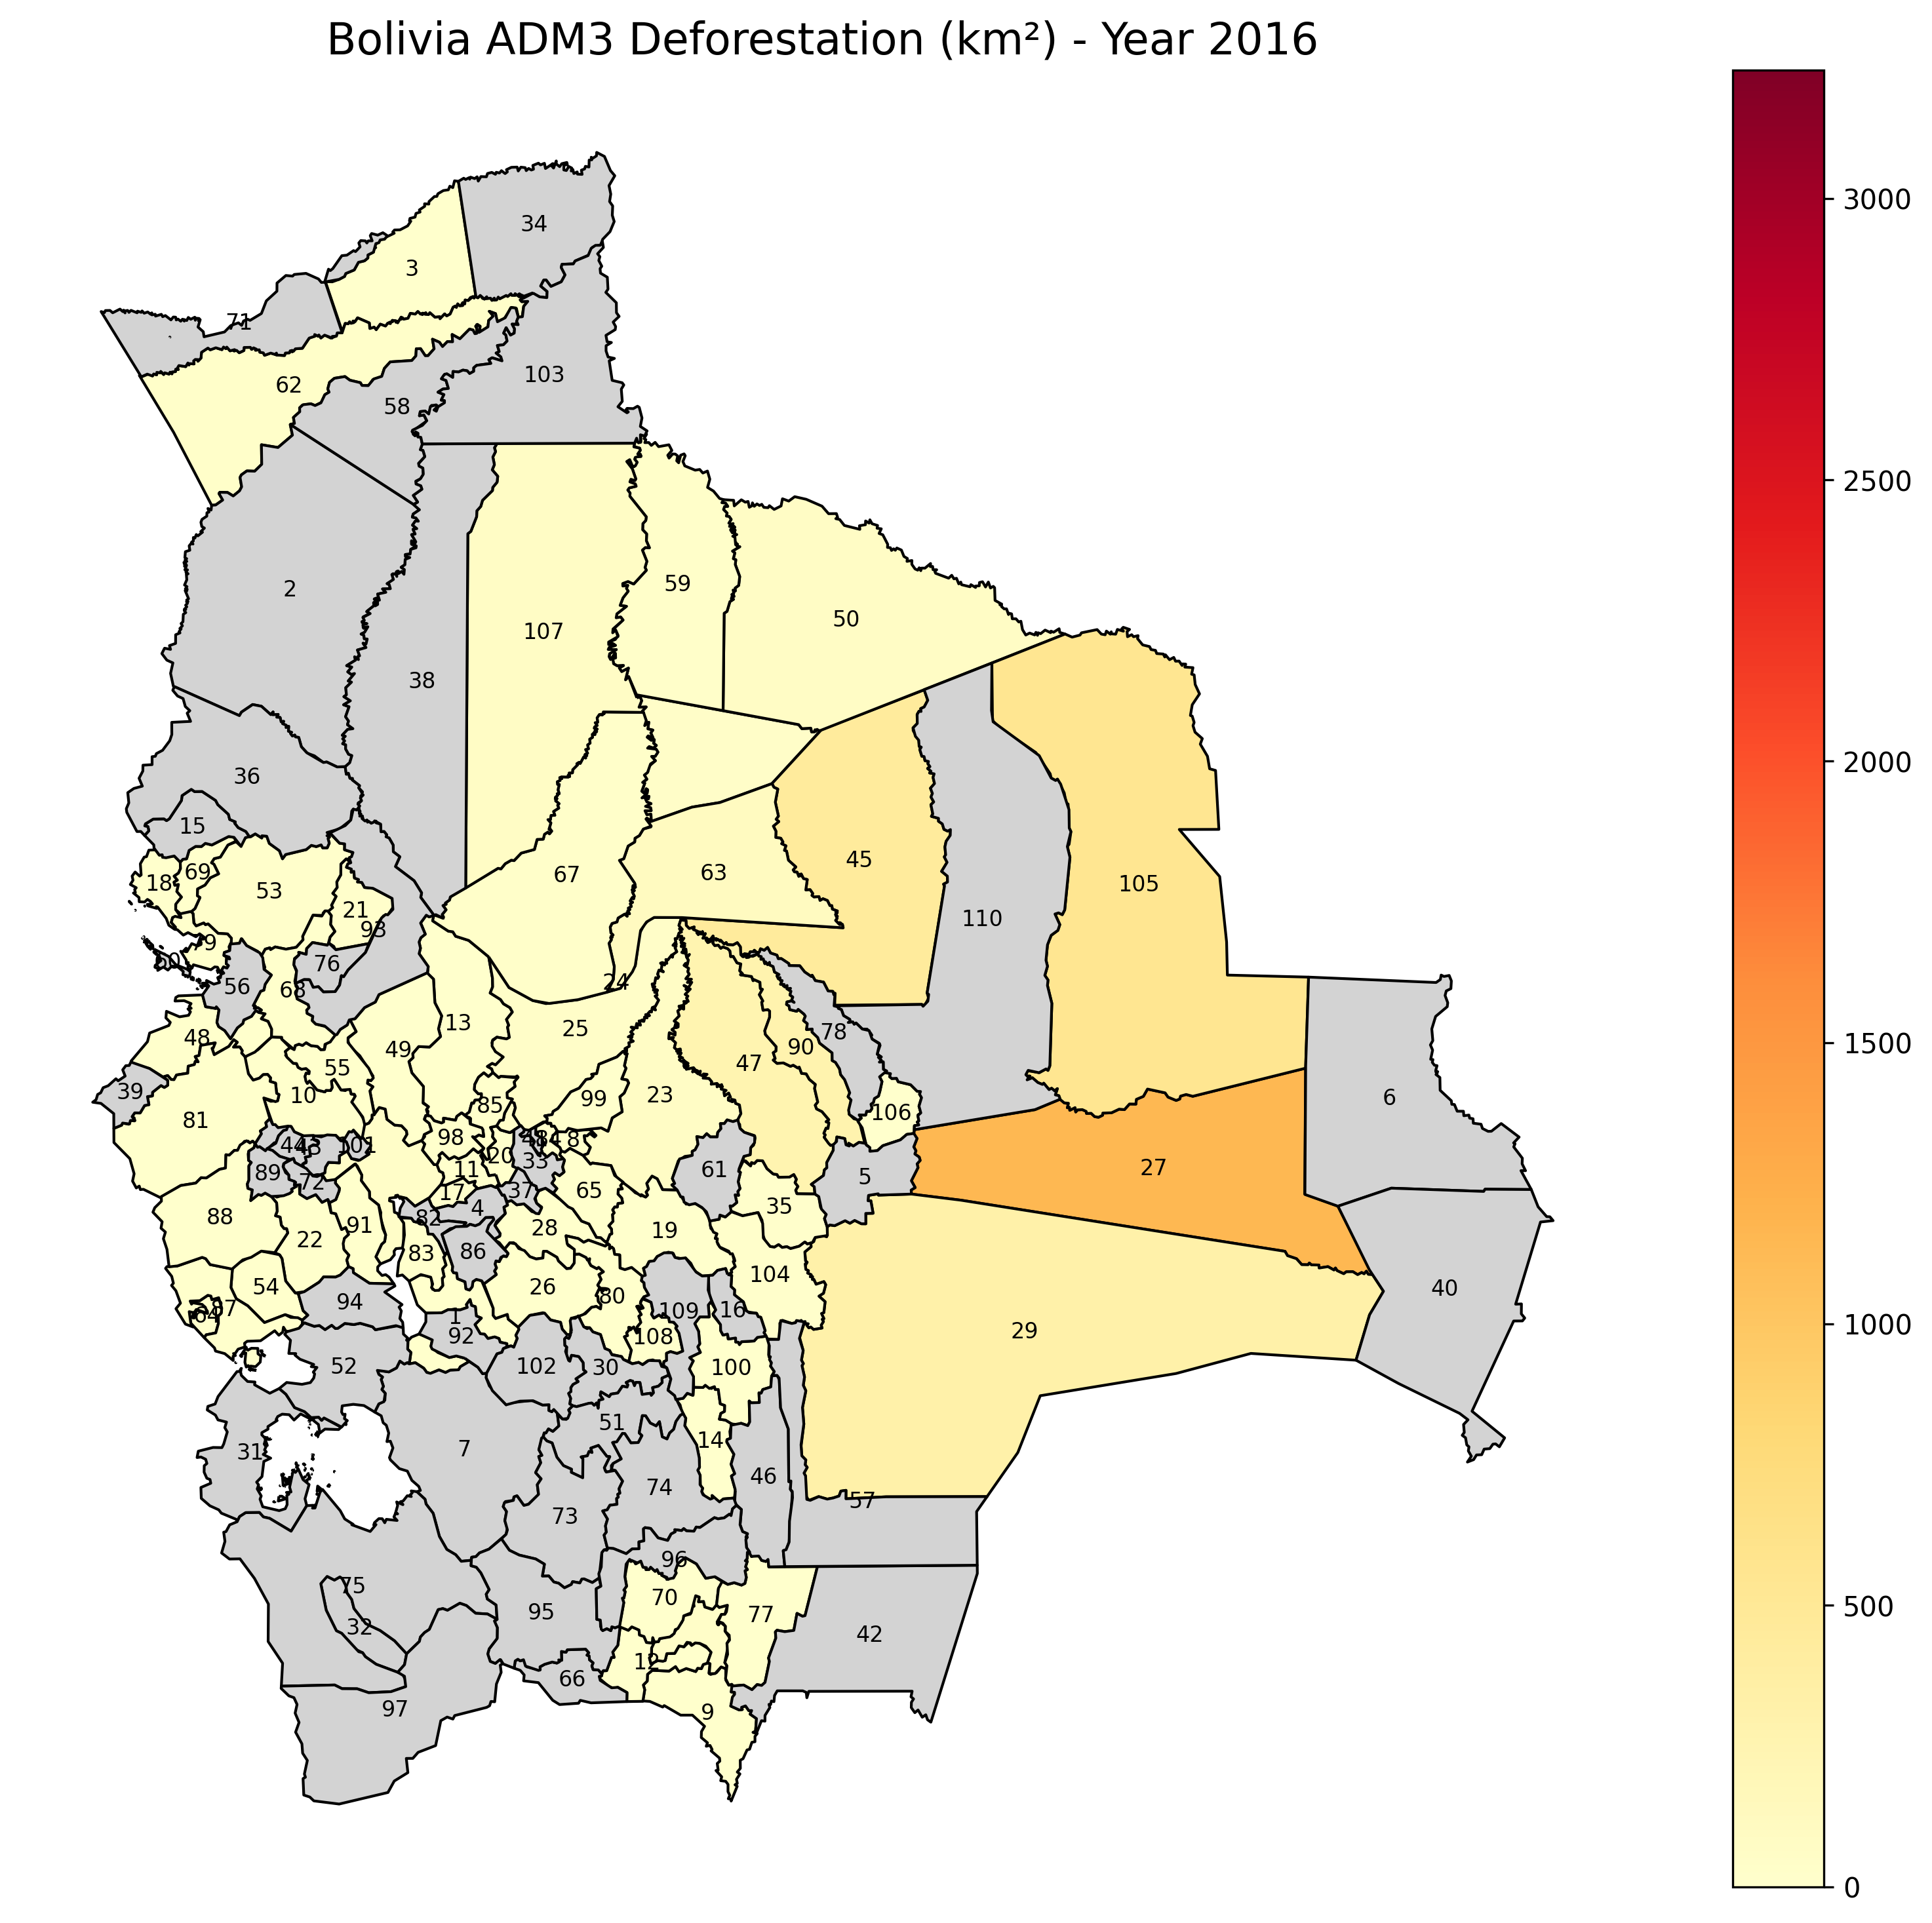
a. 2015 vs 2024 (Map Panels)#
2015 |
2016 |
|---|---|
|
|
|
|
|
|
|
|
|
|

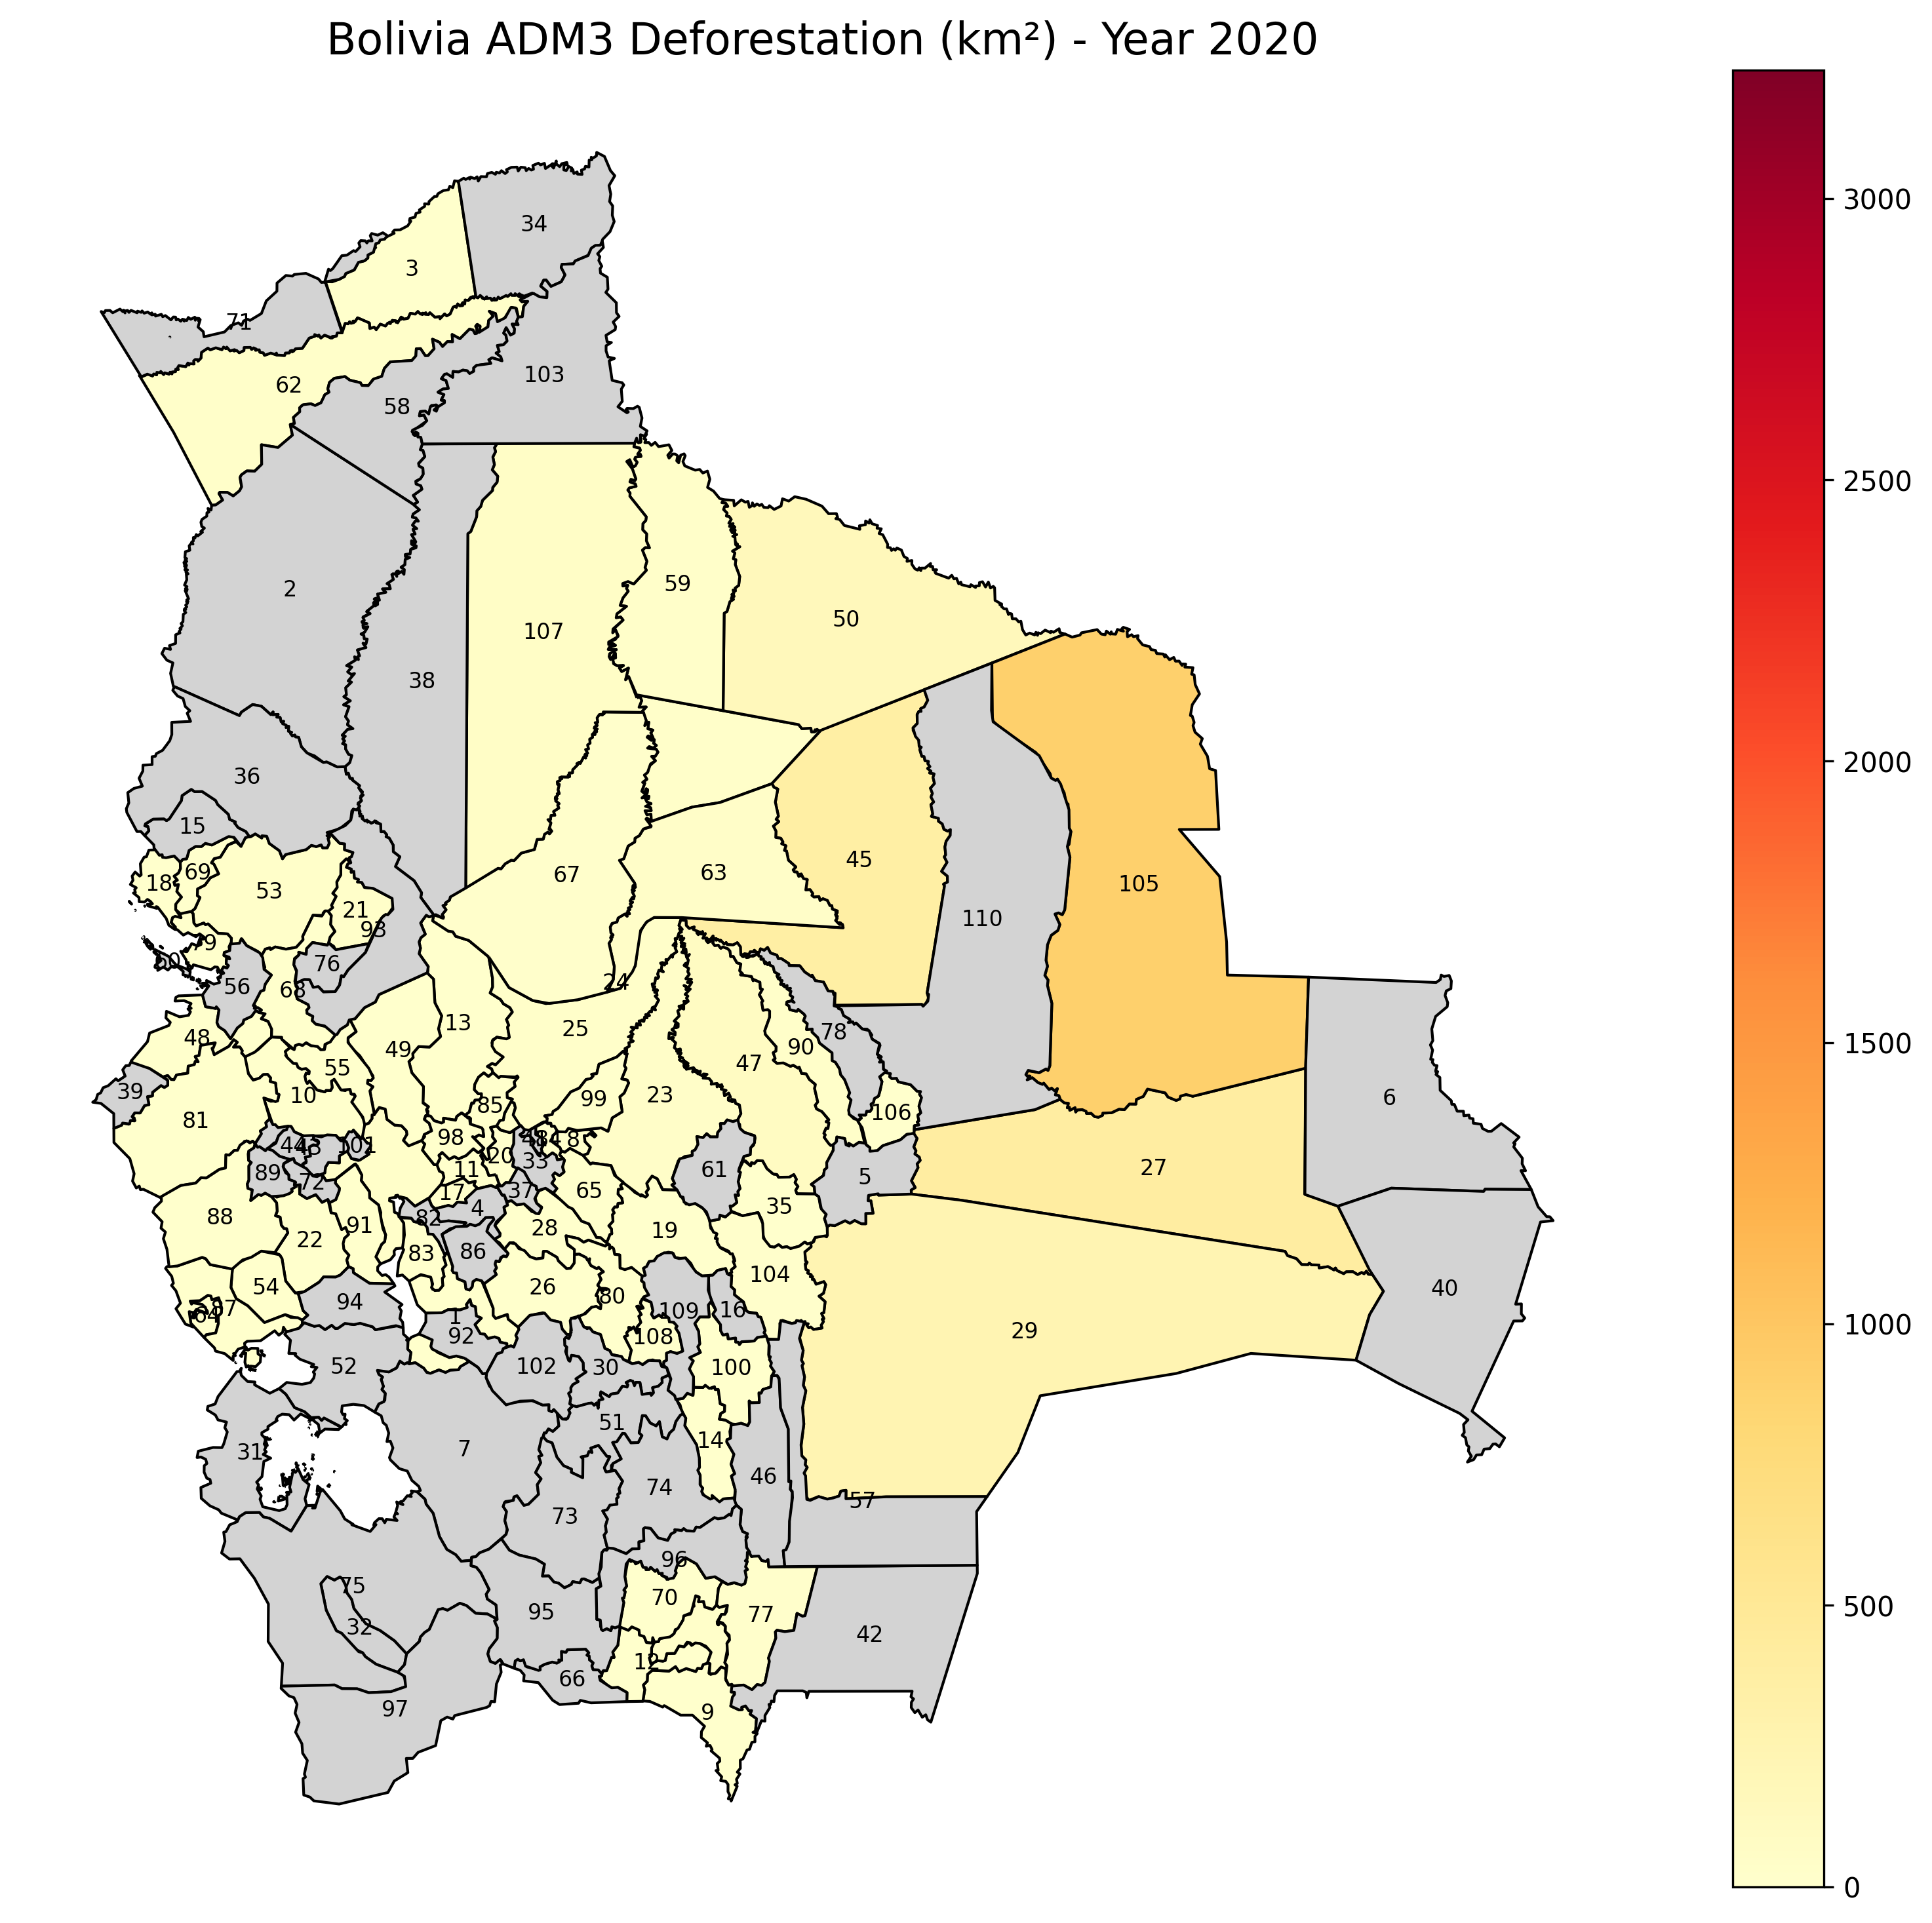
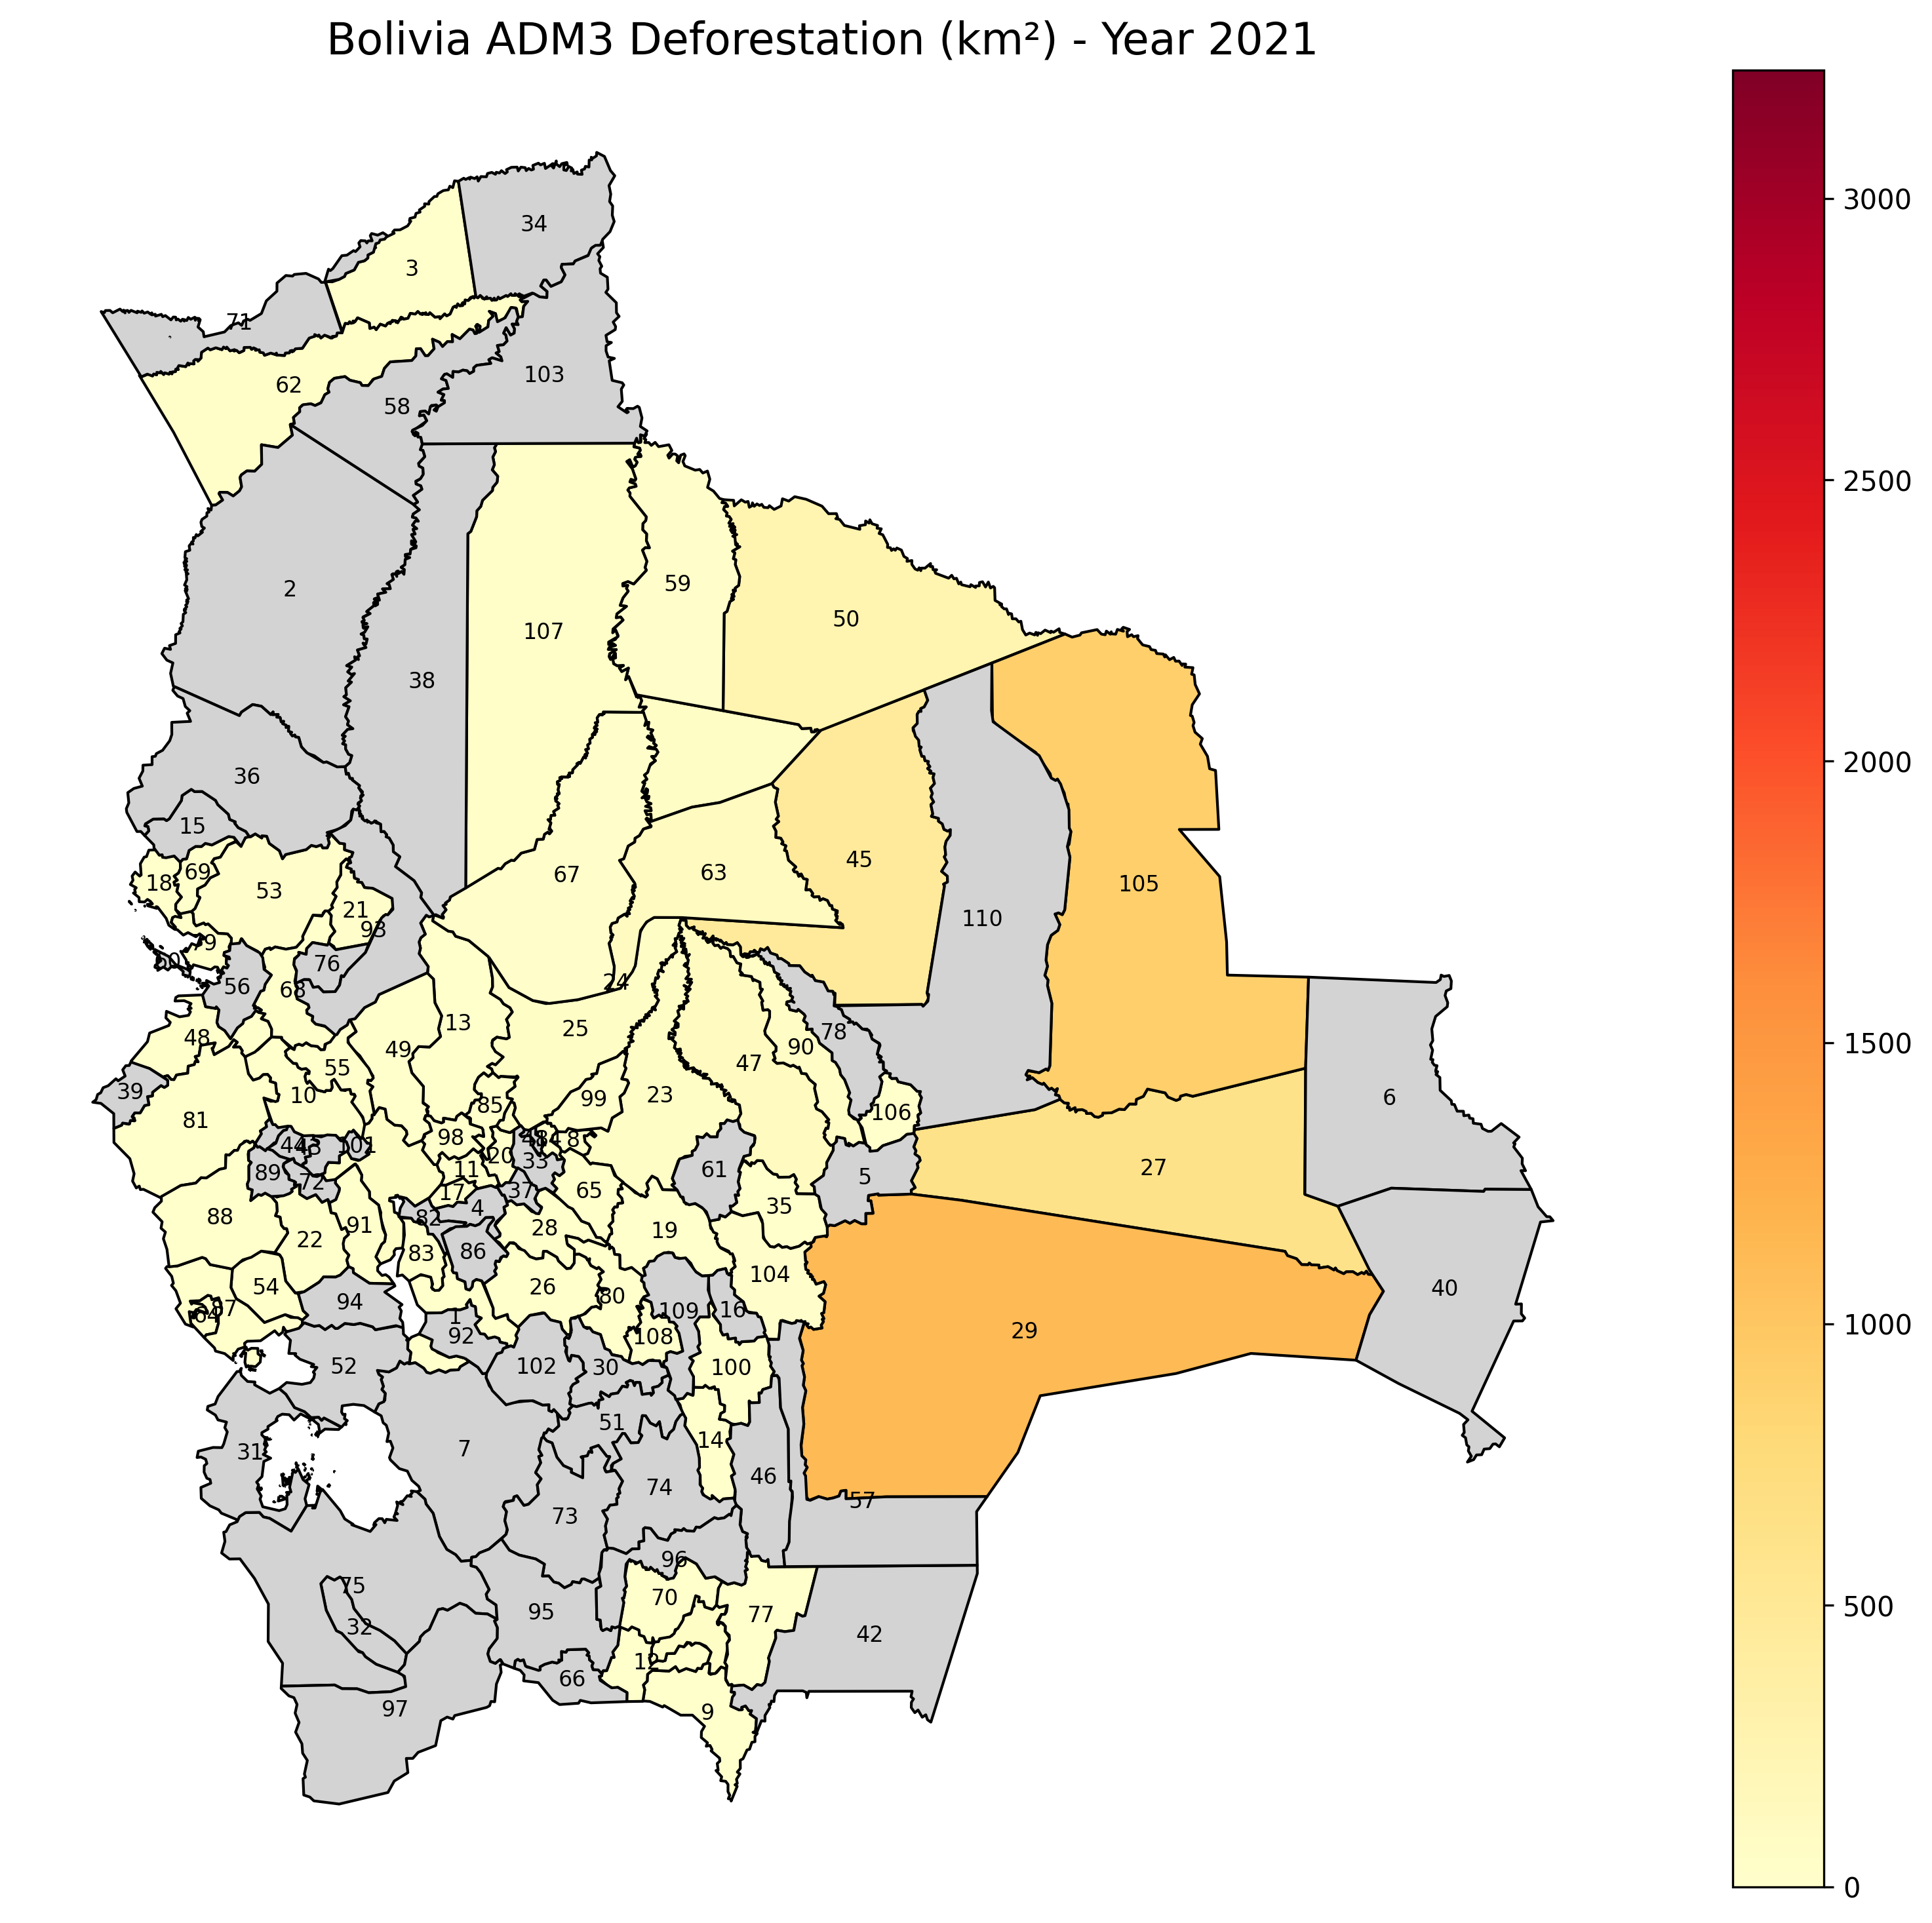
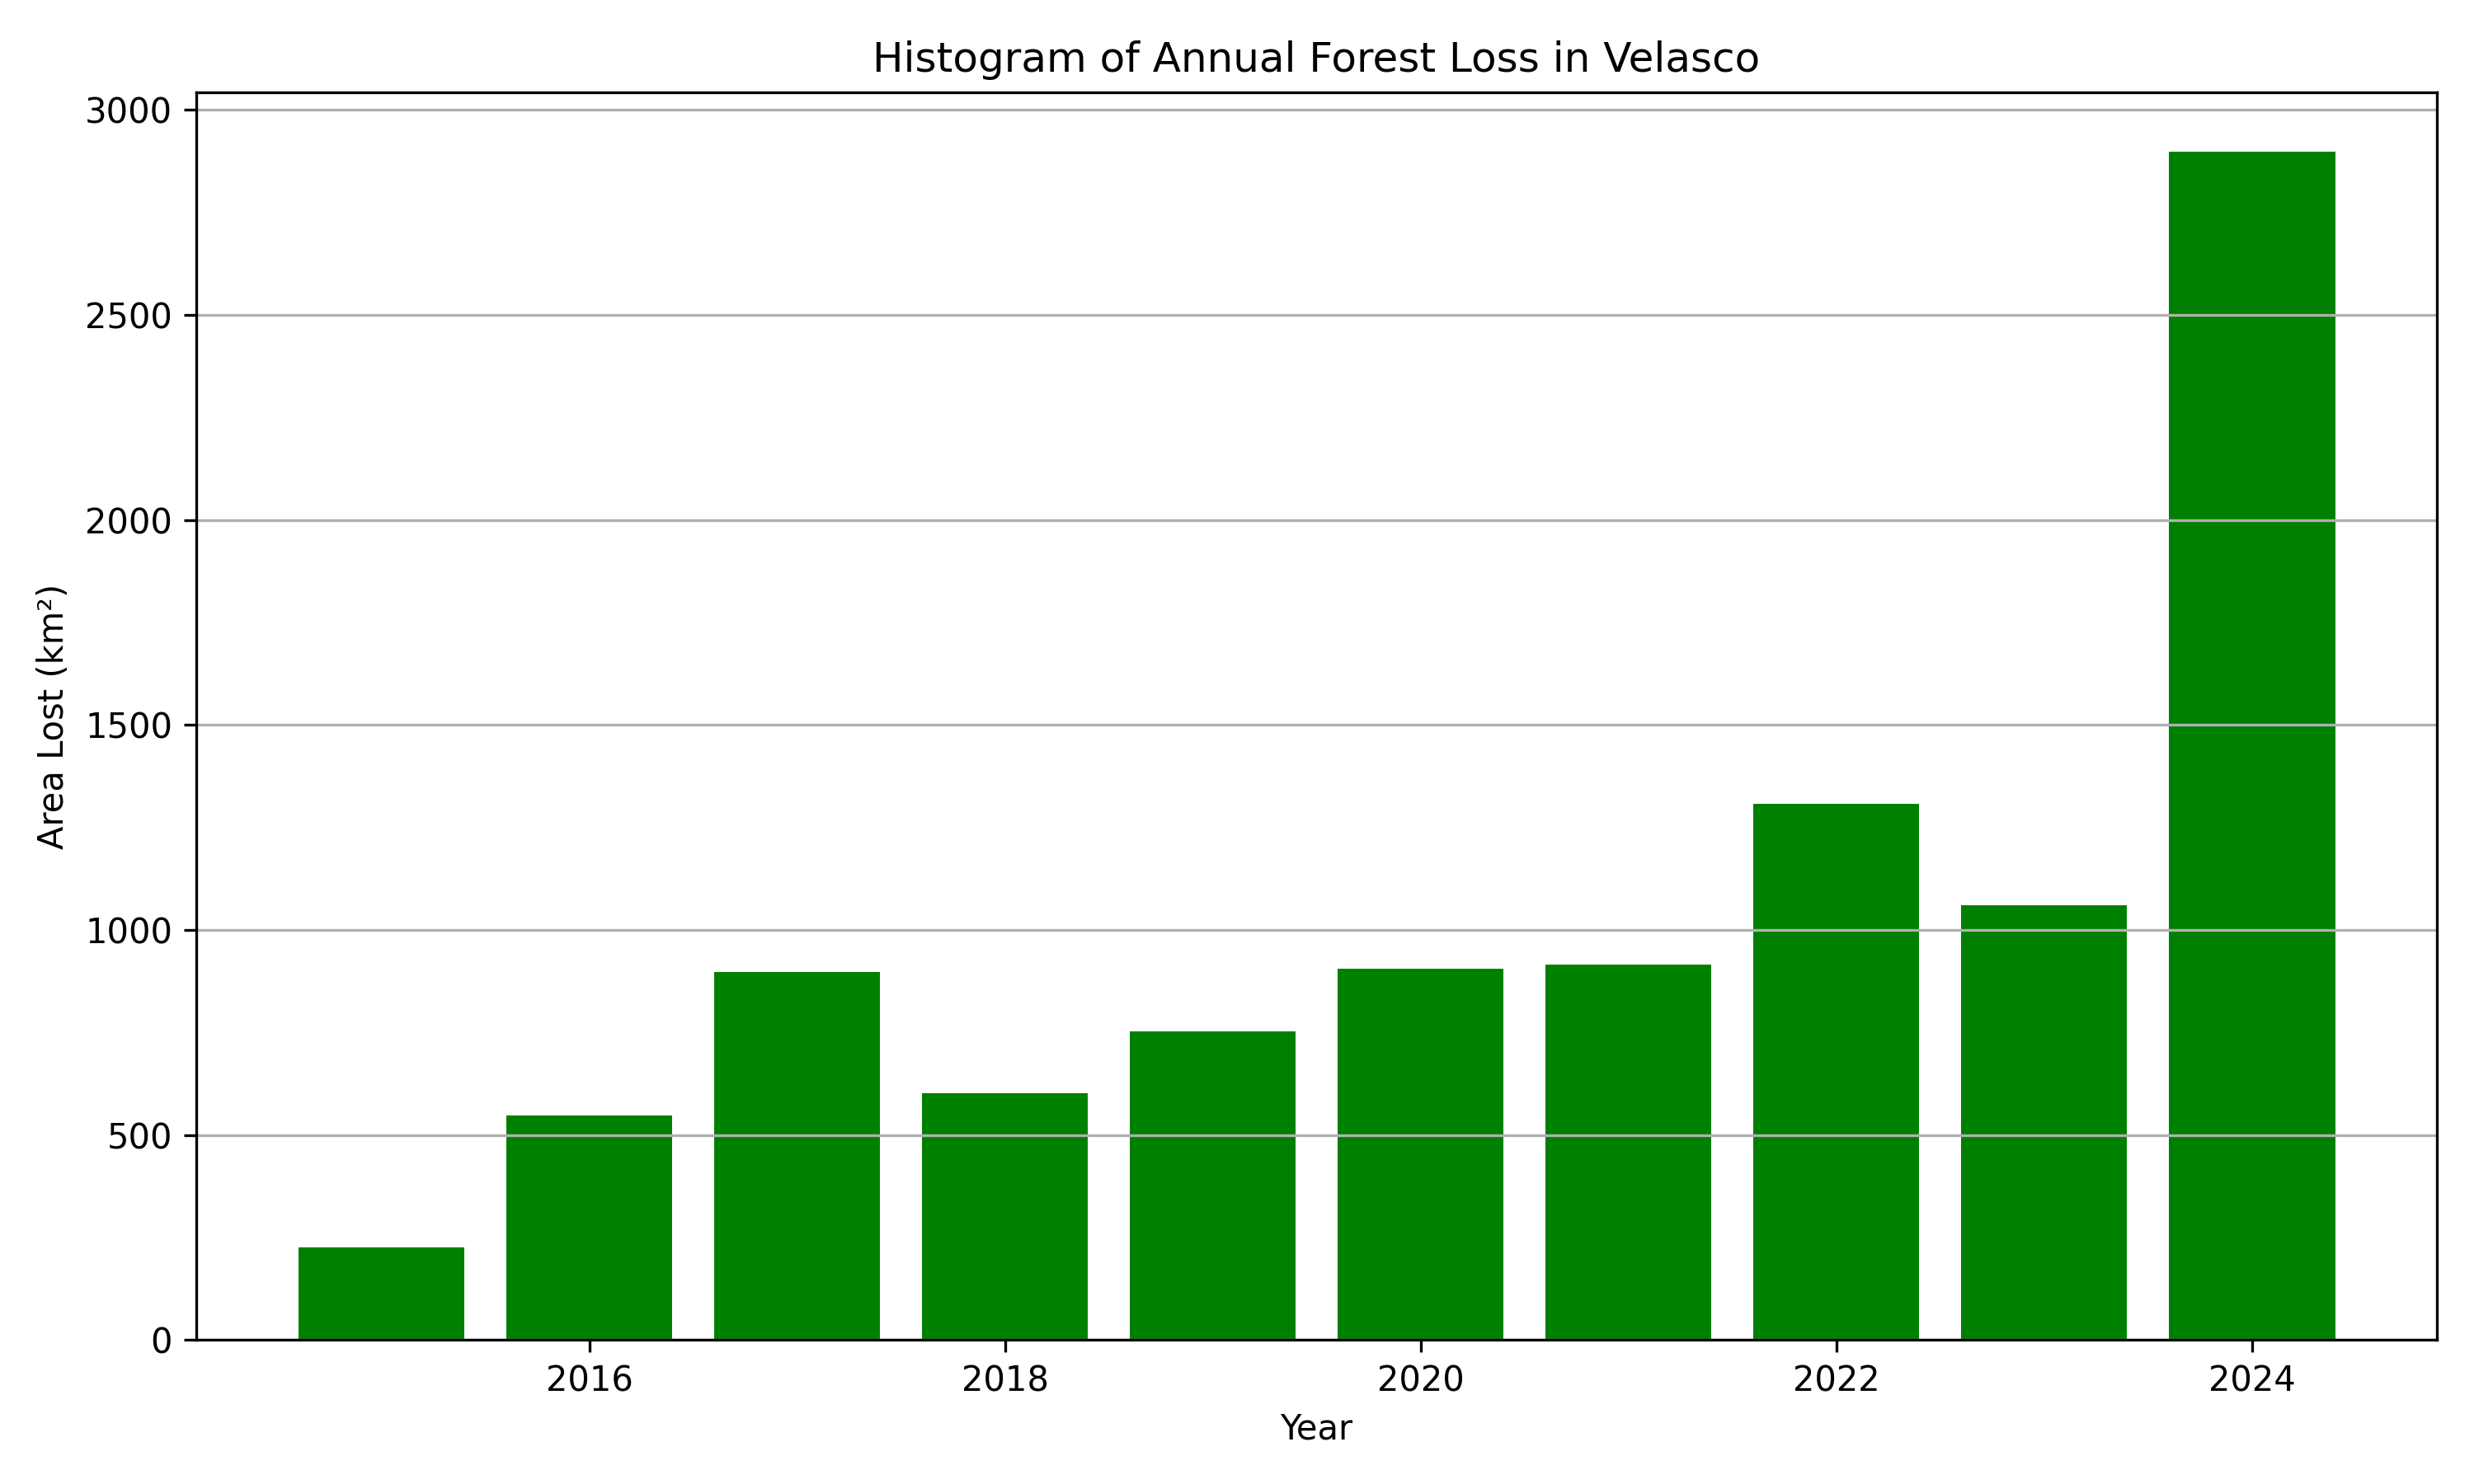
We generated time series plots for top cropland gainers (Velasco, Guarayos, Nuflo De Chavez, Chiquitos, Cordillera) These plots visualize the trends of deforestationand help identify hotspots of change.
Velasco

test