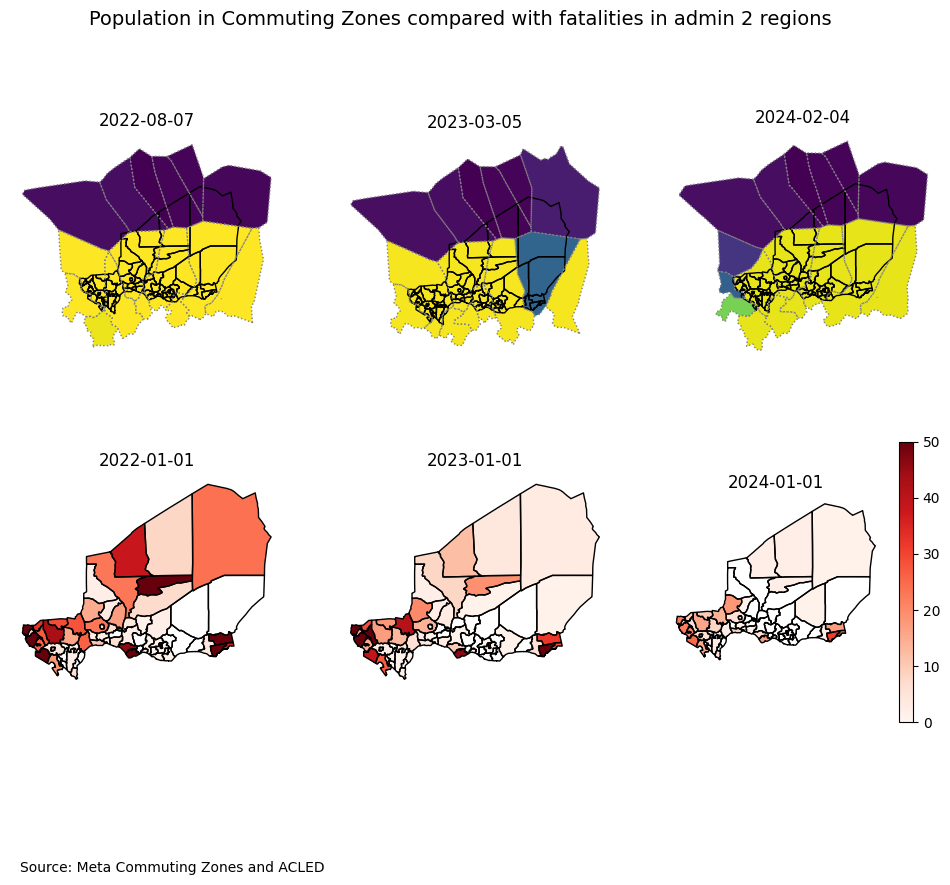
Conflict and Commuting Zones#
Show code cell source
Hide code cell source
fig, axs = plt.subplots(2, 3, figsize=(12, 8))
ax = axs.flatten()

for i, date in enumerate(["2022-08-07", "2023-03-05", "2024-02-04"]):
    if i > 4:
        legend_bool = True
    else:
        legend_bool = False

    niger_adm2.boundary.plot(ax=ax[i], color="black", linewidth=1)
    commuting_zones_niger[commuting_zones_niger["ds"] == date].boundary.plot(
        ax=ax[i], color="grey", linewidth=1, linestyle="dotted"
    )
    commuting_zones_niger[commuting_zones_niger["ds"] == date].plot(
        ax=ax[i],
        column="win_population",
        cmap="viridis",
        vmin=0,
        vmax=4500000,
        legend=legend_bool,
    )
    ax[i].set_title(date)

    ax[i].set_xticks([])
    ax[i].set_yticks([])
    ax[i].spines["top"].set_visible(False)
    ax[i].spines["bottom"].set_visible(False)
    ax[i].spines["right"].set_visible(False)
    ax[i].spines["left"].set_visible(False)

for idx, date in enumerate(["2022-01-01", "2023-01-01", "2024-01-01"]):
    i = idx + 3

    if i > 4:
        legend_bool = True
    else:
        legend_bool = False

    niger_adm2.boundary.plot(ax=ax[i], color="black", linewidth=1)
    acled_yearly_adm2[acled_yearly_adm2["event_date"] == date].plot(
        ax=ax[i], column="nrEvents", cmap="Reds", vmin=0, vmax=50, legend=legend_bool
    )
    ax[i].set_title(date)

    ax[i].set_xticks([])
    ax[i].set_yticks([])
    ax[i].spines["top"].set_visible(False)
    ax[i].spines["bottom"].set_visible(False)
    ax[i].spines["right"].set_visible(False)
    ax[i].spines["left"].set_visible(False)


ax[3].text(0, 0, "Source: Meta Commuting Zones and ACLED")

plt.suptitle(
    "Population in Commuting Zones compared with fatalities in admin 2 regions",
    x=0.5,
    y=1,
    fontsize=14,
);

# fig.savefig('../../docs/images/commuting_zones_population.svg', format='SVG', dpi=300);

