Demographics of Egypt#
To support spatial inequality analytics for Egypt, the Data Lab used algorithmically generated data released by Meta to prepare baseline demographic data and Relative Wealth Index data to help identify spatial differences in the population’s standard of living.
Data#
High Resolution Population Density#
In partnership with the Center for International Earth Science Information Network (CIESIN) at Columbia University, Meta uses state-of-the-art computer vision techniques to identify buildings from publicly accessible mapping services to create these population datasets. These maps are available at 30-meter resolution. These maps aren’t built using Facebook data and instead rely on applying machine vision AI to satellite imagery and census information. This data is publicly accessible on the Registry of Open Data on AWS and detailed documentation can be found here.
The Population Data is demographically disaggregated into the following categories
Men
Women
Children under 5
Elderly
Women of Reproductive Age (15-49)
Youth (15-24)
Senior
Relative Wealth Index#
The Meta Relative Wealth Index predicts the relative standard of living within countries using privacy protecting connectivity data, satellite imagery, and other novel data sources. To calculate this index, Meta uses measurements of household wealth collected through face-to-face surveys conducted by the United States Agency for International Development with 1,457,315 unique households living in 66,819 villages in 56 different LMICs around the world. Following this, they use spatial markers to link villages to non-traditional data sources , including satellite imagery, cellular network data, topographic maps, and privacy protecting connectivity data from Facebook. They process the non-traditional data using deep learning and other computational algorithms, which convert the raw data to a set of quantitative features for each village. They use these features to train a supervised machine learning model that predicts the relative wealth of each populated 2.4km2 grid cell on the planet, even in regions where no ground truth data exists [1].
The Relative Wealth Index is a number that compared the wealth within the country where negative RWI implies poorer areas and positive RWI implies richer areas.
Methodology and Implementation#
The data extracted from Meta was then aggregated to different admin levels using the shapefiles available on the Humanitarian Data Exchange.
Show code cell source
fig, ax = plt.subplots(3, 1, figsize=(8, 20))
ax[0].axis("off")
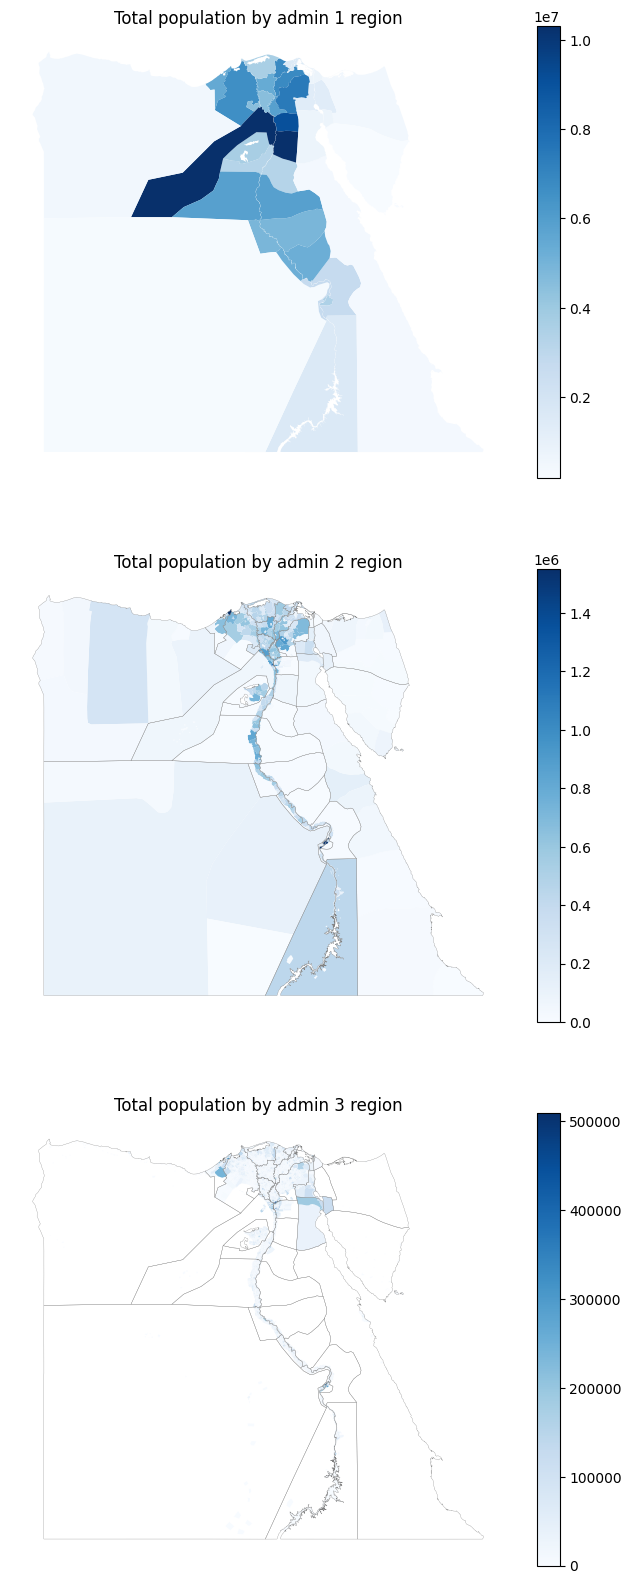
hrsl_egypt1.plot(column="egy_general_2020", cmap="Blues", legend=True, ax=ax[0])
ax[0].set_title("Total population by admin 1 region", fontsize=12, ha="center")
leg = ax[0].get_legend()
if leg:
leg.set_bbox_to_anchor((1, 0.5))
leg.get_frame().set_linewidth(0.0)
for text in leg.get_texts():
text.set_fontsize(6)
ax[1].axis("off")
hrsl_egypt2.plot(column="egy_general_2020", cmap="Blues", legend=True, ax=ax[1])
ax[1].set_title("Total population by admin 2 region", fontsize=12, ha="center")
egypt_adm1.boundary.plot(ax=ax[1], color="gray", linewidth=0.2)
# for i, cond in enumerate(hrsl_egypt2['max']):
# if cond:
# circle = patches.Circle((x[i], y[i]), radius=1, edgecolor='red', facecolor='none')
# plt.gca().add_patch(circle)
ax[2].axis("off")
hrsl_egypt3.plot(column="egy_general_2020", cmap="Blues", legend=True, ax=ax[2])
ax[2].set_title("Total population by admin 3 region", fontsize=12, ha="center")
egypt_adm1.boundary.plot(ax=ax[2], color="gray", linewidth=0.2)
subtitle_text = (
"Source: Population estimates from Meta's HRSL aggregated to admin regions from HdX"
)
# ax[0].text(-0.25, -0.05, subtitle_text, transform=ax.transAxes, fontsize=10, ha='left')
Top 5 Admin 1 Regions with Highest Population#
Show code cell source
hrsl_egypt1.sort_values(by="egy_general_2020", ascending=False)[
["ADM1_EN", "egy_general_2020"]
].head(5)
| ADM1_EN | egy_general_2020 | |
|---|---|---|
| 10 | Giza | 1.032489e+07 |
| 5 | Cairo | 9.062930e+06 |
| 23 | Sharkia | 7.461139e+06 |
| 6 | Dakahlia | 6.826862e+06 |
| 3 | Behera | 6.604455e+06 |
Top 5 Admin 2 Regions with Highest Population#
Show code cell source
hrsl_egypt2.sort_values(by="egy_general_2020", ascending=False)[
["ADM1_EN", "ADM2_EN", "ADM2_PCODE", "egy_general_2020"]
].head(5)
| ADM1_EN | ADM2_EN | ADM2_PCODE | egy_general_2020 | |
|---|---|---|---|---|
| 237 | Alexandria | Muntazah | EG0201 | 1.550675e+06 |
| 202 | Luxor | Luxor | EG2901 | 1.526273e+06 |
| 203 | Luxor | Luxor | EG2902 | 1.513515e+06 |
| 340 | Giza | Umraniyya | EG2118 | 1.225824e+06 |
| 174 | Giza | Imbaba | EG2101 | 9.996363e+05 |
Top 5 Admin 3 Regions with Highest Population#
Show code cell source
hrsl_egypt3.sort_values(by="egy_general_2020", ascending=False)[
["ADM1_EN", "ADM2_EN", "ADM2_PCODE", "ADM3_PCODE", "egy_general_2020"]
].head(5)
| ADM1_EN | ADM2_EN | ADM2_PCODE | ADM3_PCODE | egy_general_2020 | |
|---|---|---|---|---|---|
| 2489 | Kalyoubia | Shubra Al-Khayma 2 | EG1407 | EG140701 | 509457.455190 |
| 406 | Cairo | Basatin | EG0135 | EG013501 | 443118.097821 |
| 2524 | Kalyoubia | Shubra Al-Khayma 1 | EG1406 | EG140602 | 441933.968251 |
| 3733 | Kalyoubia | Khsos | EG1412 | EG141201 | 400054.452690 |
| 1675 | Luxor | Luxor | EG2901 | EG290102 | 383640.934778 |
Observation on Population Spatial Distribution#
We observe that the population is concentrated in just a few admin regions. Overall, Giza and Cairo have the highest populations, residing in 6.13% of the country’s land area.
Fig. 11 Relative Wealth Index at 2.4 square Km grids. Source: Data for Good at Meta.#
Observations on Relative Wealth Distribution#
The wealthiest areas often appear adjacent to very poor areas, such as in the regions Beni Suef, Cairo, and Faiyum.
Wealtheir populations tend to be concentrated near bodies of water.
References#
- 1
Guanghua Chi, Han Fang, Sourav Chatterjee, and Joshua E Blumenstock. Microestimates of wealth for all low- and middle-income countries. Proc Natl Acad Sci U S A, January 2022.