Gender Equality Survey at Home#
This survey was fielded August 1-17 2021 to Facebook and Instagram users in target countries. All data, including about respondents’ demographics, is provided by users on an opt-in basis through their responses to the voluntary questionnaire.Some values are null because respondents could skip any question, values are only provided where respondents chose to provide an answer. Some values, such as to the variables sog_w2_earning_curr_other, were scrubbed if the respondent provided an ilegible answer or one that may compromise privacy. Other values are not applicable (for instance, a value for variable country_weight_gender can only be provided if the respondent provided their gender). The survey was translated to over 60 languages and was delivered in the language preference according to respondents’ Facebook user settings.
Representativeness#
Responses are weighted to represent a geography’s online population, not its Facebook population. For instance, just because 24% of female respondents reported being aged 18-24 in the East Asia and Pacific region does not mean that 24% of female Facebook users are aged 18-24 in that region. Several steps have been implemented to mitigate the risk of re-identification. Any individual record in this dataset is representative of at least 50 other people in the base Facebook population who could reasonably be expected to respond identically.
Limitations#
Each record has a country/subregion and region weight score, to enable third-party researchers to accurately interpret and use results. The weights ensure this data is representative of the online population of the country, as well as the online population of the country’s males or females—but the weights do not represent total (online and offline) population. Please be mindful of this limitation when conducting your analysis.
Insights#
For aggregated insights, please refer to https://www.equalityathome.org/
print(f'There were {gender21.shape[0]} respondants in the survey across Egypt in 2021 and {gender20.shape[0]} in 2020')
There were 1041 respondants in the survey across Egypt in 2021 and 6099 in 2020
Sample Insights for 2020#
Show code cell source
import matplotlib.pyplot as plt
fig, ax = plt.subplots(1,2, figsize=(12,2))
bar_width = 0.5
df = gender20[gender20['a4']==1.0]
#'b10', 'b1_hours_work', 'b3'
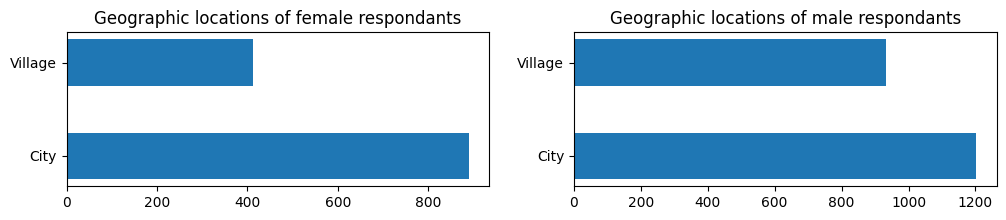
ax[0].barh(['City', 'Village'], list(df[['a6_r']].value_counts()), height=bar_width)
ax[0].set_title('Geographic locations of female respondants')
df = gender20[gender20['a4']==2.0]
#'b10', 'b1_hours_work', 'b3'
ax[1].barh(['City', 'Village'], list(df[['a6_r']].value_counts()), height=bar_width)
ax[1].set_title('Geographic locations of male respondants')
Text(0.5, 1.0, 'Geographic locations of male respondants')
Show code cell source
import matplotlib.pyplot as plt
fig, ax = plt.subplots(1,2, figsize=(12,2))
bar_width = 0.5
df = gender20[gender20['a6_r']==1.0]
#'b10', 'b1_hours_work', 'b3'
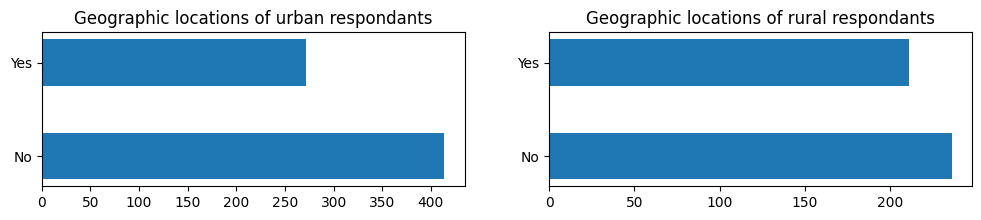
ax[0].barh(['No', 'Yes'], list(df[['b10']].value_counts()), height=bar_width)
ax[0].set_title('Geographic locations of urban respondants')
df = gender20[gender20['a6_r']==2.0]
#'b10', 'b1_hours_work', 'b3'
ax[1].barh(['No', 'Yes'], list(df[['b10']].value_counts()), height=bar_width)
ax[1].set_title('Geographic locations of rural respondants')
Text(0.5, 1.0, 'Geographic locations of rural respondants')
Show code cell source
import matplotlib.pyplot as plt
fig, ax = plt.subplots(1,2, figsize=(12,2))
bar_width = 0.5
df = gender20[gender20['a6_r']==1.0]
#'b10', 'b1_hours_work', 'b3'
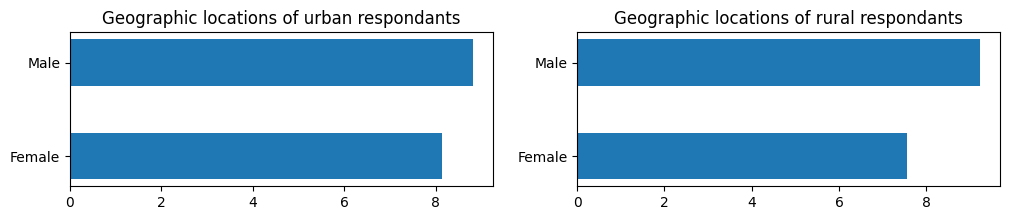
ax[0].barh(['Female', 'Male'], list(df[['a4','b1_hours_work']].groupby(['a4']).mean()['b1_hours_work']), height=bar_width)
ax[0].set_title('Geographic locations of urban respondants')
df = gender20[gender20['a6_r']==2.0]
#'b10', 'b1_hours_work', 'b3'
ax[1].barh(['Female', 'Male'], list(df[['a4','b1_hours_work']].groupby(['a4']).mean()['b1_hours_work']), height=bar_width)
ax[1].set_title('Geographic locations of rural respondants')
Text(0.5, 1.0, 'Geographic locations of rural respondants')