Understanding Societal Responses to Policies Undertaken During Emergencies: Lessons from COVID-19’s Second Wave in Maharashtra
by Harsh Vardhan PachisiaOutlogic SpaceKnow Health Disaster Risk Management Urban Development COVID-19
Maharashtra, one of the wealthiest states in India, was among the worst hit by COVID-19, registering nearly 140,000 COVID-19 deaths since the start of the pandemic. India cannot afford Maharashtra being ill-prepared for future disasters due to its economic and social importance. The state contributed around 14.2% of India’s GDP in 2021 in addition to housing close to 112 million residents (9.3% of India’s population) as per Census 2011, making it the second-most populous state.
This study aims to highlight the efficacy of using alternative datasets to inform policymaking by investigating the question: How did residents and industries react to changing policies (restricting movement and economic activity) imposed during the peak of the second wave of COVID-19 in Maharashtra?
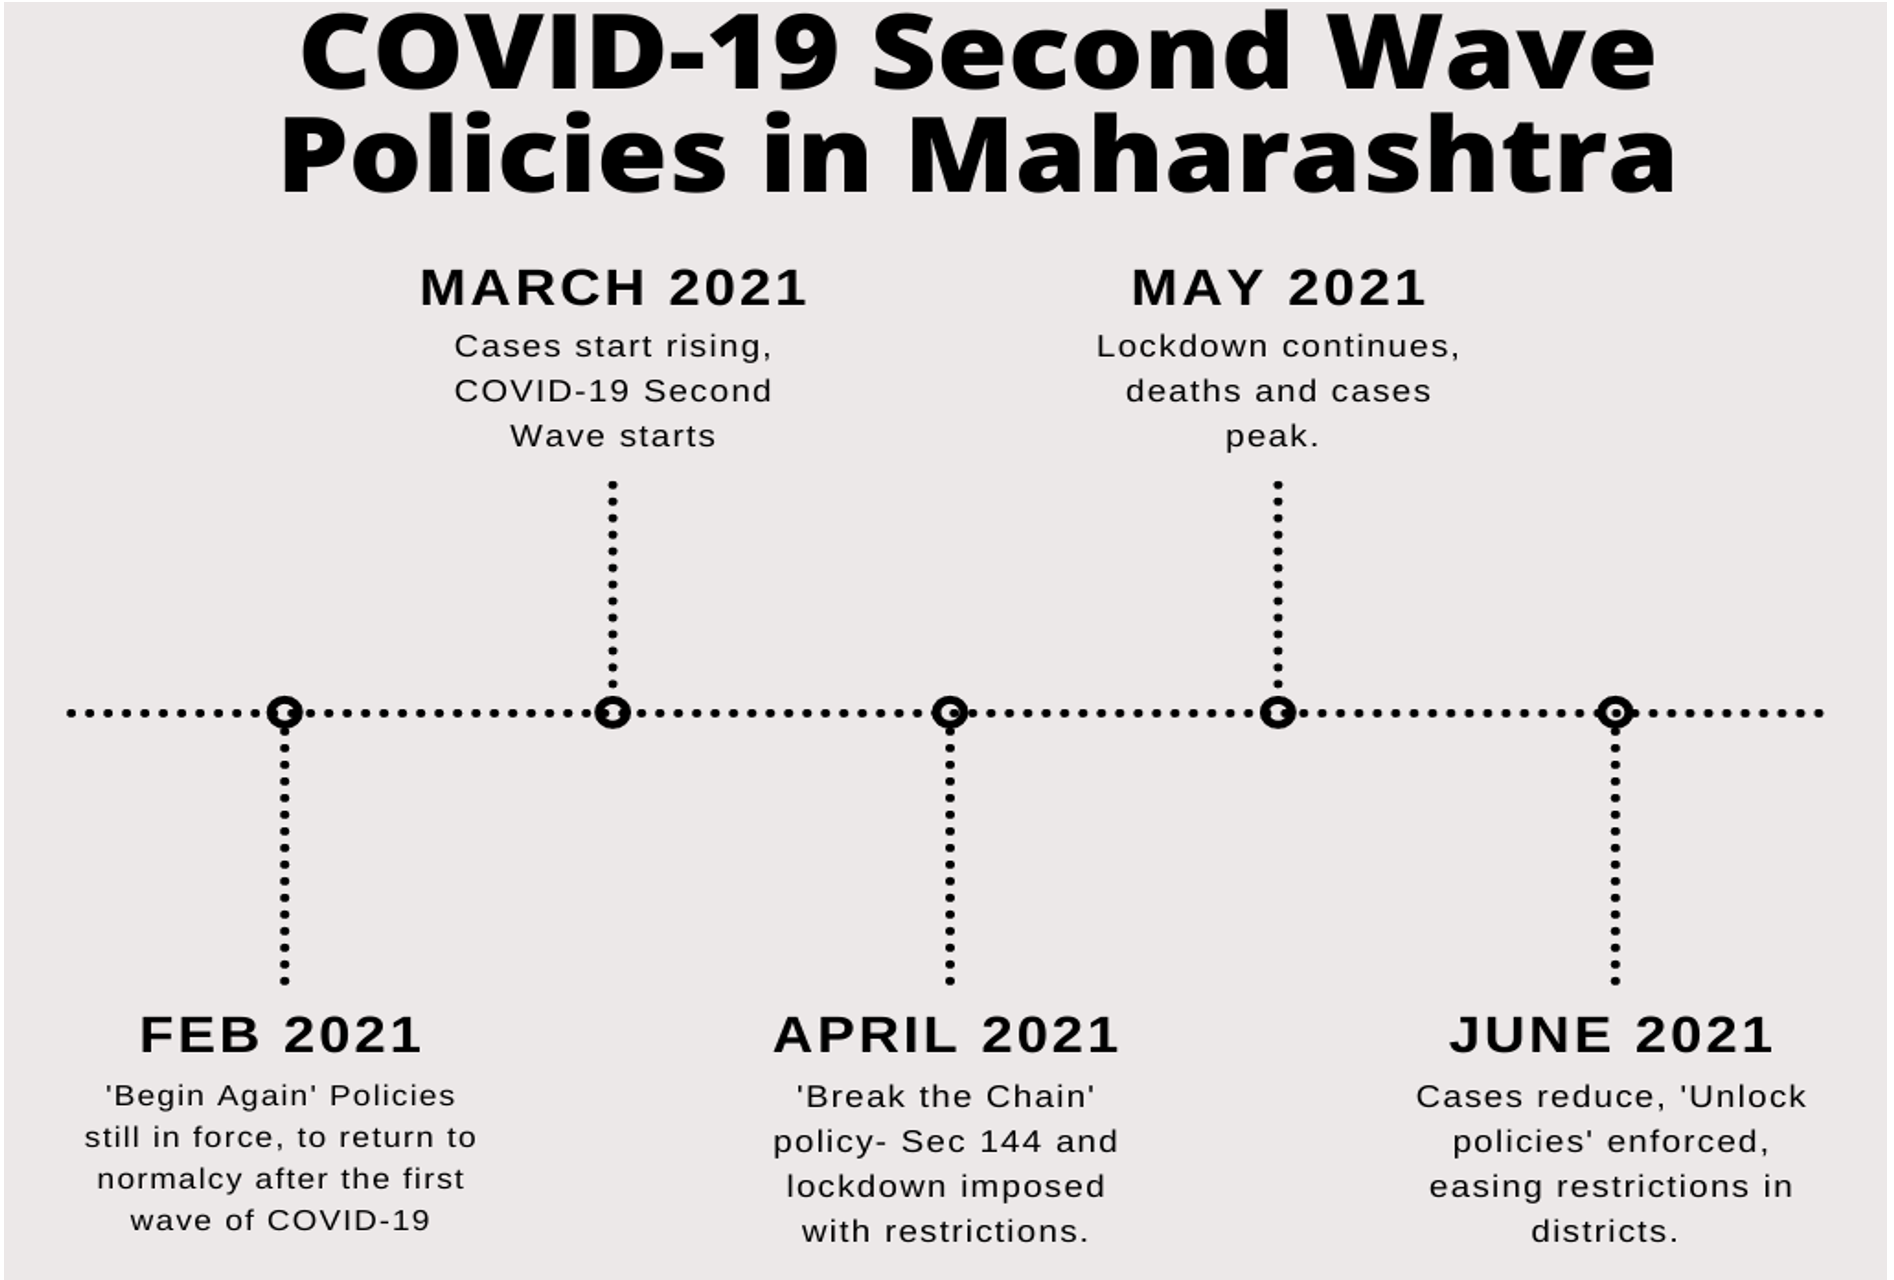
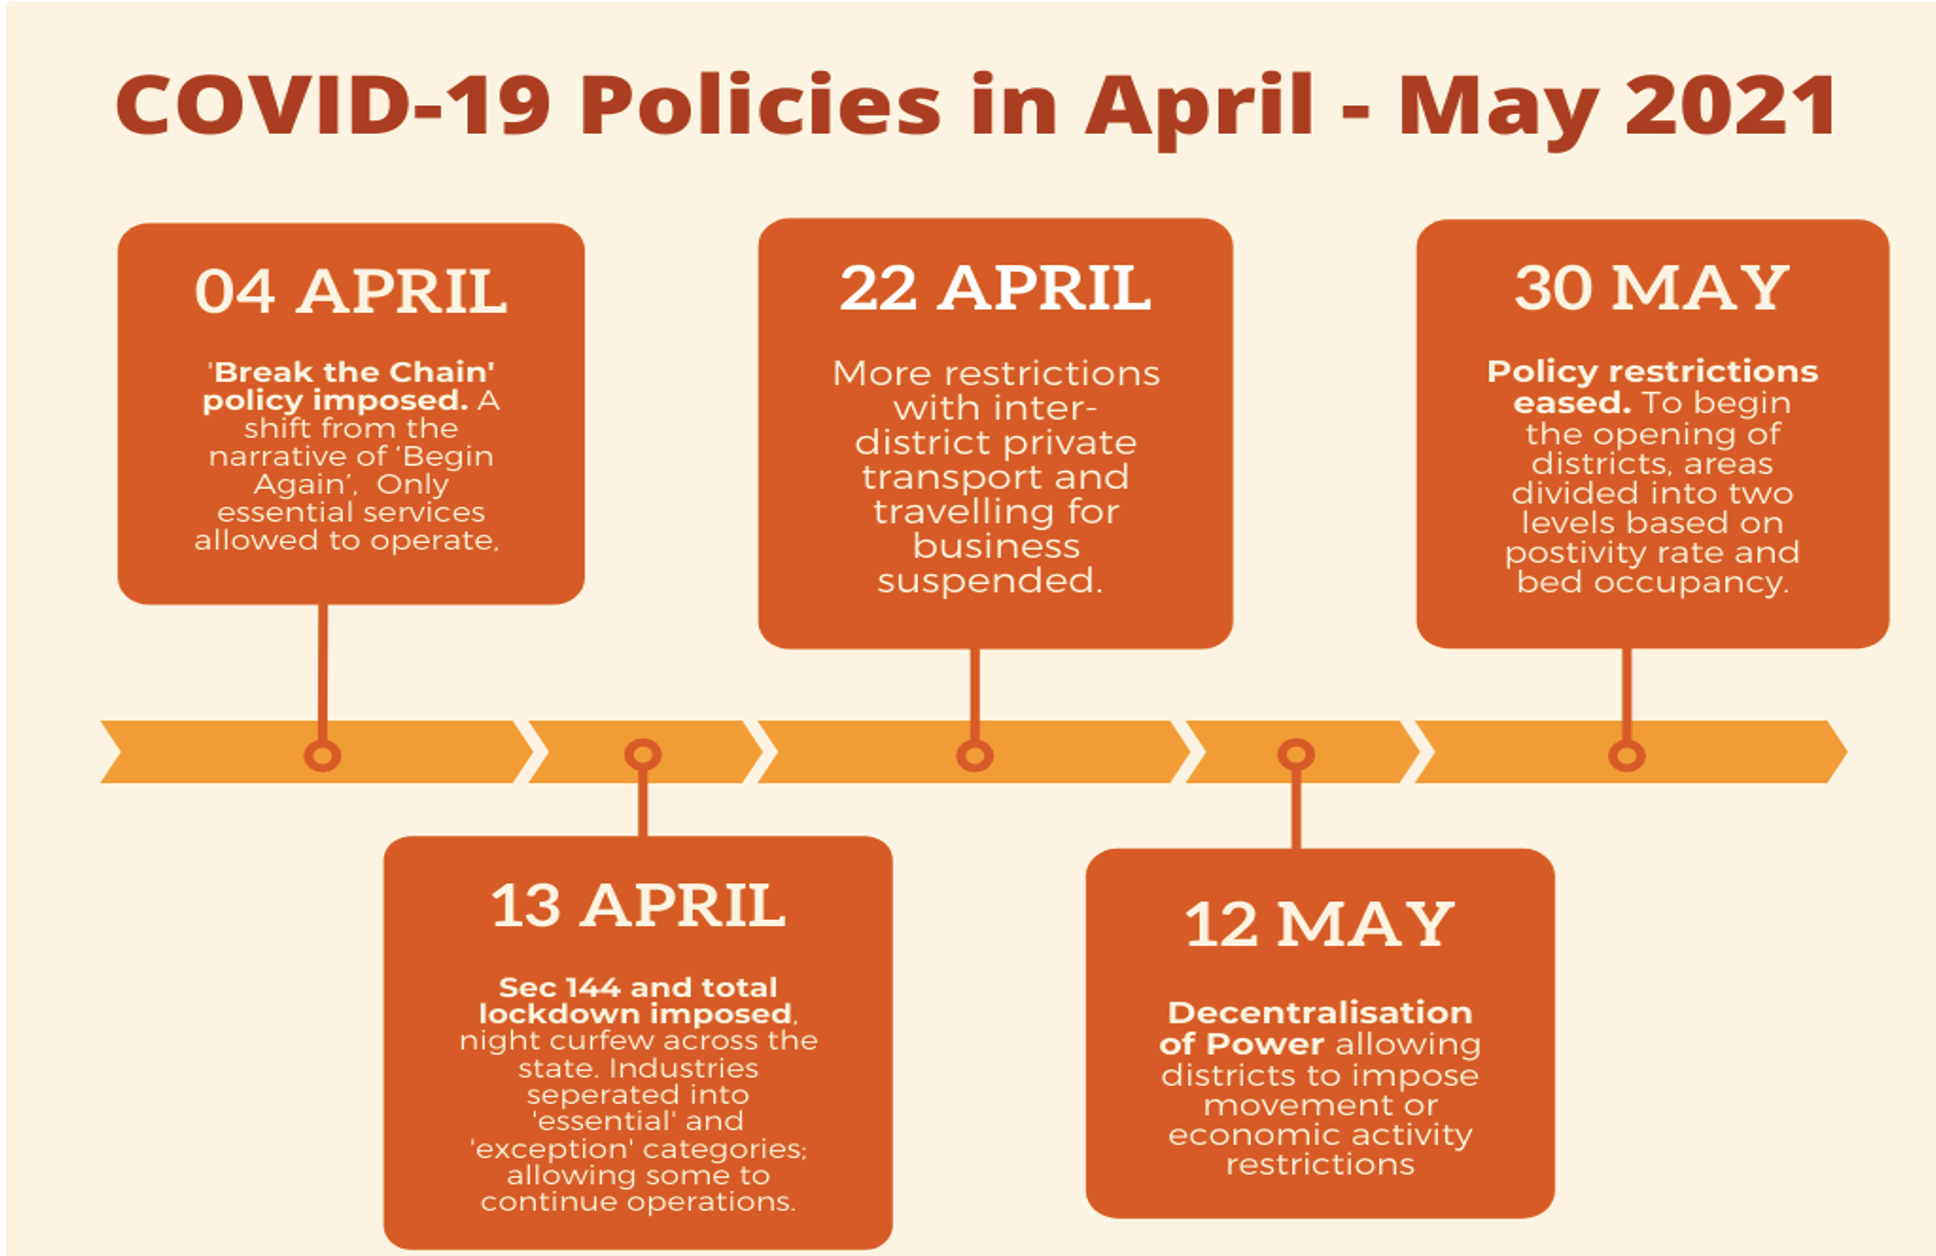
The COVID-19 second wave hit Maharashtra between February-July 2021 (Figure 1). The peak of the disease was during April-May 2021 resulting in various policy directives to curb the virus by the government of Maharashtra (Figure 2).
Challenge
There was a dearth of literature on the impact of state policies, both on inter-district movement and economic activity during the second wave of COVID-19, with most research focused on the first wave in 2020. This is especially true when trying to analyse industries and districts wherein working remotely was not an option, a crucial aspect in Maharashtra where close to 30% of the workforce is employed in industrial activity. With states making independent policy decisions on handling the second wave (Kar et.al., 2021), getting detailed policies provided by Maharashtra’s government was difficult due to poor online communication and archiving of such documents.
There are also major accessibility challenges with traditional data in India. Information on migration, economic activity, and labour markets is scarce with low levels of formalisation. Hence, selecting districts and industries to focus upon was a challenge since only policy documents such as the Economic Survey of Maharashtra could be relied upon, which does not release granular information on industries or migration. Another source, the Annual Survey of Industries, was limited to only formally registered firms, causing data gaps with large segments missing. Given this dearth of information, it was necessary to find the right alternative datasets to bridge the gap. Separating the noise from the usefulness of a dataset proved to be a major hurdle.
Solution
For analysing movement, Outlogic anonymised, privacy protected smartphone location data was used. Such data was available for the peak of the second wave– the week starting 22 March 2021 to the week starting 04 July 2021. SpaceKnow, a satellite imagery company that supplies indices on satellite activity and activity structure, was utilised for tracking economic activity. In particular, the Satellite Activity Index (SAI), a set of daily indices (aggregated to 12, 24 and 30 days), that measure the level of economic activity in specific industries as compared to a baseline was used. These indices were available daily for the entire period needed, in line with Outlogic data.
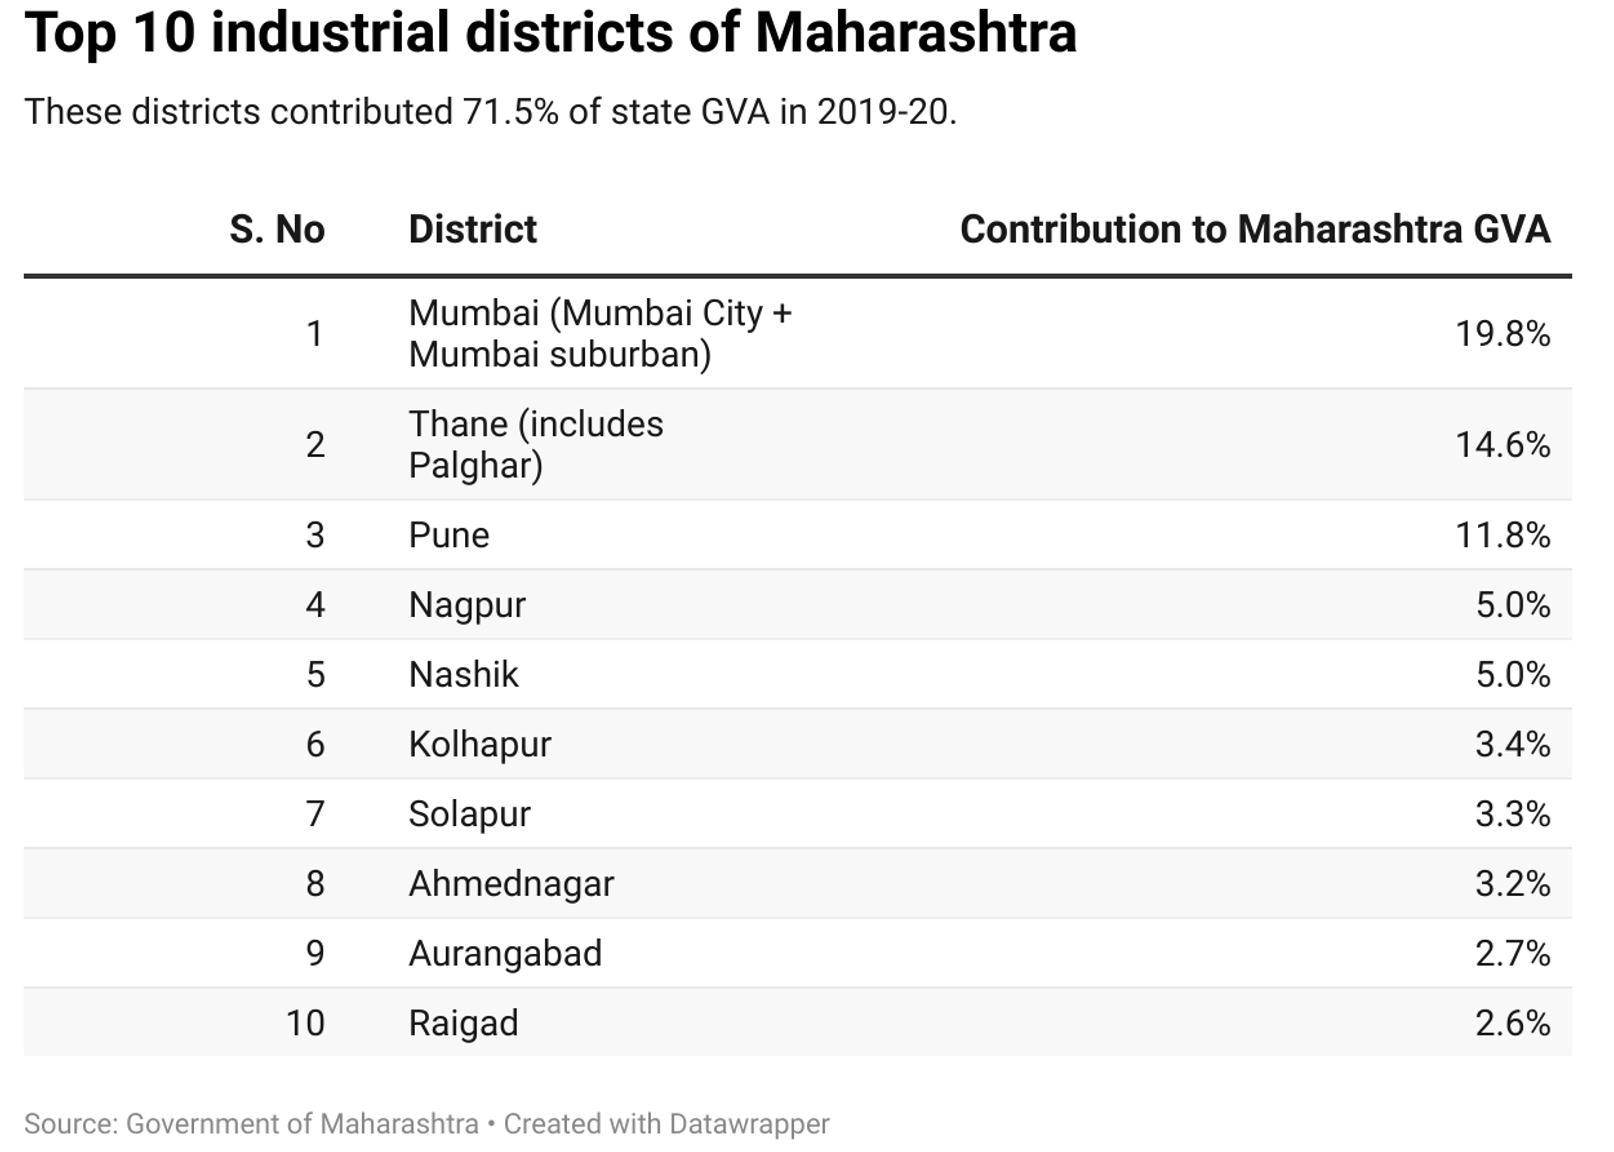
The top ten districts of Maharashtra were identified based on their contribution to the state’s industrial GVA in 2019-20. District level Gross Domestic Product (GDP) data was sourced from the Directorate of Economics and Statistics, Government of Maharashtra. The ten districts outlined below contributed 71.5% of state GVA in 2019-20 (Table 1).
With the provided data, the following steps were taken to gauge the weekly reaction of residents and industries to policies imposed during the peak of the second wave (from the week starting 22 March 2021 to the week starting 04 July 2021):
- Movement: The number of pings in each chosen district were aggregated to get a weekly percentage change for inward and outward movement.
- Economic Activity: The 30-day aggregated indices for each industry was used to calculate the weekly percentage change in economic activity from the week.
- Policy Directives: The dates and content of different policy directives imposed were overlaid to investigate the effects they would have on inter-district mobility and economic activity.
Impact
It was found that mobility of people changed in anticipation of a policy, not when the policy itself was enforced (Figure 3). If residents felt that lockdowns/restrictions were about to be imposed, they tended to move out of the district. This can be seen in the week of 22-28 March 2021, where all districts saw an increase in outward movement as compared to the previous week (Figure 3). Following the first round of Break the Chain restrictions on April 4, which signalled the official recognition of the second wave by the government, people ended up returning to their districts, with an increase in movement into each district.
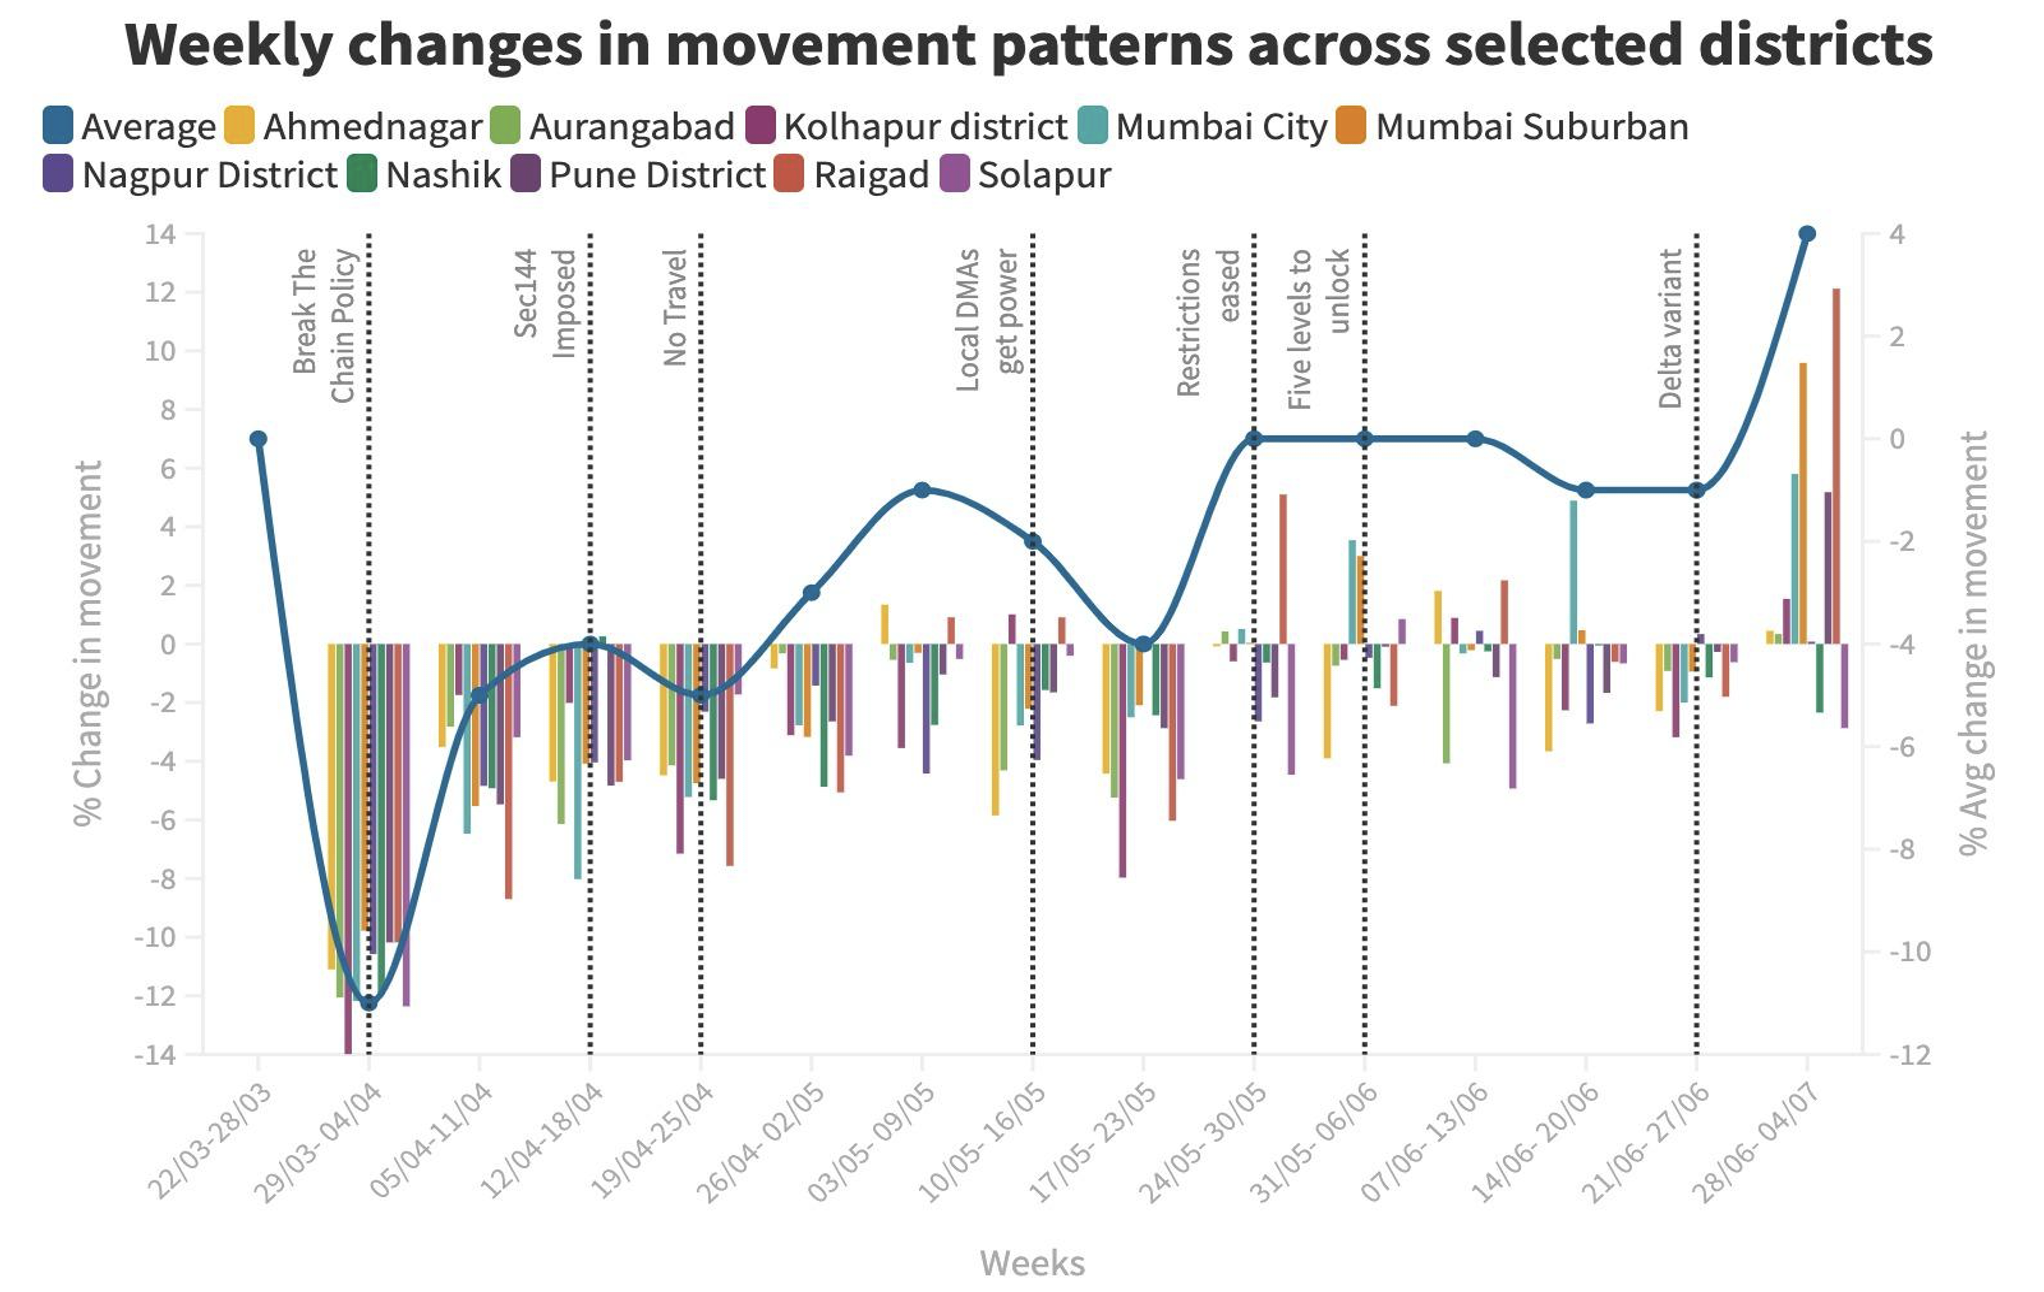
The outflow of residents from districts in anticipation of restrictive policies being imposed could be a result of residents expecting extremely restrictive lockdown measures to be implemented, as was the case in March 2020. During the first wave, the central government treated COVID-19 as a national emergency, but this changed during the second wave. With people often basing their individual decisions on past experiences, these pre-emptive outflows are justified with uncertainty over the future. Residents also seem to have decided to return to districts after the imposition of lighter-than-expected restrictions.
On the other hand, industrial, construction and manufacturing indices always took a week or two to react to a change in policy (Figure 4). The construction industry seems to have been worst affected when policy restrictions were enacted, with activity declining with the imposition of Section 144 being imposed in April 2021. After hitting a trough at the start of June 2021, it then rapidly improved with the state easing lockdown by the start of July.
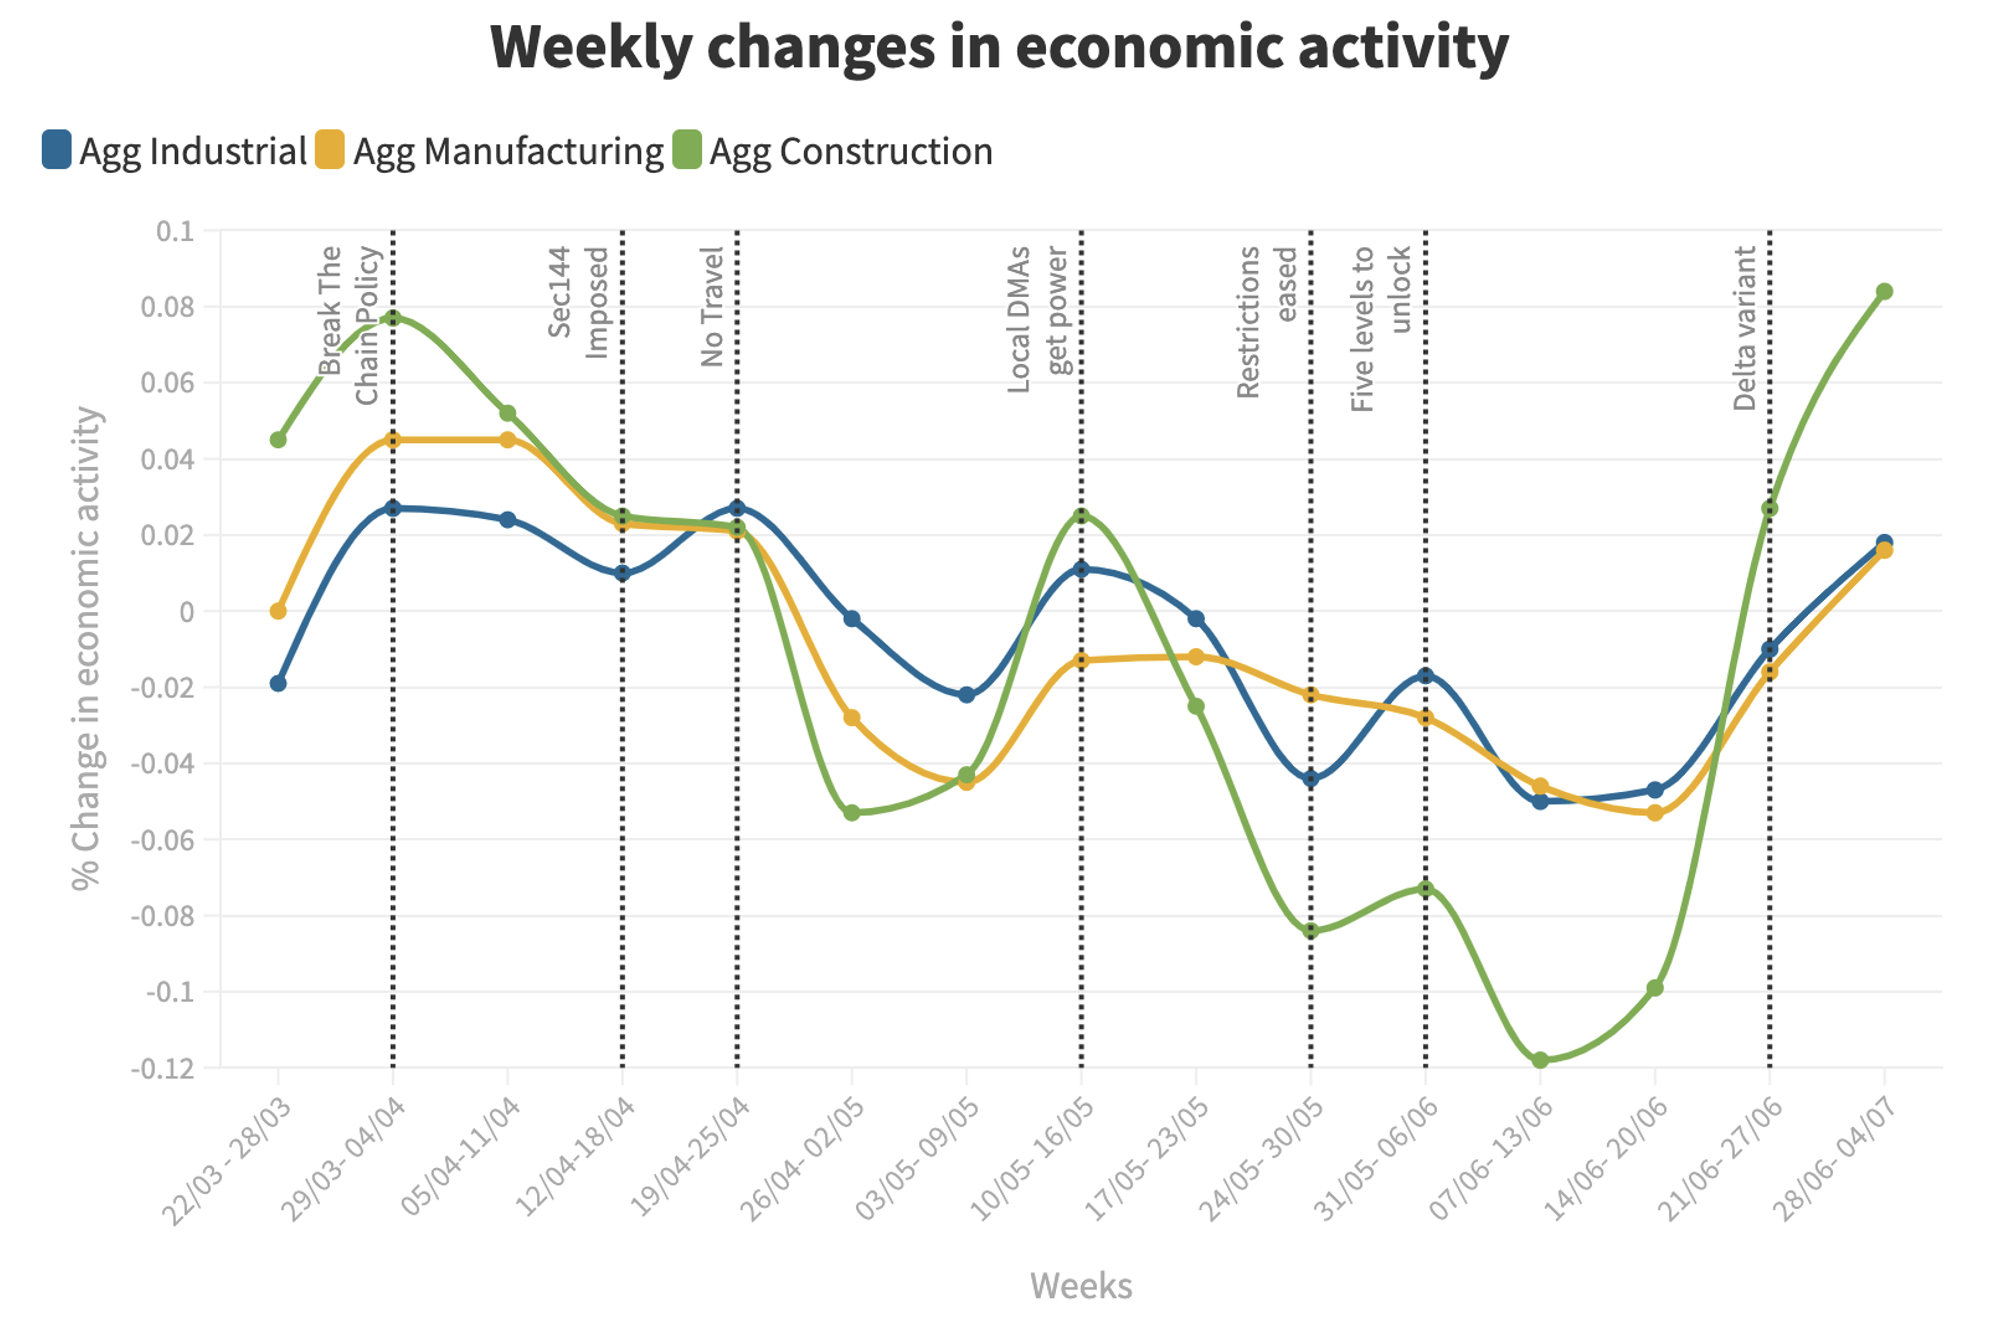
This lag in how general economic activity responded to policy directives is understandable. Firm-level decisions, especially ones that drastically change operations such as shutting/restarting a factory do require time since there are multiple variables (labour and capital) that need to be figured out. It could also be a result of the government’s wish to minimise the impact on the economy, at the risk of an increased caseload.
The developed method highlights the efficacy of using alternative, granular and fast frequency data from smartphones and satellite imagery to provide policymakers with real-time analysis which is often not available during an emergency. Quantifying the effects of government directives on movement and economic activity provides an understanding for future state interventions in similar situations.
While such data and methods can help bridge gaps, their benefits are limited when utilised independently of other data sources. It highlights an explanation, not the explanation. Hence, while it can give policymakers an overall direction and picture of the possible impact of their policies, it cannot accurately predict the ultimate impact. Ideally, such data should be used in conjunction with data from more traditional sources and backed up with qualitative interviews and pulse polling.
References
1 Annual Survey of Industries (ASI) (2020), Industrial Statistics Wing, Ministry of Statistics & P.I, Govt. of India. Retrieved April 11, 2022, from http://microdata.gov.in/nada43/index.php/catalog/ASI
2 Covid-19 notifications. KPMG. (n.d.). Retrieved April 11, 2022, from https://home.kpmg/in/en/home/insights/2021/06/covid-19-notifications-june-2021.html
3 Firstpost. (2020, March 24). PM Narendra Modi announces a national lockdown for 21 days starting midnight of 24-25 march-health news, Firstpost. Retrieved April 11, 2022, from https://www.firstpost.com/health/pm-narendra-modi-announces-a-national-lockdown-for-21-days-starting-midnight-of-24-25-march-8185961.html
4 Government of Maharashtra. (2022, March 10). Economic Survey of Maharashtra (2021-22). Retrieved April 11, 2022. https://tinyurl.com/2bjzvbem
5 Outlogic. (2022, March 2). Retrieved April 11, 2022, from https://outlogic.io through the Development Data Partnership.
6 SpaceKnow. (n.d.). Retrieved April 11, 2022, from https://spaceknow.com through the Development Data Partnership.
7 Sumitra Debroy / TNN / Updated: Sep 27, 2021. (2021, September 27). 2nd wave claimed 89,000 lives in Maharashtra, Pune worst affected: Mumbai News - Times of India. The Times of India. Retrieved April 11, 2022, from https://timesofindia.indiatimes.com/city/mumbai/2nd-wave-claimed-89k-lives-in-state-pune-worst-affected/articleshow/86542100.cms