A Data-Driven Framework to Support Bogota’s Barrios Vitales Project
by Felipe Targa , Ellin Ivarsson , David Uniman , Javier PeñaWaze Unacast Mapbox Transport
A data-driven framework to support the design, implementation, and evaluation of a superblock model in Bogotá from a speed management perspective and inform street design alternatives in the urban space.
Challenge
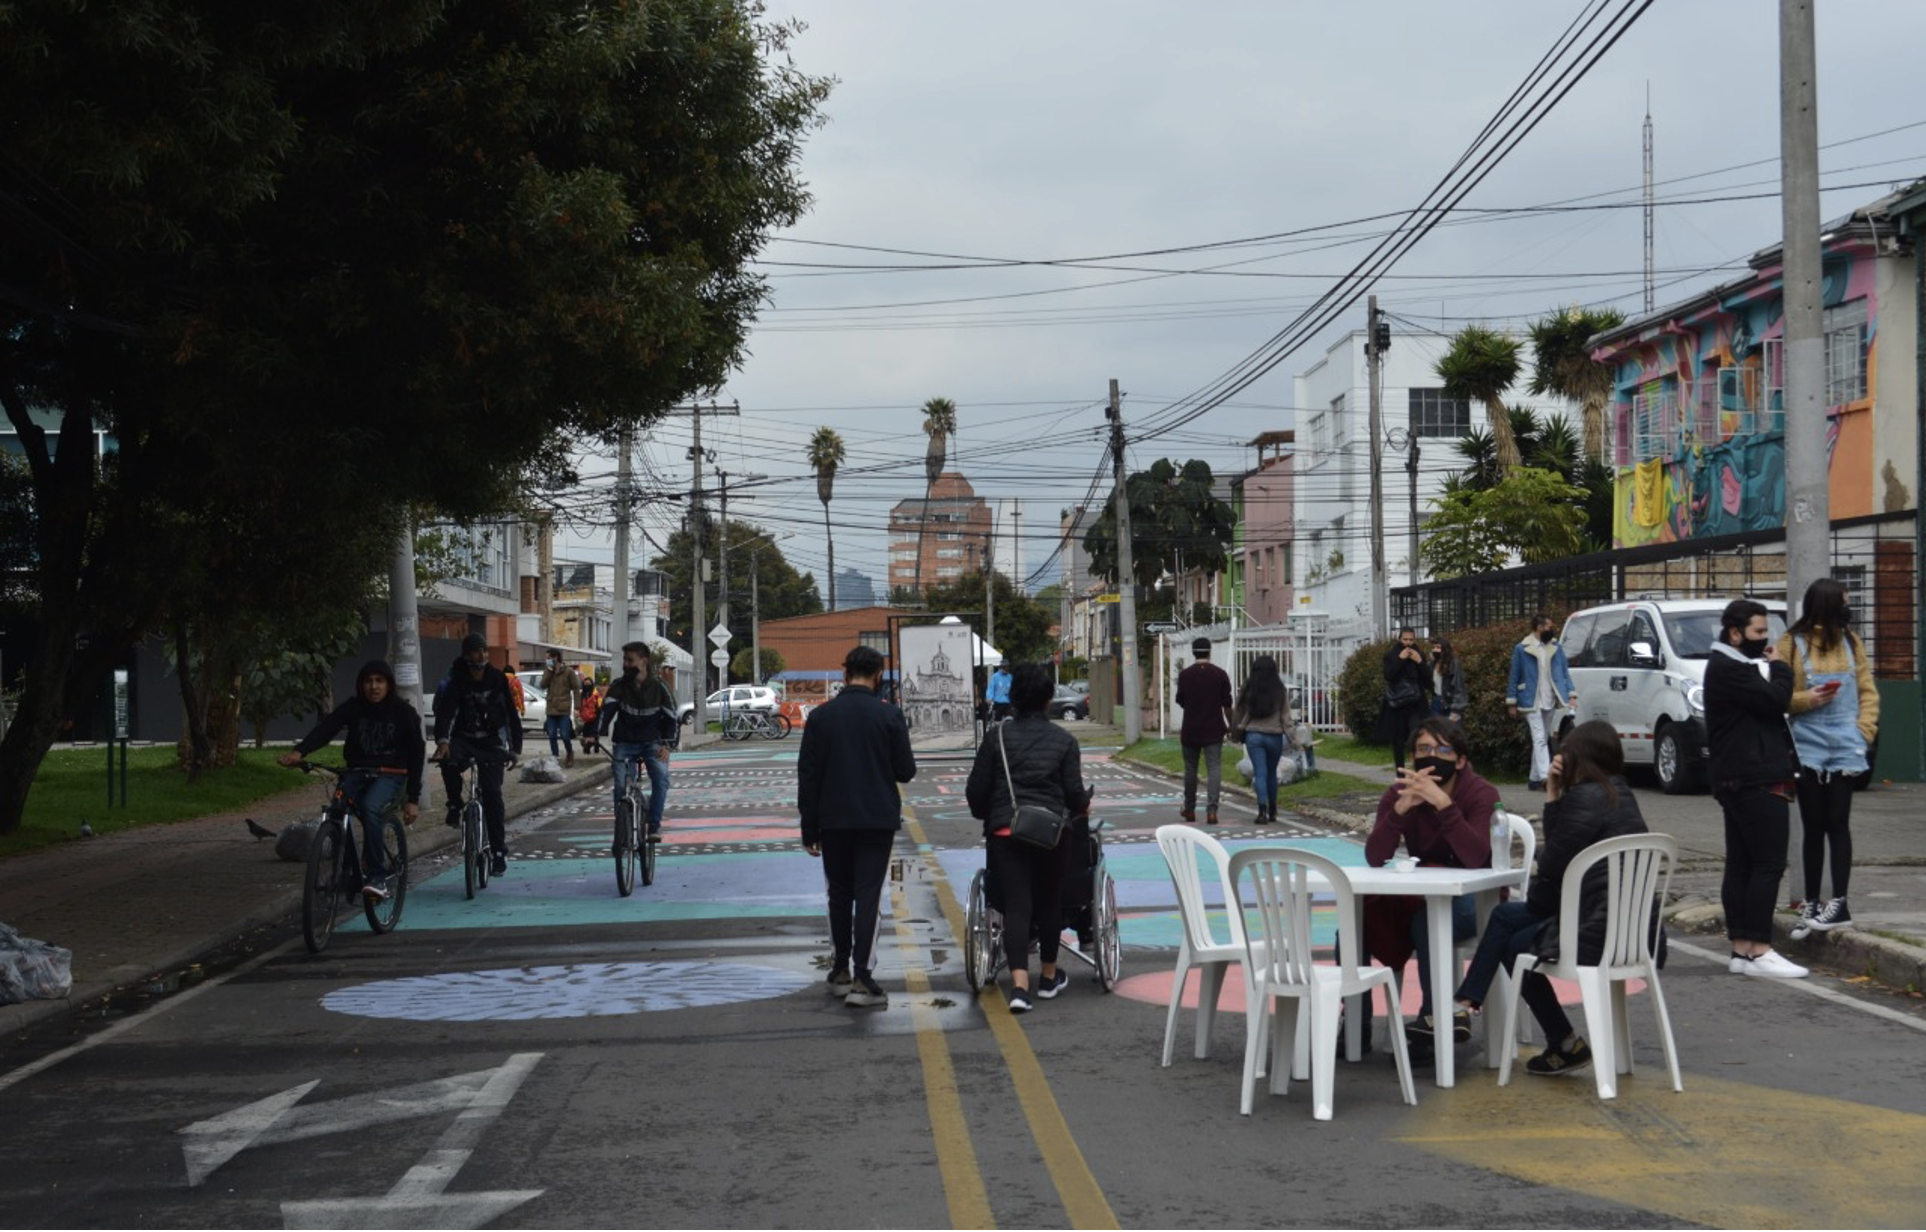
Throughout the world, car-dependent city planning has resulted in high levels of environmental pollution, sedentary lifestyles, traffic accidents, and increased vulnerability to the effects of climate change. These negative externalities bring to the resurgence of a new vision for sustainable cities, the “15-minute city” model that imagines places where residents can live locally, with everything they need just a short walk or bike ride away. Accordingly, Bogotá’s city administration proposes a superblock model in its mobility plan, called the Barrios Vitales (Vital Neighborhoods) project. This program seeks to transform road space currently dedicated to mobility functions by redirecting through-traffic in local streets to primary or arterial roads. Filtered permeability will incentivize unrestricted mobility for people walking and cycling while only allowing local access to motorized travel.
Solution
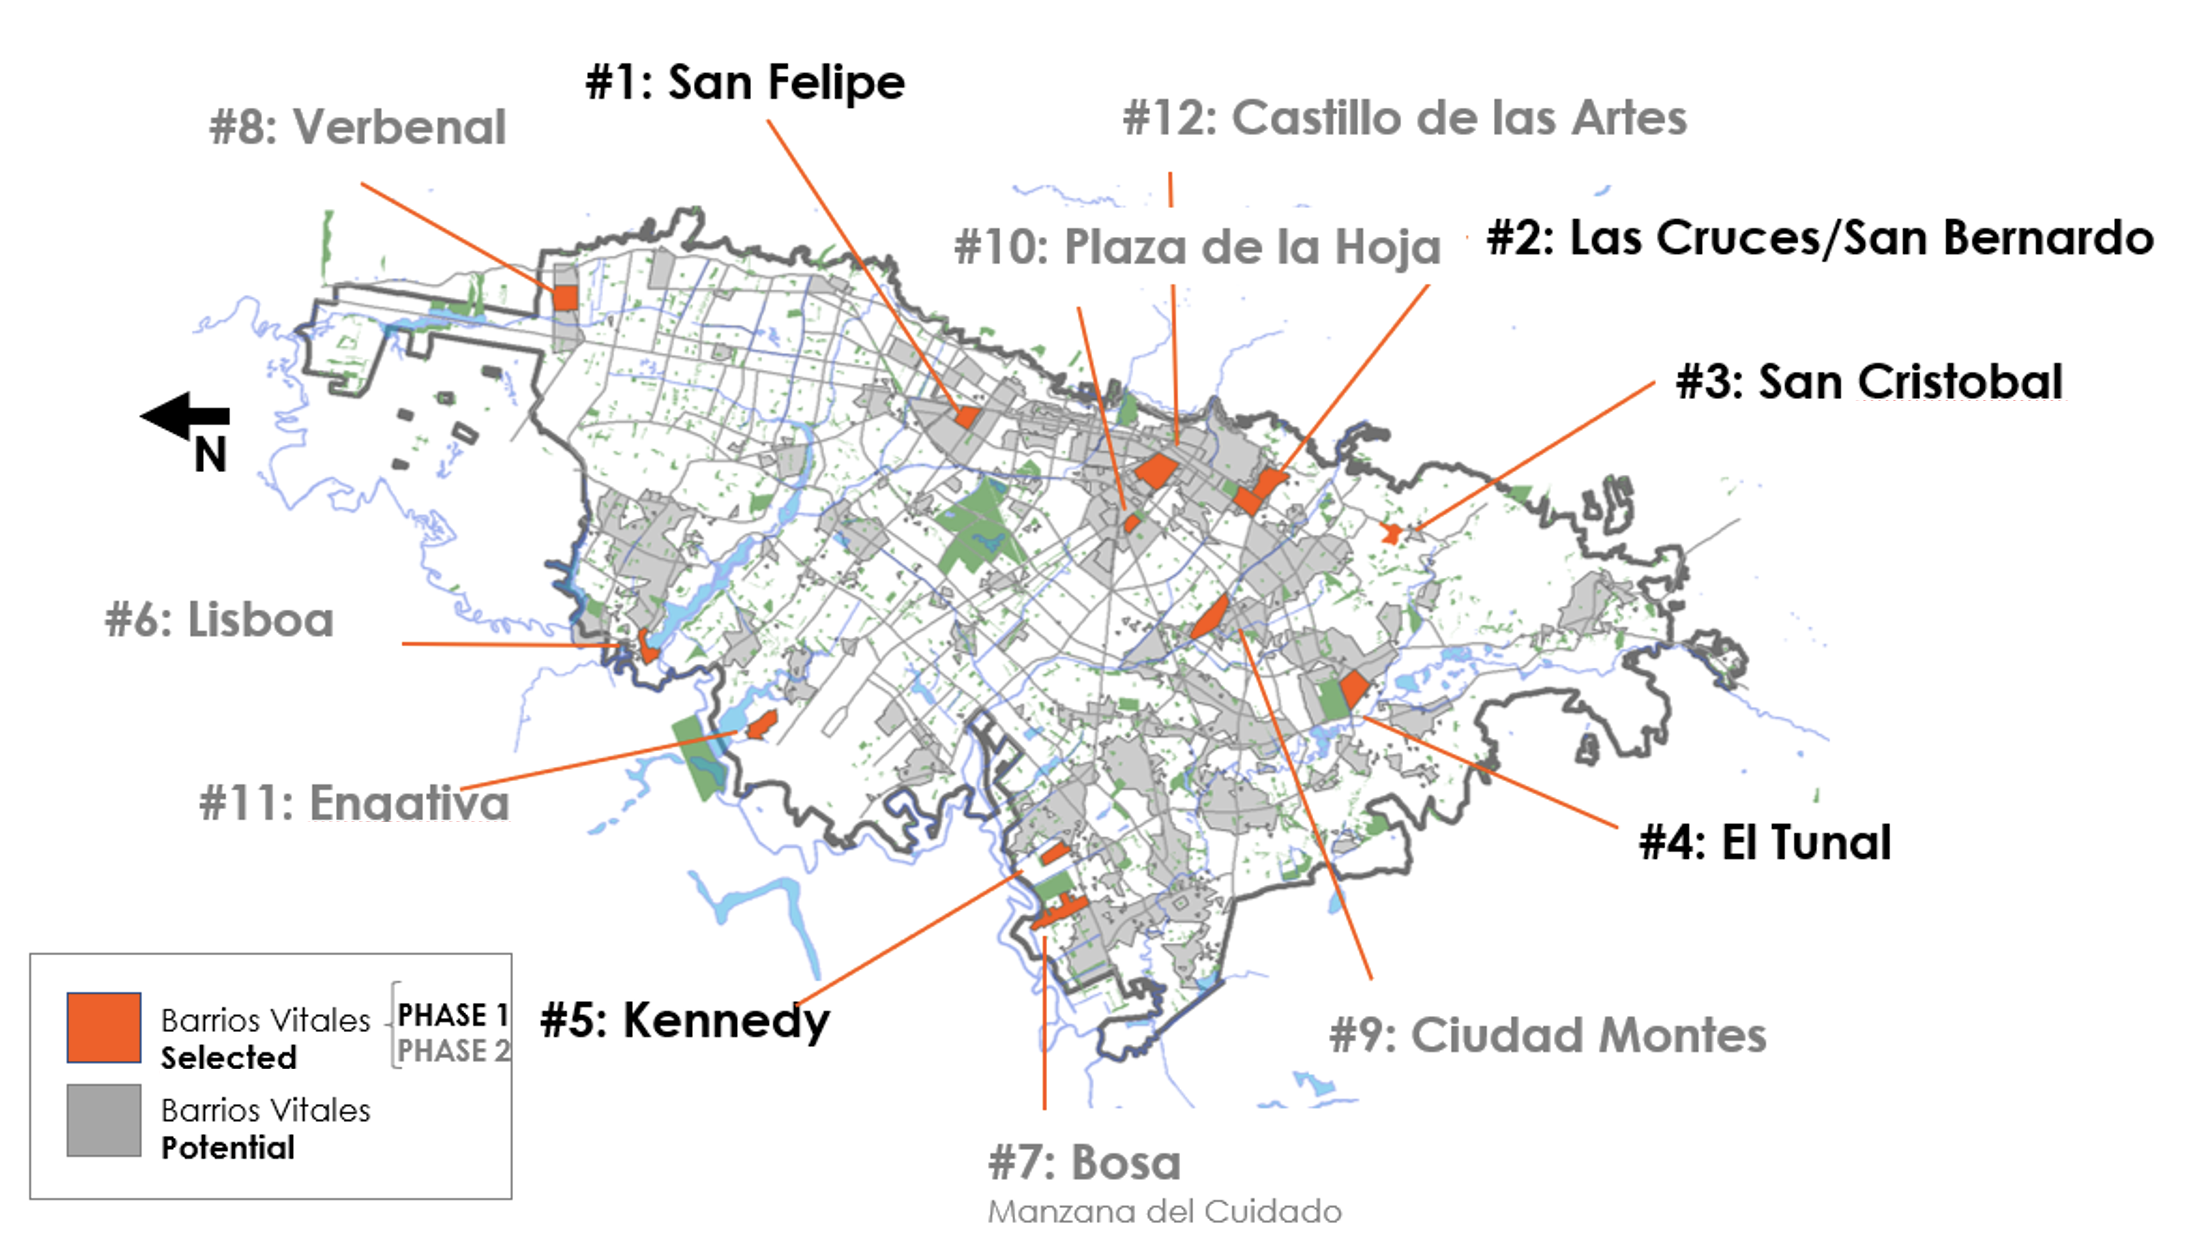
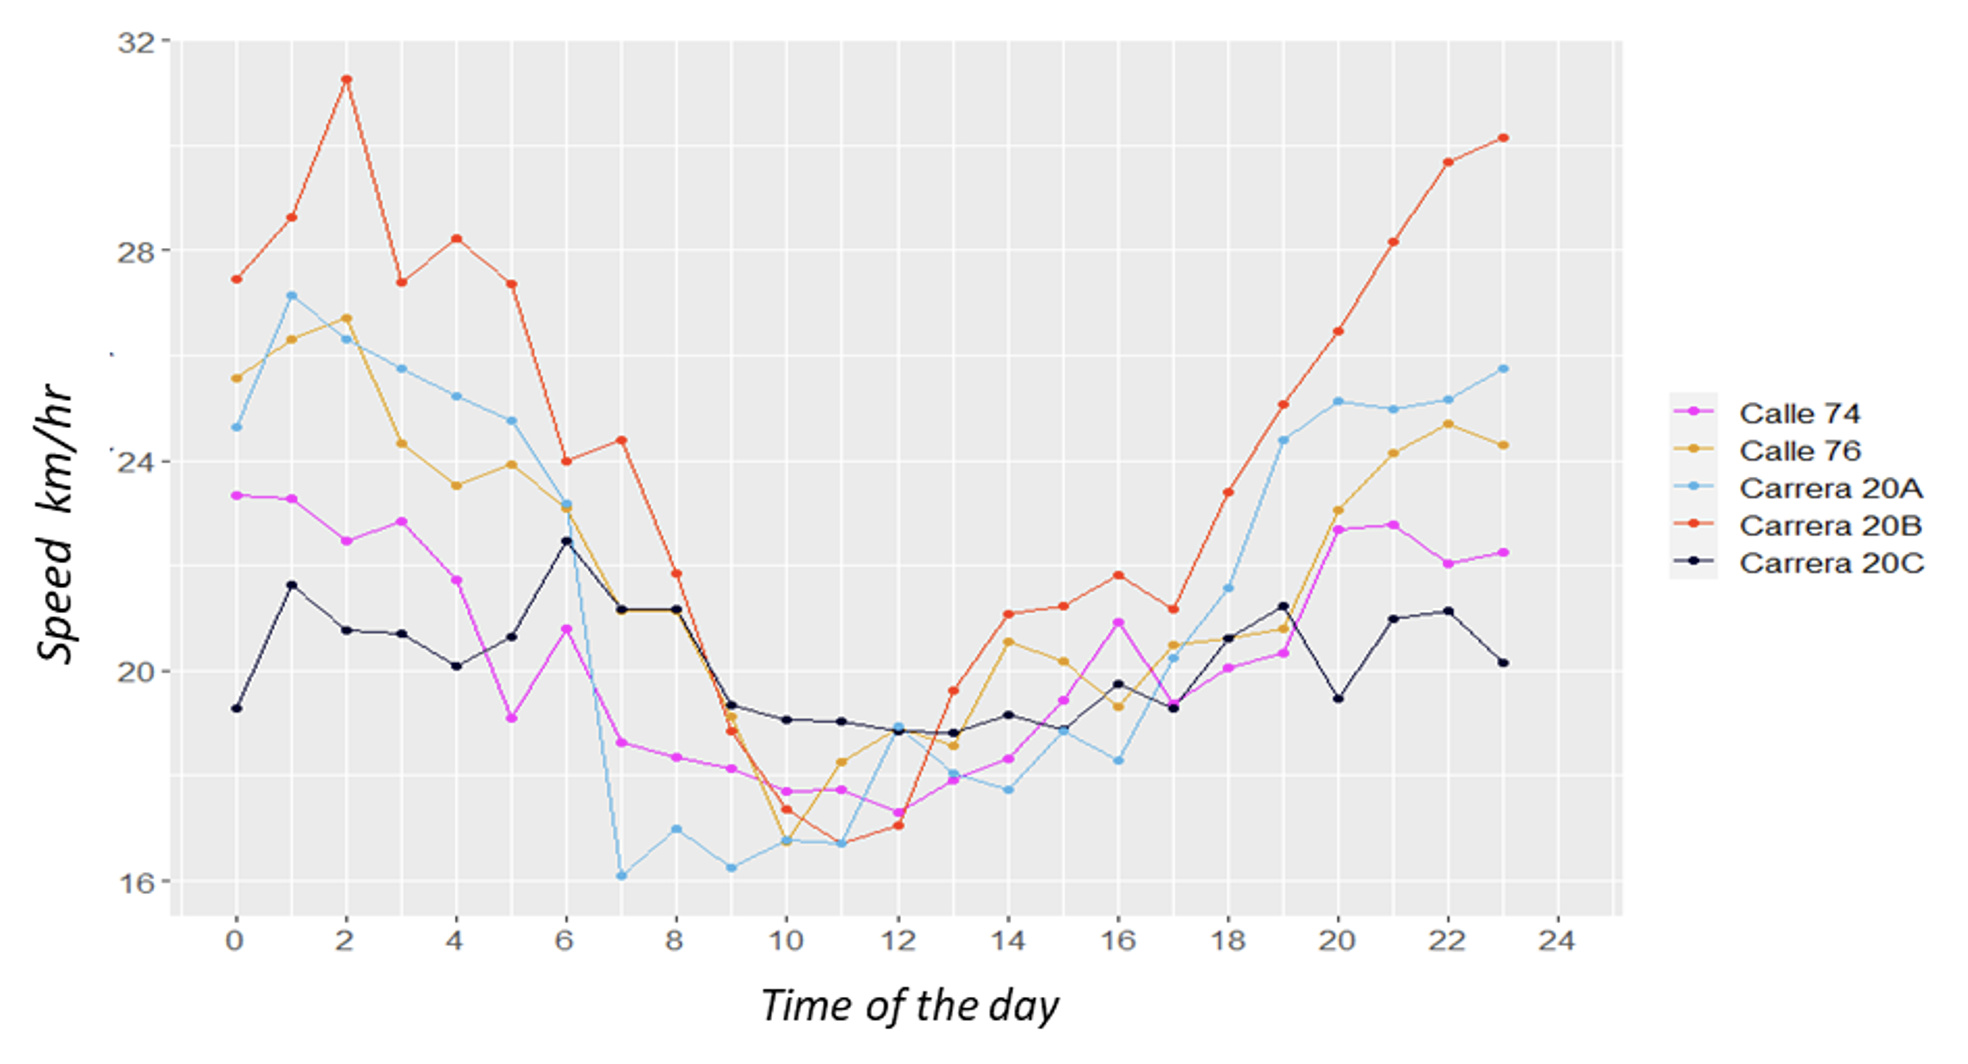
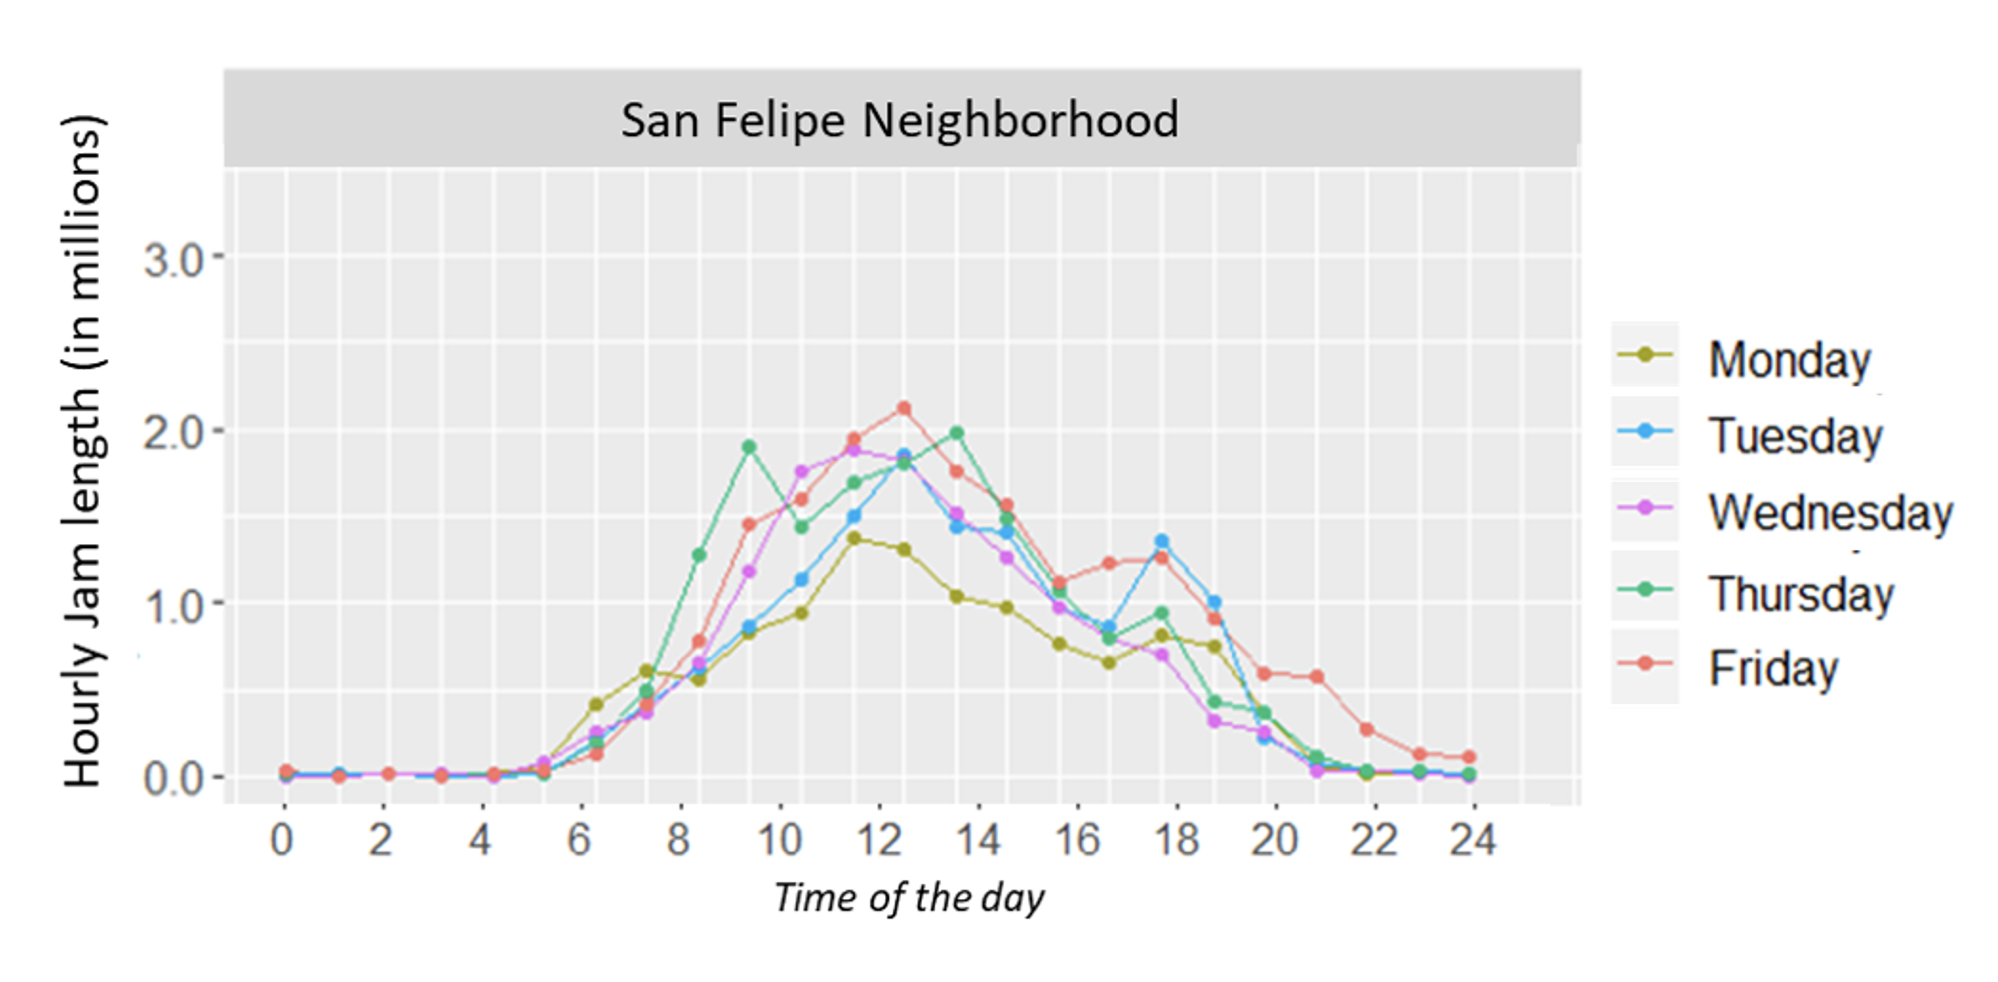
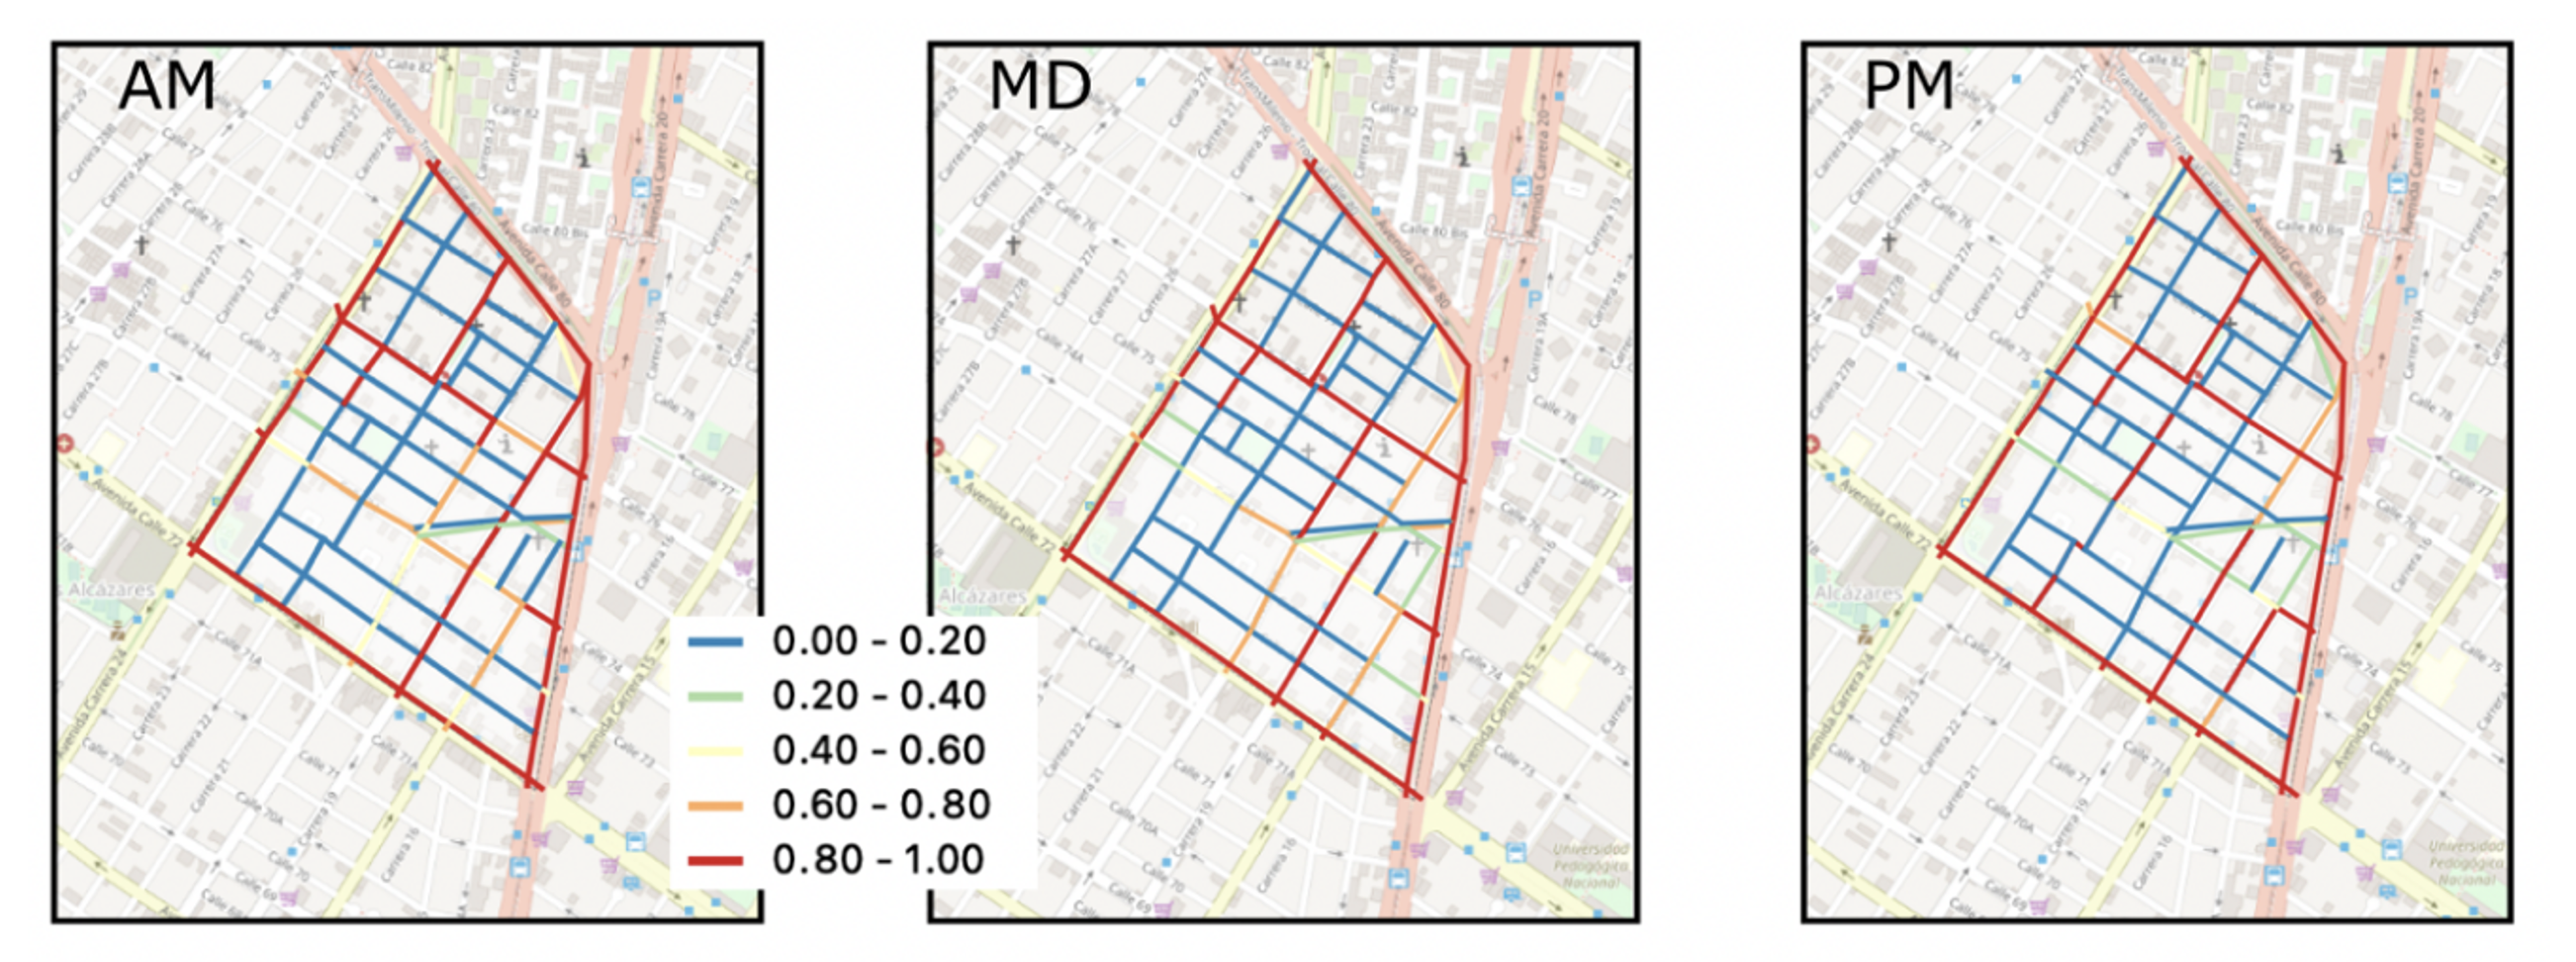
The World Bank Transport team combined datasets from Unacast, Mapbox and Waze to develop a toolkit that allows measuring Bogota’s Vital Neighborhoods initiative impact. The team assessed the traffic in the street network in a pre-intervention scenario for six selected areas scattered through Bogotá, and San Felipe was selected as the pilot neighborhood. To assess the pre-intervention scenario, the team estimated vehicle demand at the census tract scale using mobile location data from Unacast and assigned the drivers to the available routes, using a cellular automata simulation tool that accounts for the shortest travel times and congestion. As a validation/calibration step, the team compared the estimated travel times (average speeds) in the road segments with the results of the Mapbox Traffic Data and with on ground collected volumes provided by Bogotá transport department. In addition, the team monitored the traffic jam length during the day, finding similar behavior between the simulated data and the Waze minute-to-minute jam reported data.
Impact
The results from the traffic simulation allowed city practitioners to make informed decisions and build data-based insights to inform communities about the benefits that the project will bring to the community. As an example, it was possible to identify that, in some areas, around 75% of the vehicles congesting the local roads are through traffic (see Figure 4). In a post-intervention scenario, this toolkit will allow city planners to study and understand the role of public open space in promoting active living, road safety and public life outcomes.