Buenos Aires Transport Demand Planning
by Aiga Stokenberga , Javier Morales Sarriera , Javier Rodrigo Pena BastidasWaze Transport Urban Development
Challenge
The COVID-19 pandemic and the lockdown measures implemented in 2020 had a significant impact on mobility in the Metropolitan Area of Buenos Aires (AMBA), adding new constrains to the travel behaviours of residents and businesses.
Several policy responses have been made since the start of the pandemic in order to accommodate the new normal. For example, the City of Buenos Aires (CABA) implemented pop-up bike lanes with higher capacity in two major corridors previously dominated by cars.
All three governments with jurisdiction over transport in AMBA, through the Metropolitan Transport Agency (MTA), have agreed to work on innovative ways to move towards a more demand-responsive approach, such as by reducing public transport services on routes that overlap and where ridership is low. However, the data readily available to AMBA’s transport planners has been inadequate to understand exactly how travel patterns in the metropolitan area have changed since March 2020, what have been their drivers, and how persistent the changes might be going forward.
Solution
This study with the objective of generating new insights on the extent to which the various developments associated with the pandemic have affected urban mobility trends in AMBA. To this end the team from the World Bank used granular spatiotemporal data from multiple data sources – Call Detail Records (CDR) data to estimate OD matrices, Waze for Cities data to track congestion over time, a survey conducted by the team of current privatized motor transport users other publicly available data sources.
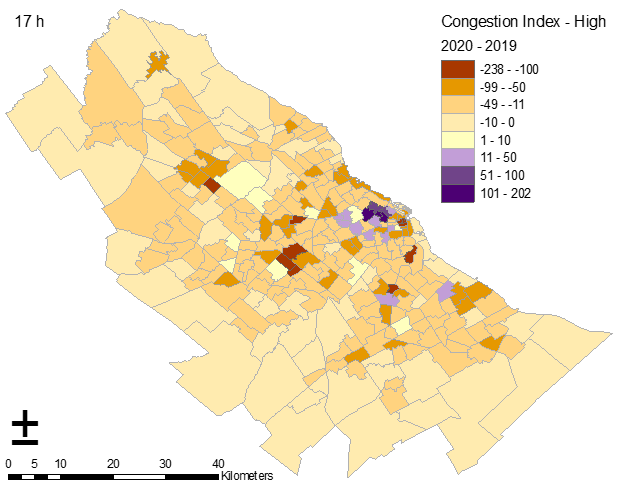
Waze data is typically used for traffic management purposes. Within this study, the use case was extended to include transport planning. They do this by calculating a congestion index. The Congestion Index is measured by the kilometres of roads congested for a specific duration of time as a share of the total road network kilometres.
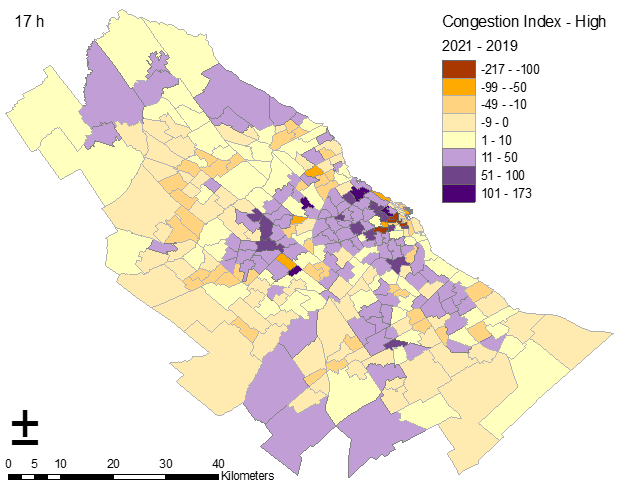
They considered three different time periods in the study October 2019 (pre-pandemic), October 2020 (pandemic) and October 2021 (new-normal) and three spatial areas – the Autonomous City of Buenos Aires (CABA), Greater Buenos Aires (GBA) and the overall Metropolitan Area Buenos Aires (AMBA).
It was seen that the Congestion Index was much higher in CABA than in GBA or AMBA in all three periods. Across AMBA, high congestion in October 2021 appears to have exceeded the October 2019 level during the highest activity hours (Figure 1 b) even though total traffic intensity measured across the entire day was 11% lower.
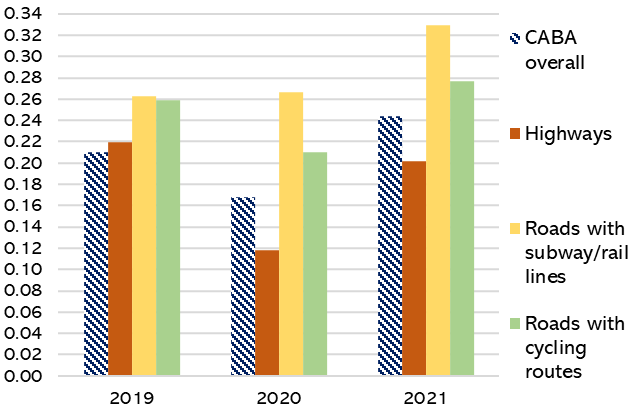
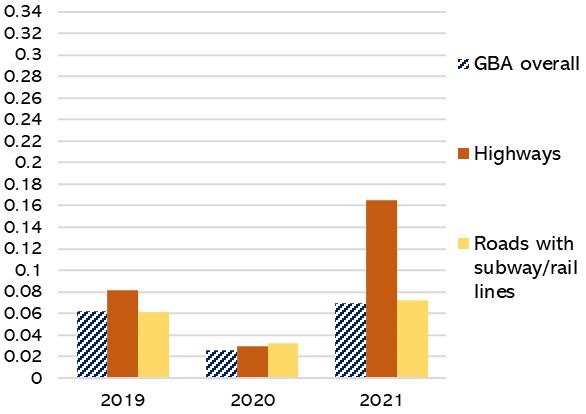
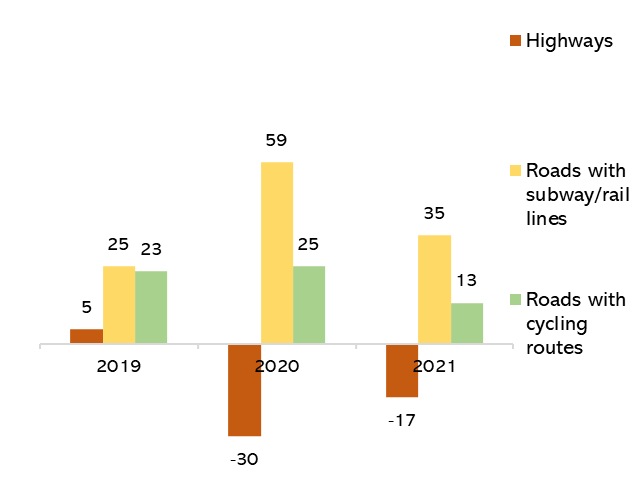
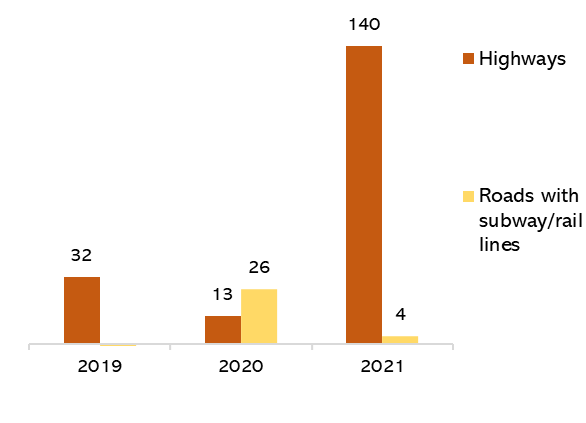
The team went on to analyse the traffic intensity changes disaggregated by highways, roads with cycle lanes and roads near subway/rail service routes (Figure 2). In CABA, congestion increased more on roads near rail/subway lines in 2021, while in GBA it increased more on the highways.
CABA vs. GBA
Compared to CABA average (%) vs. Compared to GBA average (%)
Comparing congestion levels at the macrozone level, it was found that across 2019-2021, traffic intensity at peak rush hour (17:00) was higher in macrozones with higher bus route density per land area (although at very high densities the congestion index starts to decline) and more bus route availability per total road length. A possible explanation could be that there tends to be more traffic on major avenues, which also happen to have bus services. The density of bus routes (different from quantity and quality of bus service) does not significantly reduce overall traffic intensity.
Impact
The team combined data and insights obtained from multiple different data sources to understand how urban mobility in AMBA will evolve in the coming years and what are the implications of this to policy and planning. One of the biggest impacts of this project has been the creation of a data-driven evidence base to inform transport planning in Buenos Aires that is planned to be replicated in several secondary cities in Argentina in 2022-2023. The successful use of granular private sector data in this project allowed the team to propose a roadmap for the establishment of data access agreements with private entities in Buenos Aires.