03-regression
Contents
6. 03-regression#
Runs logistic regression
Step 31 of methods
Edit correct cells, then run all
#imports
import numpy as np
import pandas as pd
import geopandas as gpd
import statsmodels.api as sm
import matplotlib.pyplot as plt
from sklearn.linear_model import LogisticRegression
from sklearn import metrics
from sklearn.model_selection import train_test_split
from sklearn.metrics import roc_auc_score
from sklearn.metrics import roc_curve
from datetime import date
import math
from shapely import ops
import requests
import json

KEY = "" #add personal key here
functions complilation
def rename_columns(df, prefix):

    for col in df.columns:
        new_col = prefix + col.replace(" ", "")
        df = df.rename(columns={col: new_col})
    return df
def call_line(coordinates, fields, timestep):
    #perform API call
    url = 'https://api.tomorrow.io/v4/timelines?apikey=' + KEY

    payload = {
        'units':'metric',
        'timesteps': timestep,
        #'location': point,
        'fields': fields,
        'timezone': 'America/New_York',
        #'startTime': (now - timedelta(days=1)).isoformat(),
        #'endTime': now.isoformat(),
        'location': {
            'type': 'LineString',
            'coordinates': coordinates},
    }

    headers = {
    "Accept": "application/json",
    "Content-Type": "application/json"
    }

    response = requests.request("POST", url, json=payload, headers=headers)
    return response
def format_response(response):
    text = json.loads(response.text)
    timelines = text['data']['timelines']
    nest = timelines[0]['intervals'] #list - each element is a dictionary with startTime and values
    startTimes = pd.DataFrame(nest)['startTime']

    val = nest[0]['values'] #first time-stamp value
    values = pd.DataFrame(val, index=[0])

    #iterate through all time-stamps
    for i in range(1, len(startTimes)):
        val = nest[i]['values']
        df = pd.DataFrame(val, index=[i])
        values = pd.concat([values, df], axis=0)

    data = pd.concat([startTimes, values], axis=1)
    return data
6.1. START HERE#
edit
date_listto include all files that have been data processedthen run all cells
date_list = ['2021-06-20', '2021-06-21', '2021-06-23', '2021-06-26', '2021-06-27', '2021-06-28']
df = pd.DataFrame(index=range(0,2))
for i in date_list:
    print(i)
    closures = gpd.read_file('/home/jovyan/work/data/a-closures/closures-agg/' + i + '.gpkg')
    slope = pd.read_csv(str('/home/jovyan/work/data/c-dem/slope/' + i + '.csv'))
    aspect = pd.read_csv('/home/jovyan/work/data/c-dem/aspect/' + i + '.csv')
    elev = pd.read_csv('/home/jovyan/work/data/c-dem/elevation/' + i + '.csv')

    slope = rename_columns(slope, 'slope')
    aspect = rename_columns(aspect, 'aspect')
    elev = rename_columns(elev, 'elev')

    data = closures.merge(slope, left_index=True, right_index=True)
    data = data.merge(aspect, left_index=True, right_index=True)
    data = data.merge(elev, left_index=True, right_index=True)

    #this leaves out all road segments that are within 5 km of the closure, to account for geotagging/chainage errors.
    drop_list = []
    for index, row in data.iterrows():
        status = row['status']
        if status == 1:
            before = list(range(int(index-5),int(index)))
            after = list(range(int(index+1),int(index+6)))
            for i in before:
                if i < 0:
                    pass
                elif data.iloc[i, data.columns.get_loc("status")] == 0:
                    drop_list.append(i)
            for i in after:
                if i >= len(data):
                    pass
                elif data.iloc[i, data.columns.get_loc("status")] == 0:
                    drop_list.append(i)

    drop_array = np.unique(np.array(drop_list))
    data = data.drop(drop_array)
    df = df.append(data)
df = df.dropna(how='all')
data = pd.DataFrame(df)
y = np.asarray(data['status'])
#X = data[['precip_1d', 'elevMaximum', 'slopeVariance', 'slopeStandarddeviation', 'aspectMean']]
X = data.drop(['status','date', 'datetime', 'geometry', 'segment_id', 'road_id', 'elevpixelcount', 'aspectpixelcount', 'slopepixelcount', 'elevZoneID', 'aspectZoneID', 'slopeZoneID'], axis=1)
#X = data.drop(['status','date', 'datetime', 'geometry', 'segment_id', 'road_id', 'elevpixelcount', 'aspectpixelcount', 'slopepixelcount', 'elevZoneID', 'aspectZoneID', 'slopeZoneID', 'elevMedian', 'elevMean', 'aspectMean', 'aspectVariance', 'aspectMedianabsolutedeviation', 'slopeMaximum', 'slopeMedian', 'aspectMinimum'], axis=1)
#X = np.asarray(X.loc[:, X.columns != 'geometry'])
logit_model=sm.Logit(y,X)
result=logit_model.fit()
print(result.summary2())
Optimization terminated successfully.
         Current function value: 0.083818
         Iterations 16
                               Results: Logit
=============================================================================
Model:                    Logit                Pseudo R-squared:     0.045
Dependent Variable:       y                    AIC:                  410.1172
Date:                     2021-09-04 00:46     BIC:                  535.2733
No. Observations:         2184                 Log-Likelihood:       -183.06
Df Model:                 21                   LL-Null:              -191.62
Df Residuals:             2162                 LLR p-value:          0.70389
Converged:                1.0000               Scale:                1.0000
No. Iterations:           16.0000
-----------------------------------------------------------------------------
                               Coef.  Std.Err.    z    P>|z|   [0.025  0.975]
-----------------------------------------------------------------------------
precip_1d                     -0.0033   0.0021 -1.5613 0.1185 -0.0074  0.0008
slopeMean                      0.2705   0.2670  1.0131 0.3110 -0.2528  0.7938
slopeMedian                   -0.0795   0.2135 -0.3722 0.7098 -0.4980  0.3391
slopeStandarddeviation        -1.4604   0.4822 -3.0287 0.0025 -2.4054 -0.5153
slopeVariance                  0.0429   0.0164  2.6134 0.0090  0.0107  0.0751
slopeMinimum                  -0.1769   0.0702 -2.5220 0.0117 -0.3145 -0.0394
slopeMaximum                   0.0049   0.0641  0.0765 0.9390 -0.1208  0.1306
slopeMedianabsolutedeviation   0.4450   0.2838  1.5676 0.1170 -0.1114  1.0013
aspectMean                    -0.0020   0.0094 -0.2130 0.8313 -0.0204  0.0164
aspectMedian                   0.0069   0.0065  1.0509 0.2933 -0.0059  0.0197
aspectStandarddeviation       -0.0056   0.0094 -0.6021 0.5471 -0.0240  0.0127
aspectVariance                -0.0000   0.0000 -0.0522 0.9584 -0.0000  0.0000
aspectMinimum                 -0.0002   0.0003 -0.8464 0.3973 -0.0008  0.0003
aspectMaximum                 -0.0066   0.0044 -1.5072 0.1318 -0.0151  0.0020
aspectMedianabsolutedeviation  0.0055   0.0094  0.5878 0.5567 -0.0129  0.0240
elevMean                      -0.0012   0.0662 -0.0174 0.9861 -0.1310  0.1286
elevMedian                    -0.0151   0.0504 -0.2987 0.7652 -0.1139  0.0838
elevStandarddeviation          0.1599   0.0915  1.7483 0.0804 -0.0194  0.3392
elevVariance                  -0.0007   0.0004 -1.5545 0.1201 -0.0016  0.0002
elevMinimum                    0.0195   0.0170  1.1467 0.2515 -0.0138  0.0527
elevMaximum                   -0.0036   0.0131 -0.2777 0.7812 -0.0294  0.0221
elevMedianabsolutedeviation   -0.1011   0.0517 -1.9578 0.0503 -0.2024  0.0001
=============================================================================
data2= data[['road_id','status','segment_id','datetime','precip_1d','slopeMinimum', 'aspectMedian', 'aspectMaximum', 'elevStandarddeviation']]
data2.sample(n=5)
| road_id | status | segment_id | datetime | precip_1d | slopeMinimum | aspectMedian | aspectMaximum | elevStandarddeviation | |
|---|---|---|---|---|---|---|---|---|---|
| 194 | 57.0 | 0.0 | 37.0 | 2021-06-21T12:29:59 | 0.0 | 1.469081 | 58.443527 | 360.00000 | 62.872677 |
| 175 | 13.0 | 1.0 | 176.0 | 2021-06-20T12:29:59 | 9.0 | 13.249520 | 268.264280 | 359.69687 | 37.035800 |
| 132 | 57.0 | 0.0 | 56.0 | 2021-06-28T12:29:59 | 0.0 | 7.450240 | 210.172300 | 336.80140 | 64.716500 |
| 122 | 28.0 | 0.0 | 81.0 | 2021-06-21T12:29:59 | 0.0 | 3.062798 | 185.387100 | 359.25595 | 18.401546 |
| 115 | 28.0 | 0.0 | 74.0 | 2021-06-21T12:29:59 | 0.0 | 0.503988 | 207.665800 | 357.87890 | 21.763947 |
X_train, X_test, y_train, y_test = train_test_split(X, y, test_size=0.3, random_state=0)
logreg = LogisticRegression()
logreg.fit(X_train, y_train)
y_pred = logreg.predict(X_test)
print('Accuracy of logistic regression classifier on test set: {:.2f}'.format(logreg.score(X_test, y_test)))
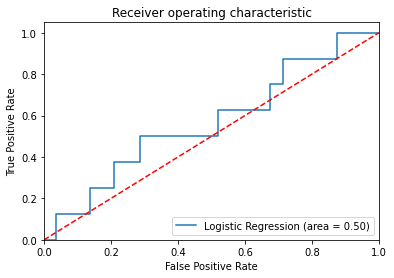
logit_roc_auc = roc_auc_score(y_test, logreg.predict(X_test))
fpr, tpr, thresholds = roc_curve(y_test, logreg.predict_proba(X_test)[:,1])
plt.figure()
plt.plot(fpr, tpr, label='Logistic Regression (area = %0.2f)' % logit_roc_auc)
plt.plot([0, 1], [0, 1],'r--')
plt.xlim([0.0, 1.0])
plt.ylim([0.0, 1.05])
plt.xlabel('False Positive Rate')
plt.ylabel('True Positive Rate')
plt.title('Receiver operating characteristic')
plt.legend(loc="lower right")
plt.savefig('Log_ROC')
plt.show()
/opt/conda/lib/python3.8/site-packages/sklearn/linear_model/_logistic.py:762: ConvergenceWarning: lbfgs failed to converge (status=1):
STOP: TOTAL NO. of ITERATIONS REACHED LIMIT.

Increase the number of iterations (max_iter) or scale the data as shown in:
    https://scikit-learn.org/stable/modules/preprocessing.html
Please also refer to the documentation for alternative solver options:
    https://scikit-learn.org/stable/modules/linear_model.html#logistic-regression
  n_iter_i = _check_optimize_result(
Accuracy of logistic regression classifier on test set: 0.99
6.2. DATA#
collects all the data for road 54
road = gpd.read_file('/home/jovyan/work/data/b-roads/road-split/54.gpkg')

slope = pd.read_csv('/home/jovyan/work/data/c-dem/slope/54.csv')
aspect = pd.read_csv('/home/jovyan/work/data/c-dem/aspect/54.csv')
elev = pd.read_csv('/home/jovyan/work/data/c-dem/elevation/54.csv')

slope = rename_columns(slope, 'slope')
aspect = rename_columns(aspect, 'aspect')
elev = rename_columns(elev, 'elev')

data = road.merge(slope, left_index=True, right_index=True)
data = data.merge(aspect, left_index=True, right_index=True)
data = data.merge(elev, left_index=True, right_index=True)

data = data.drop(['elevpixelcount', 'aspectpixelcount', 'slopepixelcount', 'elevZoneID', 'aspectZoneID', 'slopeZoneID'], axis=1)
#add precipitation data for segments 1-10 on road 54 in the next 24 hours. Only adding 10 segments' data at a time due to API call limit.
for index, row in data.head(10).iterrows():
    geom = row['geometry']
    geom_list = list(ops.linemerge(geom).coords)
    res = [list(ele) for ele in geom_list]
    response = call_line(res, ['precipitationIntensityAvg'], ['1h'])
    table = format_response(response)
    data.at[index, 'precip_1d'] = table.head(23).sum()['precipitationIntensityAvg']
data2 = data.drop(['road_id', 'date', 'status', 'segment_id', 'geometry', 'aspectMean'], axis=1)
data2 = data2.head(10)

#run prediction on fist 10 line segments
y_pred = logreg.predict(data2)
data3 = data.head(10)
data3['probability'] = y_pred
data3[['road_id', 'date', 'segment_id', 'geometry', 'precip_1d', 'probability']]
/opt/conda/lib/python3.8/site-packages/geopandas/geodataframe.py:853: SettingWithCopyWarning:
A value is trying to be set on a copy of a slice from a DataFrame.
Try using .loc[row_indexer,col_indexer] = value instead

See the caveats in the documentation: https://pandas.pydata.org/pandas-docs/stable/user_guide/indexing.html#returning-a-view-versus-a-copy
  super(GeoDataFrame, self).__setitem__(key, value)
| road_id | date | segment_id | geometry | precip_1d | probability | |
|---|---|---|---|---|---|---|
| 0 | 54 | 2021-07-12 | 1 | MULTILINESTRING ((79.21719 30.26079, 79.21749 ... | 8.1075 | 0.0 |
| 1 | 54 | 2021-07-12 | 2 | MULTILINESTRING ((79.21827 30.25553, 79.21801 ... | 8.1075 | 0.0 |
| 2 | 54 | 2021-07-12 | 3 | MULTILINESTRING ((79.21520 30.25862, 79.21484 ... | 8.1075 | 0.0 |
| 3 | 54 | 2021-07-12 | 4 | MULTILINESTRING ((79.21620 30.25347, 79.21600 ... | 18.5075 | 0.0 |
| 4 | 54 | 2021-07-12 | 5 | MULTILINESTRING ((79.21417 30.24601, 79.21422 ... | 28.9077 | 0.0 |
| 5 | 54 | 2021-07-12 | 6 | MULTILINESTRING ((79.21905 30.24550, 79.21929 ... | 28.9077 | 0.0 |
| 6 | 54 | 2021-07-12 | 7 | MULTILINESTRING ((79.21855 30.24397, 79.21830 ... | 28.9077 | 0.0 |
| 7 | 54 | 2021-07-12 | 8 | MULTILINESTRING ((79.22114 30.24374, 79.22138 ... | 28.9077 | 0.0 |
| 8 | 54 | 2021-07-12 | 9 | MULTILINESTRING ((79.22994 30.24412, 79.22943 ... | 28.9077 | 0.0 |
| 9 | 54 | 2021-07-12 | 10 | MULTILINESTRING ((79.22076 30.24131, 79.22040 ... | 28.9077 | 0.0 |