Create a Tessellation from a GeoDataFrame#
This Jupyter Notebook demonstrates the usage of a custom tessellate function designed to tessellate geometries within a GeoDataFrame into hexagonal cells using H3, a hierarchical hexagonal geospatial indexing system. The tessellate function takes a GeoDataFrame with geometries, such as polygons or multipolygons, and converts them to EPSG:4326 CRS before tessellating them into hexagonal cells at a specified resolution. The resulting tessellated geometries are then plotted alongside the original geometries for comparison.
Requirements#
import geopandas as gpd
import matplotlib.pyplot as plt

from mobilyze.tessellation import tessellate
Area of Interest#
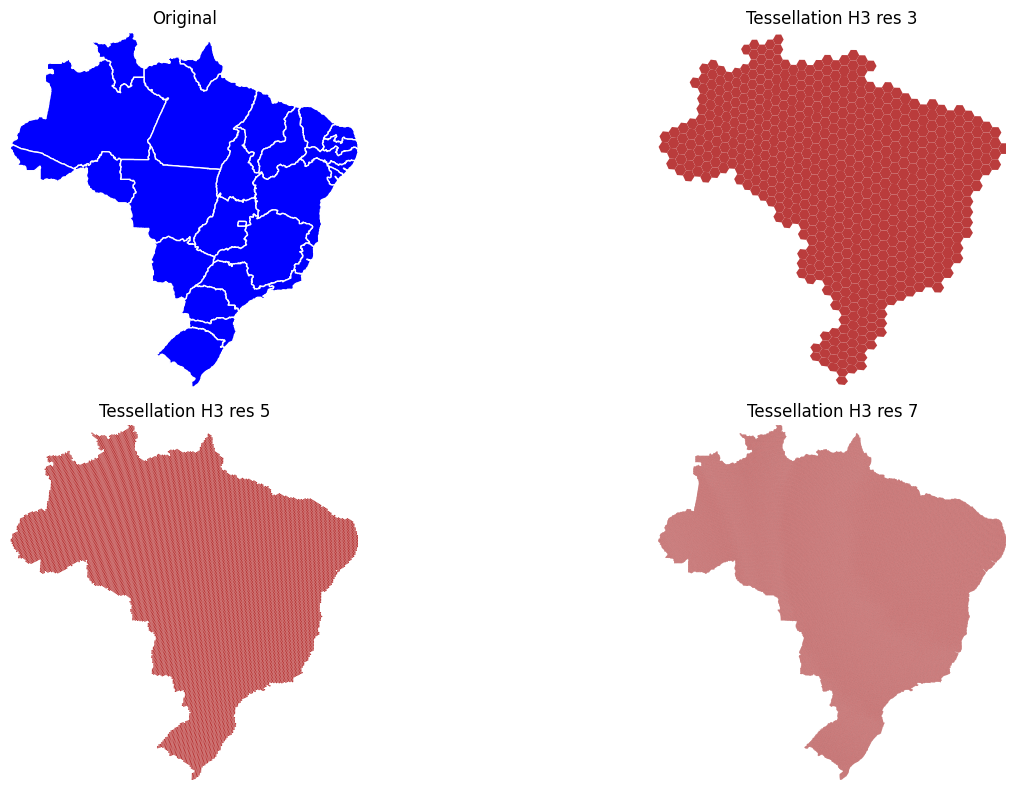
In this example, we use geoBoundaries to obtain first-level administrative boundaries of of Brazil.
Show code cell source
BRA = gpd.read_file(
    "https://github.com/wmgeolab/geoBoundaries/raw/9469f09/releaseData/gbOpen/BRA/ADM1/geoBoundaries-BRA-ADM1.geojson"
)
BRA.explore()
Results#
Now, we apply the tessellate function to tessellate the the region into hexagonal cells at a specified resolution. We choose resolution 7, for which each hexagon area area averages approximatey 5 square km.
tessellated_gdf = tessellate(BRA, columns=["shapeName"], resolution=7)
Let’s examine the dataframe with the newly computed index and geometry, representing the H3 hexagons at the designated resolution.
| shapeName | geometry | |
|---|---|---|
| 875f04800ffffff | Para | POLYGON ((-55.98339 2.29946, -55.97644 2.31093... |
| 875f04801ffffff | Para | POLYGON ((-56.00248 2.31118, -55.99553 2.32265... |
| 875f04802ffffff | Para | POLYGON ((-55.96341 2.31081, -55.95646 2.32228... |
| 875f04803ffffff | Para | POLYGON ((-55.98251 2.32253, -55.97556 2.33400... |
| 875f04804ffffff | Para | POLYGON ((-55.98426 2.27638, -55.97731 2.28786... |
| ... | ... | ... |
| 87c2dbdb2ffffff | Rio Grande do Sul | POLYGON ((-55.71972 -30.77952, -55.71239 -30.7... |
| 87c2dbdb3ffffff | Rio Grande do Sul | POLYGON ((-55.73985 -30.76760, -55.73253 -30.7... |
| 87c2dbdb4ffffff | Rio Grande do Sul | POLYGON ((-55.74169 -30.80518, -55.73436 -30.7... |
| 87c2dbdb5ffffff | Rio Grande do Sul | POLYGON ((-55.76182 -30.79326, -55.75450 -30.7... |
| 87c2dbdb6ffffff | Rio Grande do Sul | POLYGON ((-55.72063 -30.79831, -55.71331 -30.7... |
1544274 rows × 2 columns
Show code cell source
# Plot the original and tessellated geometries in a 2x2 grid
fig, axs = plt.subplots(2, 2, figsize=(16, 8))

# Extract bounds for consistent axis limits across subplots
x_min, y_min, x_max, y_max = BRA.total_bounds

# Plot the original geometry
ax = axs[0][0]
BRA.plot(ax=ax, color="blue", edgecolor="white")
ax.set_title("Original")
ax.set_xlim(x_min, x_max)
ax.set_ylim(y_min, y_max)
ax.set_axis_off()

# Plot tessellation at H3 resolution 3
ax = axs[0][1]
tessellate(BRA, resolution=3).plot(ax=ax, color="#ba3c3c", edgecolor=None)
ax.set_title("Tessellation H3 res 3")
ax.set_xlim(x_min, x_max)
ax.set_ylim(y_min, y_max)
ax.set_axis_off()

# Plot tessellation at H3 resolution 5
ax = axs[1][0]
tessellate(BRA, resolution=5).plot(ax=ax, color="#ba3c3c", edgecolor=None)
ax.set_title("Tessellation H3 res 5")
ax.set_xlim(x_min, x_max)
ax.set_ylim(y_min, y_max)
ax.set_axis_off()

# Plot tessellation at H3 resolution 7
ax = axs[1][1]
tessellated_gdf.plot(ax=ax, color="#ba3c3c", edgecolor=None)
ax.set_title("Tessellation H3 res 7")
ax.set_xlim(x_min, x_max)
ax.set_ylim(y_min, y_max)
ax.set_axis_off()

plt.tight_layout()
plt.show()