Ambient Air Quality in Kochi and Trivandrum#
Air pollution is one of the greatest environmental risk to health, contributing to respiratory and cardiovascular diseases, cancer, and premature death. Tracking air pollution levels can help governments and policy makers make informed policies and decisions to improve public and environmental health.
There are a few common air pollutants that are frequently monitored as a proxy to achieving good air quality in cities.
Particulate Matter (PM)
RSPM/PM10/PM2.5: PM is a common proxy indicator for air pollution. There is strong evidence for the negative health impacts associated with exposure to this pollutant. The major components of PM are sulfates, nitrates, ammonia, sodium chloride, black carbon, mineral dust and water. PM10 are for particles with a diameter of 10 micrometers or less, while PM2.5 are for fine particles with a diameter of 2.5 micrometers or less. These are particularly harmful as they can penetrate deep into the lungs and even enter the bloodstream.
Gaseous Pollutants
SO2: SO2 is a colourless gas with a sharp odour. It is produced from the burning of fossil fuels (coal and oil) and the smelting of mineral ores that contain sulfur.
NO2: NO2 is a gas that is commonly released from the combustion of fuels in the transportation and industrial sectors.
Data#
Air Pollutant Data#
The data was downloaded from www.kerala.data.gov and is available for the years 1987 to 2002 and 2005 to 2015. Data for the years 2003 and 2004 are not available. Each year is recorded in a separate downloaded EXCEL file.
Each file generally included:
The station code where the data was recorded (Stn Code)
Date of record (Sampling Date)
Place of record (City/Town/Village Area)
Agency
Type of location
SO2 values
NO2 values
RSPM/PM10 values
SPM values
PM2.5 values
The completeness of data varies by year and city.
Methodology#
Data for 27 years were concatenated and pre-processed. Columns were standardized whenever possible. However, as the recording format varies from year to year, some human errors may have occurred in the process of standardizing the data. Due to lack of data for some columns, only SO2, NO2 and RSPM/PM10 values were used for analysis and visualization. It is also important to note that data quality varies across cities and years.
A look at the data#
Columns within the data (First five entries)#
| Stn Code | Sampling Date | Month | Year | State | City/Town/Village/Area | Agency | Type of Location | SO2 | NO2 | RSPM/PM10 | SPM | Location of Monitoring Station | PM 2.5 | |
|---|---|---|---|---|---|---|---|---|---|---|---|---|---|---|
| 0 | 29.0 | 10/3/1987 | 3.0 | 1987 | Kerala | Cochin | Kerala Pollution Control Board | Industrial | NaN | 2.9 | NaN | NaN | NaN | NaN |
| 1 | 30.0 | 4/5/1988 | 5.0 | 1988 | Kerala | Cochin | Kerala Pollution Control Board | Industrial Area | NaN | NaN | NaN | 79.0 | NaN | NaN |
| 2 | 31.0 | 4/5/1988 | 5.0 | 1988 | Kerala | Cochin | Kerala Pollution Control Board | Industrial Area | NaN | NaN | NaN | 88.0 | NaN | NaN |
| 3 | 32.0 | 4/5/1988 | 5.0 | 1988 | Kerala | Cochin | Kerala Pollution Control Board | Industrial Area | NaN | NaN | NaN | 98.0 | NaN | NaN |
| 4 | 33.0 | 4/5/1988 | 5.0 | 1988 | Kerala | Cochin | Kerala Pollution Control Board | NaN | NaN | NaN | NaN | 88.0 | NaN | NaN |
All cities available in dataset#
Some cities are duplicated (E.g. ‘Cochi’ and ‘Kochi’ are the same cities)
Data preprocessing:
Renaming duplicated cities to unified names
Removing null values
Standardizing date format
Aggregating data by yearly average
['Cochin',
 'Kotttayam',
 'Kottayam',
 'Kozhikode',
 'Trivendrum',
 'Palakkad',
 'Kochi',
 'Trivandrum',
 'Alappuzha',
 'Kollam',
 'Malappuram',
 'Thiruvananthapuram',
 'Pathanamthitta',
 'Thissur',
 'Wayanad']
Observations#
Kochi has been managing PM 10 and SO2 levels well, but NO2 levels are on the rise, especially since mid-2015.
Air Quality is generally worse in Trivandrum than Kochi.
Using Machine Learning to predict air pollution levels (NO2) for future years in Kochi#
Random Forest Regressor#
| Stn Code | Sampling Date | Month | Year | State | City/Town/Village/Area | Agency | Type of Location | SO2 | NO2 | RSPM/PM10 | SPM | Location of Monitoring Station | PM 2.5 | |
|---|---|---|---|---|---|---|---|---|---|---|---|---|---|---|
| 0 | 29.0 | 10/3/1987 | 3.0 | 1987 | Kerala | Cochin | Kerala Pollution Control Board | Industrial | NaN | 2.9 | NaN | NaN | NaN | NaN |
| 1 | 30.0 | 4/5/1988 | 5.0 | 1988 | Kerala | Cochin | Kerala Pollution Control Board | Industrial Area | NaN | NaN | NaN | 79.0 | NaN | NaN |
| 2 | 31.0 | 4/5/1988 | 5.0 | 1988 | Kerala | Cochin | Kerala Pollution Control Board | Industrial Area | NaN | NaN | NaN | 88.0 | NaN | NaN |
| 3 | 32.0 | 4/5/1988 | 5.0 | 1988 | Kerala | Cochin | Kerala Pollution Control Board | Industrial Area | NaN | NaN | NaN | 98.0 | NaN | NaN |
| 4 | 33.0 | 4/5/1988 | 5.0 | 1988 | Kerala | Cochin | Kerala Pollution Control Board | NaN | NaN | NaN | NaN | 88.0 | NaN | NaN |
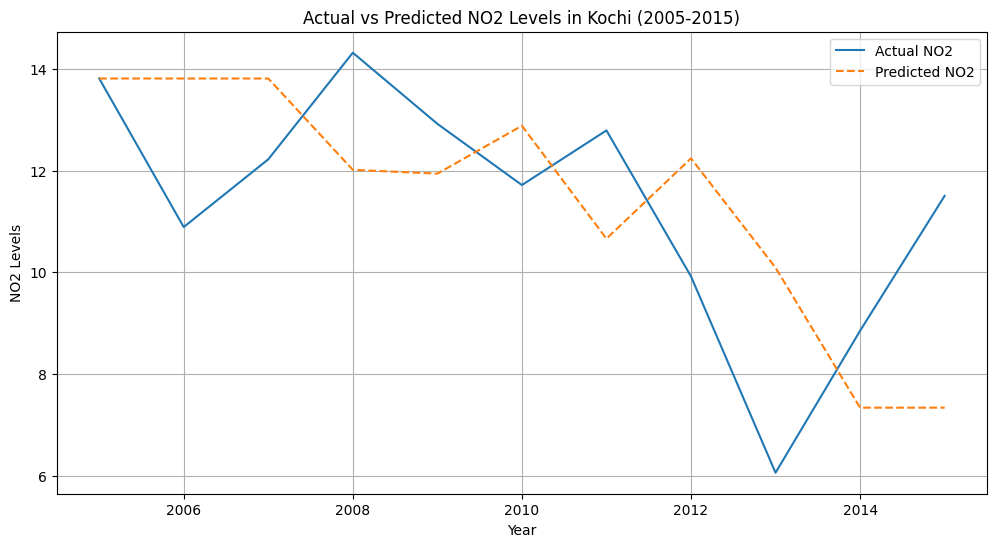
Model Performance#
R2 is a measure of how well the independent variables explain the variability of the dependent variable. It ranges from 0 to 1 (and can be negative in certain cases).
RMSE is the square root of the average of the squared differences between predicted and actual values. It measures the average prediction error in the same units as the dependent variable.
R-squared: -0.13495601528962808
RMSE: 2.417655303596738
R2 of -0.13495 indicates that the model if performing worse than the mean of the dependent variable.
RMSE of 2.417 indicates that on average, the model’s predictions deviate from the actual NO2 levels by 2.417 units.
Possible Reasons for Poor Performance#
Dataset is too small, or data is too noisy.
Model not the best fit.
Feature (year) might not be sufficient, more features might be helpful.
Overfitting or Underfitting of data present.
Future work for improvements#
Adding more features to the model (such as weather, traffic data etc.)
Testing a few more models and compare the results.
Further data preprocessing.
Model tuning - experimenting with different hyper parameters for the model.